| Issue |
A&A
Volume 699, July 2025
|
|
|---|---|---|
| Article Number | A106 | |
| Number of page(s) | 12 | |
| Section | The Sun and the Heliosphere | |
| DOI | https://doi.org/10.1051/0004-6361/202453595 | |
| Published online | 01 July 2025 | |
Merging plasmoids and nanojet-like ejections in a coronal current sheet
1
Instituto de Astrofísica de Canarias, 38205 La Laguna, Tenerife, Spain
2
Universidad de La Laguna, 38206 La Laguna, Tenerife, Spain
⋆ Corresponding authors: This email address is being protected from spambots. You need JavaScript enabled to view it.
; This email address is being protected from spambots. You need JavaScript enabled to view it.
; This email address is being protected from spambots. You need JavaScript enabled to view it.
Received:
23
December
2024
Accepted:
4
May
2025
Abstract
Context. Forced magnetic reconnection is triggered by external perturbations, which are ubiquitous in the solar corona. This process plays a crucial role in the energy release during solar transient events, which are often associated with electric current sheets (CSs). The CSs can often disintegrate through the development of the tearing instability, which may lead to the formation of plasmoids (magnetic islands, or twisted flux ropes in 3D) in the nonlinear phase of evolution. However, the complexity of the dynamics and the magnetic and thermodynamic evolution due to the coalescence of the plasmoids are not fully understood.
Aims. We explore the departure of the CS from its equilibrium configuration through a reconnection process characterized by the formation of plasmoids with a guide field, their mutual approach and eventual coalescence, and we investigate the complex magnetic topology and thermodynamic evolution in and around the merged plasmoids.
Methods. We used a resistive magnetohydrodynamic simulation of a 2.5D current layer embedded in a stratified medium in the solar corona, incorporating field-aligned thermal conduction using the open-source code MPI-AMRVAC. Multiple levels of adaptive mesh-refined grids were used to resolve the fine structures that result during the evolution of the system.
Results. The instability in the CS was triggered by imposing impulsive velocity perturbations concentrated at three different locations in the upper half along the CS plane. This led to the formation of plasmoids and their later coalescence. We demonstrate that a transition from purely 2D reconnection to 2D reconnection with a guide field takes place at the interface between the plasmoids as the latter evolve from the pre-merger to the merged state. The small-scale, short-lived, and collimated outflows during the merging process share various physical properties with the recently discovered nanojets. The subsequent thermodynamic change within and outside the merged plasmoid region is governed by the combined effect of Ohmic heating, thermal conduction, and expansion/contraction of the plasma.
Conclusions. Our results imply that impulsive perturbations in coronal CSs can be the triggering agents for the coalescence of plasmoids. This then leads to the subsequent magnetic and thermodynamic change in and around the CS.
Key words: instabilities / magnetic reconnection / magnetohydrodynamics (MHD) / Sun: corona
© The Authors 2025
 Open Access article, published by EDP Sciences, under the terms of the Creative Commons Attribution License (https://creativecommons.org/licenses/by/4.0), which permits unrestricted use, distribution, and reproduction in any medium, provided the original work is properly cited.
This article is published in open access under the Subscribe to Open model. This email address is being protected from spambots. You need JavaScript enabled to view it. to support open access publication.
1. Introduction
Magnetic reconnection is a fundamental process in which the change of the magnetic topology is associated with the conversion of magnetic energy into thermal and kinetic energy, and possibly with the acceleration of charged particles. This is thought to play an important role in different types of eruptive phenomena in the solar atmosphere, such as flares (Giovanelli 1939, 1947, 1948; Priest & Forbes 2000; Hesse & Cassak 2020), coronal mass ejections (Gosling et al. 1995; Schmidt & Cargill 2003; Karpen et al. 2012), and coronal jets (Yokoyama & Shibata 1996; Pariat et al. 2009; Moreno-Insertis & Galsgaard 2013; Archontis & Hood 2013; Wyper & DeVore 2016). These phenomena are often associated with the electric current sheets (CSs) that are formed when opposite-polarity magnetic field lines come in close proximity of each other and regions with a high current density are formed and confined in a surface.
It was first suggested by Furth et al. (1963) that reconnection might be triggered through small perturbations of a current layer, which leads to the fragmentation of the CS as part of the phenomenon known as the tearing instability (TI). Using linear analysis in 2D, Loureiro et al. (2007) showed that a chain of magnetic islands can form in a single CS due to the development of the TI. These magnetic islands, also called plasmoids, may gradually grow in size in the nonlinear regime under favorable conditions; they are basically a bundle of magnetic field lines wound about a common center that encloses plasma within, and it is magnetically isolated from its surroundings. In 3D, the plasmoids adopt the form of twisted magnetic flux ropes. Bhattacharjee et al. (2009), Huang & Bhattacharjee (2010), Shen et al. (2011), Bárta et al. (2011), Mei et al. (2012) advanced the analysis of the TI, investigating the plasmoid instability in CSs that are not subject to slow Sweet-Parker reconnection, but are inherently unstable to the formation of plasmoids for high Lundquist numbers (⪆104). Through 2D numerical simulations, they showed that a single reconnecting CS can break up into multiple interacting reconnection sites. The effect of temperature-dependent resistivity and thermal conduction for the fast reconnection process in a single CS has been studied by Ni et al. (2012) in a 2D geometry. They found that the temperature enhancement is stronger inside the magnetic islands than at the X-points. The inclusion of nonadiabatic effects such as radiative cooling and background heating can lead to a thermal runaway process, as reported by Sen & Keppens (2022), in which cool condensations are formed in a coupled tearing-thermal unstable process and are trapped inside the plasmoids. The islands formed in the CS by the initial reconnection event are attracted to each other by the parallel currents at the O-points in their center. This results in the coalescence of the islands in a further reconnection event, as also proposed by Schumacher & Kliem (1997). The self-similar structure of the CS connecting coalescing islands is the mechanism by which the plasmoid instability accelerates reconnection to a fast regime (Bhattacharjee et al. 2009; Huang & Bhattacharjee 2010), and it may contribute significantly to the energy release. Sen et al. (2023) extended the study of coupled tearing-thermal evolution in a 3D geometry by incorporating the nonadiabatic effects of radiative cooling, background heat, and thermal conduction. This showed the development of magnetic flux ropes and the formation of cool-condensed plasma in the vicinity of the fragmented CS due to reconnection-driven thermal instability. CSs in the solar corona can be perturbed by external MHD flows, such as linear waves or shock waves, leading to forced magnetic reconnection. Observations of these types of events were reported by Fárník et al. (1983), Wang et al. (2001), Ofman & Liu (2018), Zhou et al. (2020) and references therein for the flare scenario. They have received limited attention in numerical models to date, however. Examples include Sakai & Washimi (1982), Sakai (1983), Odstrcil & Karlicky (1997), Potter et al. (2019), all of which used a (localized) anomalous resistivity to facilitate the reconnection, and Mondal et al. (2024), who included uniform resistivity in their model. None of the above numerical models focused on the magnetic and thermodynamic evolution due to merging of plasmoids, however. This is an important aspect in the plasmoid-mediated fast reconnection scenario, and it therefore warrants deeper investigation.
In the present paper, we investigate the process of merging of two plasmoids created by the tearing of an initially straight CS. To that end, we use a bidirectional velocity pinch concentrated at different locations in the CS plane so that two plasmoids are created that subsequently coalesce. This is different to the case of a unidirectional velocity pulse applied at the CS center, as prescribed by Mondal et al. (2024). The use of an external velocity pulse in our model is more realistic for transient disturbances than a periodic function in time, as prescribed by Potter et al. (2019). Additionally, we incorporate a stratified atmosphere with solar gravity and thermal conduction in our model. The paper is organized as follows. In Section 2 we describe the numerical model with the initial configuration and the algorithmic aspects of the boundary conditions. In Section 3 we report the main results of the study and analyze them. Section 4 addresses the significance of the work for a typical coronal medium, summarizes the key findings, the scope of future improvement, and finally concludes about the usefulness of our findings for future studies.
2. Physical and numerical framework of the model
To investigate the small-scale dynamics and the magnetic and thermodynamic evolution in a plasmoid-producing coronal CS, we set up a resistive MHD simulation in a 2.5D Cartesian geometry using the MPI-Adaptive Mesh Refinement Versatile Advection Code (MPI-AMRVAC) (Porth et al. 2014; Xia et al. 2018; Keppens et al. 2021, 2023). We assumed the initial distribution and evolution of all quantities to be invariant in the z-direction, but the magnetic field and the velocity vectors can have nonzero z−components. The initial magnetic field configuration only depends on the horizontal coordinate x,
 (1)
(1)
 (2)
(2)
 (3)
(3)
which corresponds to a current sheet (CS) that extends all along the y−direction and covers a distance on the order of λ along the x-axis. The module of the magnetic field is |B0| in the whole domain, and its direction rotates in the vertical y − z plane from 180 to 0 degrees with respect to the positive y-axis as the current sheet is crossed from left to right along the x-axis. The spatial domain of the simulation spans between x = −20 to 20 Mm, and y = 0 to 40 Mm. We used a typical coronal magnetic field strength of B0 = 6 G, and λ = 100 km. The initial pressure and density distributions were taken to correspond to a hydrostatic stratification of uniform temperature T0,
 (4)
(4)
 (5)
(5)
with H the scale-height, given by  , g the solar gravity, and
  the gas constant. We used standard coronal values for the temperature, T0 = 1 MK, and for the atomic mass per particle, μ = 0.6 g mol−1, which yield H ≈ 50 Mm. The pressure and density at the basis (y = 0) were p0 = 0.42 dyne cm−2 and ρ0 = 3.14 × 10⁻¹⁵ g cm−3. The plasma-β varied between 0.30 and 0.18 from y = 0 to y = 40 Mm. The base resolution of the simulation was taken as 384 grid cells in the x and y directions, with two additional levels of AMR, so that the smallest cell size was ≈26.04 km in either direction. The (de-)refinement is based on the errors estimated on the gradients of the instantaneous density and magnetic field components at each time step (Lohner 1987). We used a uniform diffusivity of η = 2.33 × 1012 cm2 s−1, which corresponds to a Lundquist number SL = vaL/η ≈ 1.3 × 10⁴ (where L is the characteristic length scale imposed by the current sheet, and va is the Alfvén speed at the base of the CS, both calculated at the initial time). The initial magnetic field configuration (Equations 1–3) was force-free, and the system was in initial hydrostatic equilibrium. This corresponds to a mechanical balance of the system at the initial state (t = 0). To trigger the reconnection in the CS, we used a horizontal velocity perturbation (vp) at multiple vertical locations that were concentrated in the CS region,
 (6)
(6)
Here, Ly = 40 Mm is the vertical span of the CS, and the Alfvén speed was based on the initial density and magnetic field strength  We used n = 3 to pinch the CS through horizontal flows concentrated around three different heights (y = 23.33, 30, and 36.67 Mm) and f = 0.05, which gives a maximum |vp|≈37 km s−1. This prescription of the velocity perturbation corresponds to a more intense pinching higher along the y-axis. We used the classical magnetic-field aligned heating rate associated with heat conduction as follows: ∇ ⋅ [κ|| b (b⋅∇) T], with b the unit vector along the magnetic field lines, and κ∥ = 10−6 T5/2 erg cm−1 s−1 K−1 is the Spitzer-type thermal conductivity. Thermal conduction was zero at the initial state of the system because of our isothermal atmosphere assumption, but it plays a role when the system deviates from the isothermal condition as time evolves.
The MHD equations were solved numerically using a three-step third-order Runge-Kutta time integration method with the Van Leer flux limiter (van Leer 1974) and total variation diminishing Lax-Friedrichs (TVDLF) flux scheme. We used the splitting option of the magnetic field variable B available in AMR-VAC, in which it is decomposed into a steady background term and a time-dependent deviation part (Xia et al. 2018). We used a symmetry condition (which copies the cell values of the physical boundaries to the ghost cells in a symmetric fashion) for ρ, p, vx, vy, and vz at the side boundaries. For the magnetic field components, we set By = ±B0 at the right and left boundaries and zero for the Bx and Bz components. At the top and bottom boundaries, p and ρ were set according to the hydrostatic assumption. All the velocity components at the top and bottom boundaries were set to obey a symmetry condition, and we additionally clipped the inflows to zero for the vy component at the top and bottom boundaries. By and Bz are symmetric (i.e., ∂By/∂y = 0, ∂Bz/∂y = 0), and Bx = 0 at the top and bottom boundaries. These boundary conditions maintain the solenoidality of the magnetic field at all boundaries. We also used the divergence of  cleaning with a parabolic diffusion method in the whole domain (Keppens et al. 2003, 2023).
3. Results and analysis
3.1. Formation of plasmoids and their dynamics
The velocity perturbation in the CS squeezes the opposite-polarity magnetic field lines, which initiates magnetic reconnection at the central vertical axis (x = 0) and destabilizes the CS. The initial pulses in vx from either side of this axis collide soon after t = 0. They then bounce back and move away from the y-axis as weak magnetosonic shocks, and they leave the domain through the side boundaries at t ≈ 40 s. The initial compression of the CS is enough to start the tearing mode instability in it, which leads to the gradual development of plasmoids, as shown in the upper panel of Figure 1 and the associated animation (available online). We note the development of two primary plasmoids at y ≈ 33 and 27 Mm at t ≈ 40 s. We call them the upper and lower plasmoid, respectively, and we focus the discussion in the remainder of the paper on them. The growth of magnetic islands formed at different heights is not identical: The pinching by the velocity pulse, vp(y) (see Equation (6)) has velocities of 36.8 km s−1, 35.7 km s−1, and 34.5 km s−1 at y = 36.67, 30, and 23.33 Mm, respectively. This causes more intense reconnection higher in the CS. On the other hand, the reconnection at these three levels sweeps plasma with a purely planar field (i.e., with a zero Bz component) from the sides of the simulation into the central axis and toward the plasmoids. At the same time, the Bz field contained in the CS is shuffled toward the plasmoid interior: the plasmoids become solenoids, with a guide field pointing along the symmetry axis z, and they are surrounded by plasma with a purely planar field. The energy released via Ohmic heating at the CS, especially at the reconnection sites, increases the temperature, which is the reason for the hot plasma [log T(K)∼6.5] in the fourth column of Figure 1. In addition to the two major plasmoids, a plasmoid-like structure starts at y ≈ 20 Mm and quickly travels toward the lower boundary. It is generated immediately below the lowest pulse at the initial time, located at y = 23.33 Mm. Because of the initial pulse, the reconnection rate above that plasmoid is higher than below it, leading to a marked imbalance of the vertical component of the Lorentz force (LF) and to a fast downward motion. A similar feature was obtained in the experiment of Popescu Braileanu & Keppens (2023), who described a single velocity pulse in the whole domain.
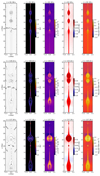 |
Fig. 1. Distribution of magnetic field lines projected in the x − y plane, and spatial variations of absolute current density (|Jz|), plasma density, temperature, and thermal pressure are shown from left to right in each panel. The evolution of the above quantities for three different times t = 81.58, 120.22, and 137.39 s are shown in the top, middle, and bottom panels, respectively. The units of |Jz| are chosen arbitrarily, and the maximum saturation limit of the color bar is chosen as 2 for clarity of the enhanced current structures. An associated animation (merging_plasmoids.mp4) corresponding to this figure is available online. |
Figure 2 illustrates the distribution of the vertical component of the Lorentz force (LF), the gas pressure gradient force  , and the gravity force (ρg) along the vertical line at x = 0 for t = 81.58 s, which is the time shown in the top row in Figure 1. The vertical component of the LF clearly dominates the other two forces. In Figure 3, we present the spatial distribution of the vertical component of the LF in the regions occupied by the lower and upper plasmoid at t = 81.58 s; the location of these plasmoids in the y-direction is also highlighted with gray shading in Figure 2. The red versus blue area distribution in either plasmoid appears to have a rough top-bottom symmetry. To determine the sign of the vertical acceleration that is imparted to the plasmoid by the LF, we employed a binary masking to identify pixels with an unsigned vertical component of the LF above a threshold value (namely, 1 × 10⁻⁸ dyne cm−3), which, according to Figure 3, can serve as a proxy for the location of the plasmoid. The integration of the y-component of the LF over the plasmoid region yields −7.3 × 10⁷ dyne cm−1 (upper plasmoid) and −1.3 × 10⁷ dyne cm−1 (lower plasmoid). This corresponds to a fraction 2.3% and 0.49%, respectively, of the integrated unsigned vertical component of the LF. Therefore, in spite of the apparent symmetry, the net LF points downward in both plasmoids. Dividing the integrated (signed) LF by the integrated density of the plasmoid, we obtain an estimate for the center-of-mass acceleration due to the LF, namely, −6.9 km s−2 (upper plasmoid) and −1.3 km s−2 (lower plasmoid). This difference in the acceleration values (factor 5.3) causes the upper plasmoid to approach the lower plasmoid when descending, a process that finally leads to their coalescence, as shown in the middle row of Figure 1 at around t = 120 s and also in the animation accompanying this figure. The sign of the net vertical Lorentz force is most probably a result of the so-called melon-seed expulsion process (Schlüter 1957): The converging flows that create the plasmoids are stronger higher along y. This suggests that the reconnection at the top of either plasmoid is more intense than just below them, and we expect the vertical component of the LF to be stronger at the upper end of the plasmoid than at the lower end, as also shown in Figure 3.
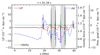 |
Fig. 2. Distribution of the vertical components of the Lorentz force, pressure gradient, and gravity force along y at x = 0 for t = 81.58 s. The regions shaded in gray cover the vertical extent of the lower and upper plasmoids at x = 0. The ordinate scale is different for each curve, as shown in the figure. The horizontal dashed red line is the marker of the zero LF. |
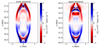 |
Fig. 3. Spatial distribution of the vertical component of the Lorentz force covering the lower (left panel) and upper (right panel) plasmoids at t = 81.58 s. |
The two plasmoids gradually merge into a single larger plasmoid that contains two very small solenoids (see the left panel of the bottom row of Figure 1). The merger is achieved through field line reconnection across the interface of the two plasmoids. This reconnection process can be seen to evolve in time from purely 2D reconnection to 2.5D reconnection, that is, 2D reconnection with a guide field along the ignorable coordinate. As described above, the initial configuration of the plasmoid is that of a solenoid-like twisted flux rope with the guide field pointing in the invariant z-direction and surrounded by a field contained in the xy plane. When they first meet at t = 120.22 s, for instance, the magnetic field lines that touch essentially point in the x-direction, but in opposite senses. This is shown in the left panel of Figure 4, which shows the three components of the magnetic field along the y-axis at x = 0. The result is a process of standard 2D reconnection. At the time of the central panel (t = 137.39 s), the cores of the solenoids instead touch already: The 2.5D reconnection is clear, whereby the reconnecting component is still Bx, but now the dominant guide field is in the z-direction so that the mutual angle between the reconnecting elements is far from 180°. Additional information of interest about the velocities can be gained through the corresponding profiles of vx and vz along the horizontal axis, which cuts across the reconnection site (Figure 4, right panel). During the initial phase (t = 120.22 s), there is a marked outflow pattern in the x-direction that clearly corresponds to the reconnection outflows of the initial 2D-like configuration. These outflows extend for some 4 Mm on either side of the reconnection point. By t = 137.4 s, the reconnection outflows still have velocities of about 100 km s−1 for vx, but incipient outflows in the z-direction are now also apparent. Additionally, the spatial extent along y has become much narrower. This is shown in the accompanying animation (vx.mp4), which is available online.
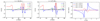 |
Fig. 4. Variation in the magnetic field components at x = 0 along the y direction at t = 120.22 (left) and 137.39 s (middle). The horizontal dashed black lines mark the zero field components. The vertical dashed black lines are located at y = 27.34 and 26 Mm (at x = 0) for the left and middle panels, respectively. The right panel shows the distribution of the vx and vz components along a horizontal axis situated at those values of y at t = 120.22 and 137.39 s, respectively. |
To appreciate the magnetic field line configuration at the reconnection site, we provide in Figures 5 and 6 a 3D view of the field line exchange that occurs at the interface. In Figure 5 we show the configuration during the initial 2D-like phase of the reconnection at t = 120.22 s. We confirm that the field lines at the periphery of the plasmoids basically lie on the xy-plane and that at the contact point, field lines subtending a mutual angle close to 180 deg (see the colors along the field lines, which correspond to Bx) reconnect and are hurled sideways in the x-direction. The color map on the xy plane for vx shows two concentrated outflows with high speeds of approximately ±100 km s−1 that originate in the reconnection site. The central regions of the two plasmoids eventually approach each other. Their field lines have a predominant z-component, with Bz > 0. Their Bx component instead points in opposite directions, and this maintains the transverse current sheet that is apparent at t = 120.2 s and t = 137.4 s in Figure 1. The hybrid field lines shown in Figure 6 (i.e., those that just reconnected and thus link the two plasmoids), drawn for t = 139.5 s, while still having Bz > 0, are hurled away from the reconnection site with a marked curvature, and hence, with a strong Lorentz force and high speeds, as confirmed through the background color map for vx. This is apparent in the left panel. The field lines here were all traced from points in a box that included the central part of the merging plasmoids and the transverse CS. The color along the field lines corresponds to the value of Bz. The field lines from either plasmoid that pass near the CS are mutually inclined, and a few just reconnected field lines (e.g., the green-yellow line) that now link the two merging plasmoids are visible as well. In the right panel, a top view is shown, now on the background of a color map for log T and with field lines traced from the neighborhood of the transverse CS. By magnifying the central part of the figure (see the subpanel in the bottom right corner), we show the curvature of the just reconnected field lines that are being hurled in the ±x-direction. The plasma is strongly heated in the reconnection process. The background map clearly shows that this plasma moves along the resulting field lines, so that the periphery of the merged plasmoid has temperatures of several MK.
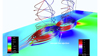 |
Fig. 5. The magnetic field configuration during the initial 2D-like phase of the reconnection associated with the plasmoid merger (t = 120.22 s). A color map is drawn for vx; the field lines are colored according to the value of Bx. The appearance of a small nanojet-like feature is marked by a white arrow. |
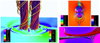 |
Fig. 6. Selected field lines at t = 139.53 s during the merging process of the two plasmoids, showing details of the 2D reconnection with a guide-field process between them. Left panel: Background map for vx (in km s−1). The color along the field lines corresponds to the Bz field component. Top right panel: Top view of the same configuration, but the field lines are now traced from the transverse current sheet where the merger occurs. The background map corresponds to log T. Bottom right panel: Same as the top right panel, but for a selected region highlighting the interface between the upper and lower plasmoids. |
Space-time information on the formation of the various plasmoids and their associated dynamics is shown in Figure 7. We computed a time-distance (TD) map of the plasma density along the vertical line at x = 0. We estimated the speed of the plasmoids by tracking the enhanced density region in the TD map corresponding to the plasmoid motions, and calculated their respective slopes. Most of the identified plasmoids have speeds within the range ≈35 − 290 km s−1. The primary upper and lower plasmoids that appear at around t = 80 s are approximately 3 Mm in size along the vertical direction (marked by the black braces). The downward speed of the upper plasmoid is about 35 km s−1, but the lower plasmoid moves much more slowly, and its global velocity cannot be determined with the same level of accuracy as for the others. When the upper plasmoid starts to merge with the lower one at about t = 120 s, the interface between those plasmoids is pushed downward at a speed of around 60 km s−1. At about t = 137 s, when the merging is complete, the size of the merged plasmoid starts to grow vertically and finally reaches a vertical size of ≈8 Mm. It interacts with another (nearly stationary) secondary plasmoid (that forms at y ≈ 20 Mm) at the end of the simulation. The downward-moving plasmoid that appears at y ≈ 20 Mm at about t = 64 s gains a high speed of about 210 km s−1, as indicated by the white arrow in Figure 7, through the imbalance in the vertical component of the Lorentz force, as explained above.
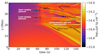 |
Fig. 7. Time-distance map of the density at a vertical (along y) cut at x = 0. The solid lines for estimating the slopes at the selected locations of the time-distance map are marked in black. The vertical extent of the upper and lower plasmoids is marked with braces and indicated by the blue arrows. The interface between the plasmoids is marked with a cyan arrow. |
3.2. Energetics and thermodynamic evolution
To quantify the magnetic energy flux, we calculated the vertical component of the Poynting flux vector,
![Mathematical equation: $$ \begin{aligned} S_y = \frac{1}{4\pi } [v_y\,(B_x^2+B_z^2)-B_y\,(v_x\,B_x+v_z\,B_z)], \end{aligned} $$](/articles/aa/full_html/2025/07/aa53595-24/aa53595-24-eq12.gif) (7)
(7)
which probably is the main component of the energy transport in a low plasma-β medium such as the solar corona. We estimated Sy before and after the plasmoids were fully merged, as shown in Figure 8. At the earlier time (left panel and blue curve in the right panel), the energy transport by the upper plasmoid, which is moving downward, is more intense than that corresponding to the lower plasmoid. Later, after merging (middle panel and red curve in the right panel), the energy transport is dominated by the resulting downward-moving plasmoid. To further analyze the energy balance, we considered the equation for the internal energy. The calculation we made was for the simplest ideal gas without ongoing ionization/recombination processes. We can therefore express this equation in terms of the logarithmic change in the temperature in time as follows:
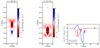 |
Fig. 8. Spatial distribution of the vertical Poynting flux vector Sy in the early and advanced merging stages of the plasmoids at t = 120.22 (left) and t = 137.39 s (middle), respectively. The right panel shows the vertical distribution of Sy at x = 0 at t = 120.22 and t = 137.39 s. |
 (8)
(8)
where D/Dt is the Lagrange (or material) derivative, ϵ is the internal energy of the gas per unit volume, and γ = 5/3 is the customary ratio of specific heats. In Eq. (8) we recognize the two possible entropy sources in the system, namely Ohmic heating (Hohm) and heat deposition by heat conduction (Qcon), given by
 (9)
(9)
![Mathematical equation: $$ \begin{aligned} Q_{\rm con}&= \nabla \cdot \left[\kappa _{||}\,\mathbf{b}\, (\mathbf{b} \cdot \nabla )\, T\right]. \end{aligned} $$](/articles/aa/full_html/2025/07/aa53595-24/aa53595-24-eq15.gif) (10)
(10)
In addition, we call Π the remaining term,
 (11)
(11)
which corresponds to the change in temperature caused by expansion/contraction even in the absence of entropy sources. Equation (8) expresses the inverse of the timescale for the change in the temperature as a combination of the inverse values of the timescales associated with Ohmic heating (τohm), heat conduction (τcon), and expansion/contraction (τΠ) each with its sign, with the timescales defined as
 (12)
(12)
 (13)
(13)
 (14)
(14)
The distribution of Hohm, Qcon, and Π along the vertical axis at x = 0 for t = 137.39 s is shown in Figure 9, which also includes a temperature profile along the same cut. The temperature throughout the midplane x = 0 at this time is higher than the initial uniform temperature (1 MK) and has a maximum value of ≈3.9 MK. This matches the findings of previous sections (e.g., Figure 1, bottom panel in the fourth column, and Figure 6, right panel). The merging of the two plasmoids leads to the formation of a small horizontal CS at y ≈ 26 Mm (as discussed in Section 3.1) and to small localized enhanced current density structures (see the bottom panel in the second column of Figure 1). This high-current region contributes to high Ohmic heating and to a corresponding temperature enhancement. This is reflected in Figure 9, which shows the nearly spatial coincidence of a marked spike in the Ohmic heating and temperature curves at y = 26 Mm. Magnetic field-aligned thermal conduction redistributes the thermal energy, which homogenizes the temperature along the field lines in the merged plasmoid. As a result, the enhanced temperature region appears to be a rim-like structure around the merging plasmoids, with a horizontal strip that crosses the middle, as shown in the top right panel of Figure 6 and in the central panel of Figure 10. The temperature along the horizontal cut at y = 26 Mm, which passes through the horizontal strip region, dips near x = 0 (Figure 10, blue curve in the right panel). The rim at the periphery of the plasmoid is hotter than the horizontal patch region because the rim is created during the 2D phase of reconnection, in which the temperatures at the rim of the upper plasmoid reach about 4 MK at t = 81.58 s, as shown in Figure 1 (top panel in the fourth column). In the advanced merging state (at t = 137.39 s), the thermal deposition due to conduction is more intense at the rim than in the horizontal strip region, where the guide field (Bz) diminishes the effective temperature gradient along the field lines (see the field lines in Figure 6). Similarly, the absence of a dip in the temperature distribution at x = 0 along the y = 27.5 Mm (green) line in the right panel in Figure 10 arises because the ellipse is nearly isothermal as a consequence of the thermal conduction. Another point worth noticing concerns the downward-moving (primary) plasmoid. When it approaches the lower (primary) plasmoid, the plasma on the trailing side of the former has a high vx (around 100 km s−1) and vy (around 300 km s−1) flows and expands (negative Π), as shown in the left panel of Figure 10. This reduces the temperature (see the dark patches at y ≈ 28.5 Mm in the middle panel of Figure 10). The minimum temperature in these patches is ≈0.8 MK (as shown by the red curve in the right panel of Figure 10), which is lower than the initial isothermal temperature of 1 MK.
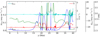 |
Fig. 9. Vertical distributions of the Ohmic heating rate (Hohm), expansion/contraction rate (Π), heating rate by thermal conduction (Qcon), and temperature (T) at x = 0 for the time t = 137.39 s. The horizontal dashed red and cyan lines represent the zero markers for Π and Qcon, respectively. |
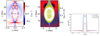 |
Fig. 10. Expansion/contraction rate (left) and temperature distribution (middle) in the region of the merging plasmoids at t = 137.39 s. The dashed horizontal (cyan) lines in the middle panel mark the levels y = 26, 27.5, and 28.5 Mm. Right panel: Temperature distribution along the horizontal direction for the three y-levels marked by the dashed lines in the middle panel. The minimum temperature along the y = 28.5 Mm line (red curve in the right panel) is 0.8 MK. |
To estimate the role of Ohmic heating, thermal conduction, and expansion/contraction in the temperature evolution in the region with appreciable electric currents, we considered the characteristic timescales τohm, τcon, and τΠ in it. To do this, we first marked the pixels in which the absolute current density |J| exceeds a threshold value of Jth, which is taken as 5% of the peak value of |J| at the initial state (t = 0). We call this area the threshold-exceeding current zone (TECZ) in the rest of this section. Then, we calculated the fractional counts of pixels that satisfied the criteria τohm > τΠ, τohm > τcon, or τΠ > τcon. The time evolution of these fractional counts is shown in Figure 11. The blue curve shows the fractional count of pixels with τohm > τΠ. The initial values correspond to the velocity map imposed as initial condition; at this time, 16.6% of the region selected for this calculation evolves with a stronger influence by the contraction associated with the initial velocity pulse than because of Ohmic heating. This fraction falls sharply in the first 5 seconds of the simulation as the effect of the velocity pulse recedes from the CS region, and it remains within the range ≈1 − 5% until t ≈ 60 s. Thereafter, when the plasmoids develop gradually, the area in which expansion/contraction predominates increases, and it gradually occupies most of the region up to 76.8% at the end of the simulation. For the τohm > τcon, and τΠ > τcon curves (in red and green, respectively), conduction is a slower process than Ohmic heating and expansion/contraction in the entire region at the very beginning of the evolution, as a consequence of the initial uniform-temperature condition. Heat conduction becomes effective when strong temperature inhomogeneities appear in the medium. The area in which conduction is strong increases gradually compared with Ohmic heating and expansion/compression. From about t = 100 s onward, most (more than 50%) of the region we selected for this comparison has a shorter characteristic time for heat conduction than for Ohmic heating and expansion/compression. The corresponding fractional regions gradually increase to ≈84.3% and 76.8% at the end of the simulation for the τohm > τcon (red curve) and τΠ > τcon (green curve) criteria, respectively. We also compared the fractional regions for the predominance of the different timescales at two of the important stages in the calculation: the premerger state at t = 81.58 s, and the advanced merging state at t = 137.39 s, as marked by the two vertical dashed lines in Figure 11. For the τΠ > τcon criteria, the value increases from 46% to 70% from the premerger to the advanced merging states. Similarly, for the other two criteria, the fraction increases from 32.2% to 64.6% (for τohm > τΠ), and from 34% to 73.3% (for τohm > τcon) from the premerger to advanced merging states.
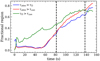 |
Fig. 11. Temporal variation in the fractional counts of pixels that satisfy the conditions indicated in the legend. The vertical dashed lines are marked at t = 81.58 and 137.39 s. |
To show the relative importance of the three processes that can cause a change in the temperature in the different regions, we calculated the spatial distribution of the ratios τΠ/τcon, τohm/τΠ, and τohm/τΠ for the pixels in the TECZ, that is, those that satisfied the condition |J|> Jth. We calculated this for two time instances: first, for the pre-merger stage at t = 81.58 s, and, then, for the advanced merging state at t = 137.39 s. The results are shown in Figure 12. For τΠ/τcon (left column, top panel for t = 81.58 s and bottom panel for t = 137.39 s), the most notable expansion/contraction dominated regions (deep blue areas) are confined within the plasmoids before the merging occurs (at t = 81.58 s), and within the region with very small plasmoids (between y ≈ 24.5 − 27 Mm around x = 0) in the advanced merged state (at t = 137.39 s). The reason is that the islands are magnetically isolated, and therefore, conduction becomes less effective than expansion/contraction within it. Thermal conduction dominates expansion/contraction significantly at the rim of the top and bottom plasmoids in the premerger state and in some parts of the periphery region of the plasmoid in the advanced merging state. For the ratio τohm/τΠ (middle column), the dominance of expansion / contraction compared to Ohmic heating (regions plotted in red in the map) is observed in the necks of the plasmoids (around x = 0, at y ≈ 25, 27.5, 30.5, and 33.5 Mm) for the premerger state (top row, middle panel) and mostly within the islands of very small plasmoids and in the periphery parts of the merged plasmoid when it expands laterally during the merging process, at t = 137.39 s. For τohm/τcon (right column), because of the magnetically isolated structure in the premerger state (top right panel), the magnetic field-aligned conduction is less effective than Ohmic heating (blue areas) inside the top and bottom plasmoids. This situation is reversed (red areas) along the rim of the top and bottom plasmoids. In the advanced merging state (t = 137.39 s), conduction gradually dominates Ohmic heating in most of the rim regions of the merged plasmoid. The interface between the upper and lower plasmoids near x = 0 is dominated by Ohmic heating, as shown in the bottom right panel by the horizontal CS there (see also the second panel in the bottom row of Figure 1).
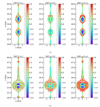 |
Fig. 12. TECZ regions (that satisfy the criterion |J|> Jth) for the pre-merger and advanced merging states at t = 81.58 (top row) and 137.39 s (bottom row). The timescale ratios τΠ/τcon, τohm/τΠ, and τohm/τcon are shown in the left, middle, and right columns, respectively, using logarithmic scales. |
The actual evolutionary timescales for the temperature vary from less than one second to more than 1000 seconds in the different regions of the domain. To facilitate the identification, we present in Figure 13 color maps for the timescales themselves, that is, τΠ, τohm, and τcon, in the TECZ regions, for the premerger and advanced merging states (at t = 81.58 and 137.39 s, respectively). For the premerger state (upper row), the thermal evolution at the rim of the upper and lower plasmoids is clearly determined by the heat conduction (curved segments in blue, shown in the top right panel in Figure 12), with a short timescale shorter than 1 s. In this stage, the interior of the two plasmoids is visible as regions in which the contraction/expansion and the timescales of Ohmic heating determine the thermal evolution. The associated timescale is comparatively long, however, about 102 s. In the advanced stage, the conduction timescale (which is shorter than 1 s) at the rim of a plasmoid that formed at about y = 37.5 Mm dominates, and it also dominates in some regions in the periphery of the merged plasmoid (blue regions in the bottom right panel of Figure 13).
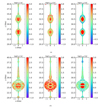 |
Fig. 13. Same as Figure 12, but showing the different characteristic timescales: τΠ (left column), τohm (middle column), and τcon (right column). (a) t = 81.58 s. (b) t = 137.39 s. |
4. Discussion and summary
In this paper, highly collimated flows have been identified coming out of the reconnection site at the interface between the merging plasmoids. In the premerger state at t = 120.22 s, when the two primary plasmoids collide with each other and create a horizontal interface, a reconnection-driven bidirectional outflow in the horizontal direction emerges (see Fig. 4, right panel, and Fig. 5). The maximum velocity of this flow (vx component) is ≈100 km s−1, which is reduced to ⪅50 km s−1 some 520 km upward and downward of the interface (not shown). This implies that the flow is collimated along the x direction; it extends from x ≈ ±0.75 to ±4.5 Mm, where it becomes much lower. At a later time, t = 137.39 s, the outward velocity decreases from its maximum value of ≈100 km s−1 (at x = ±0.75 Mm) to zero at approximately x = ±1.5 Mm (and remains significantly low, with a few km s−1, at larger distances). This indicates that these collimated outflows are short-lived. They last for ≈17 s, during which time the spatial extent of the flow is reduced from about 3.75 to 0.75 Mm. However, this sharp reconnection-driven outflow remains until t ≈ 145 s, and it then reduces to ⪅30 km s−1. The temperature of the outflowing plasma is in the range between ≈1 − 4 MK. We also calculate the ideal-MHD terms in the total energy flux, namely
 (15)
(15)
along the +x−direction in the outflow regions where it reaches its maximum. To estimate the energy transport rate, we multiplied this flux by the area through which the energy is transported, assuming that the width of these flows in the invariant direction is the same as in the x − y plane (approximately 520 km). This calculation was repeated from t = 120.22 to 137.39 s at intervals of 4.29 s. Finally, we integrated this energy rate over this time span to estimate the total energy budget of these ejections. The result is ≈3.3 × 1024 erg, which is in the nanoflare range.
These ejections share various physical properties with the so-called nanojets, which are small-scale, short-lived, collimated outbursts that are observed in the solar corona (Antolin et al. 2021; Sukarmadji et al. 2022). The former authors suggest that nanojet events result from the slingshot effect caused by magnetically tensed, curved magnetic field lines reconnecting at small angles. In contrast, the collimated and short-lived flows that can be associated with the nanojets in our MHD model are a direct consequence of the reconnection that occurs at the interface between coalescing plasmoids, and they occur in the 2D and 2.5D phases of the reconnection process. It is challenging to observe nanojets because a high spatial resolution and temporal cadence are required, and very few observations have therefore been reported to date (e.g., Antolin et al. 2021; Sukarmadji et al. 2022) that were carried out for coronal loop systems. The observations suggest that the plane-of-sky (POS) speed of the nanojets is between 100 − 200 km s−1 (Antolin et al. 2021) and 100 − 286 km s−1 (Sukarmadji et al. 2022), showing a bidirectional structure perpendicular to the magnetic strands. The width and length of these jets are on the order of 500 km and 1 − 3.8 Mm, respectively, and their lifetime is reported to be ≈15 s or shorter. These values agree well with our model prediction. Our model thus motivates future observation campaigns to investigate the occurrence of nanojets in a coronal environment that contains sharp CSs.
Our model is 2.5D and does not incorporate the effect of radiative loss and lower atmospheric coupling to the transition region and the chromosphere, we therefore did not obtain any thermal runaway scenario and no coronal rain, which is different from the nanojet observations reported by Antolin et al. (2021). There is observational evidence of nanojets in a blowout jet scenario without associated coronal rain, however (Sukarmadji et al. 2022). The nanojet-like ejections in our simulation mainly depend on the magnetic reconnection caused by the coalescence of flux ropes in a coronal CS. However, the change in the magnetic and thermodynamic behavior of these ejections when radiative losses and different forms of background heating are included (steady and time-dependent) is an interesting aspect that can be explored in the future in a more realistic 3D model. The exploration of different parameter regimes can also be interesting, to investigate the possible initiation of the tearing and thermal instability in a coupled fashion, which may modify the instability growth rate of the CS (as reported by Sen & Keppens 2022), and the formation of (localized) cool condensations similar to coronal rain or a filament/prominence in the vicinity of a tearing CS (Sen & Keppens 2022; Sen et al. 2023); DeJonghe+Sen:2024.
To investigate the effect of spatial resolution, we also ran the simulation by activating three additional levels of AMR while we kept all the other parameters fixed to achieve a higher (spatial) resolution, such that the smallest cell size was ≈13 km along each direction. We found a similar qualitative evolution of the system: Two primary flux ropes formed in the upper half of the CS, followed by their merging, which led to a reconnection-driven bidirectional nanojet-like ejection from the interface of the upper and lower (primary) plasmoids.
We highlight the key results of this work below.
-
We set up a 2.5D numerical MHD model of a CS embedded in a stratified atmosphere in the solar corona that included a guide field, uniform resistivity, and thermal conduction. The initial magnetic and thermodynamic parameters we selected for this simulation (see Section 2) are representative of a typical solar coronal medium. The equilibrium CS was perturbed by a velocity pulse at three different locations along the CS to initiate forced magnetic reconnection. This led to the disintegration of the original CS and triggered the tearing instability, and multiple plasmoids formed as it evolved in the nonlinear regime. However, we mainly focused on the two primary plasmoids that formed in the upper half of the CS, and we mainly discussed these two plasmoids here.
-
The flows associated with the tearing instability drag the guide field (i.e., the Bz component) into the interior of the plasmoids. This converts them into flux ropes or solenoids, with a guide field that points along the symmetry axis (i.e., along the +z direction) and is surrounded by a purely planar field. The solenoids then move along the CS with speeds in the range ≈34 − 290 km s−1, which agrees well with the observations of plasmoids in a coronal jet spire, as reported by Joshi et al. (2020), who estimated their speed to be between 10 − 220 km s−1. The temperature of the plasmoids in our model is between 0.8 − 4 MK, which also agrees well with the observations by Mulay et al. (2023), who estimated their temperature to be ≈2.2 MK in a jet spire region using the differential emission measure technique. In the experiment, we found an additional downward-moving plasmoid that formed in the lower half of the CS (shown in Figure 1). This plasmoid is a consequence of reconnection-driven outflow, which carries the guide field trapped within it, and leaves a typical Harris CS (i.e., with a nearly zero guide field) behind.
-
When the plasmoids first meet, a secondary transverse CS is formed at their interface in which reconnection occurs. The transition from the initial stages (t = 120.22 s) to the advanced merged stage (t = 139.37 s) is accompanied by a change in character of the reconnection, namely, from simple 2D reconnection to 2.5D reconnection, that is, 2D reconnection with a guide field.
-
During the merging phase of the two primary plasmoids, small collimated bidirectional nanojet-like ejections are produced by magnetic reconnection at the interface between the upper and lower plasmoids. These ejections share various characteristics (size, velocity, duration, and energy) with the nanojets observed by Antolin et al. (2021), Sukarmadji et al. (2022).
-
The temperature evolution within the CS is a combined effect of Ohmic heating, thermal conduction, and expansion/contraction of the plasma. Which of these is predominant can be estimated from their respective characteristic timescales. The field-aligned thermal conduction distributes the thermal energy along the magnetic field lines. This leads to the appearance of a rim-like enhanced temperature region around the merging plasmoids at t = 137.39 s with a horizontal patch at their interface (see the middle panel of Figure 9). This temperature enhancement in the periphery of the merging plasmoids cannot be confirmed with any of the available observations to date, as it requires a very high spatial resolution to resolve these structures. In future work, we will produce synthetic maps to compare them with measurements in the extreme-UV in current satellite missions such as the Atmospheric Imaging Assembly (Pesnell et al. 2012; Lemen et al. 2012) or the High Resolution Imager of the Solar Orbiter campaigns (Rochus et al. 2020).
Our study contributes to the theoretical understanding of the plasmoid-mediated reconnection in coronal CS and the magnetic and thermodynamic evolution caused by the coalescence of two flux ropes (plasmoids), and it might explain small-scale transients (nanojets), which are important aspects for resolving the coronal heating mystery.
Data availability
Movies are available at https://www.aanda.org
Acknowledgments
The authors acknowledge support by the European Research Council through the Synergy Grant #810218 (“The Whole Sun”, ERC-2018-SyG). They thankfully acknowledge the technical expertise and assistance provided by the Spanish Supercomputing Network (Red Española de Supercomputación), as well as the computer resources used: the LaPalma Supercomputer, located at the Instituto de Astrofísica de Canarias. Data visualization and analysis were performed using the yt-project, UCAR’s VAPOR (Li et al. 2019; Pearse et al. 2023), and Visit.
References
- Antolin, P., Pagano, P., Testa, P., Petralia, A., & Reale, F. 2021, Nat. Astron., 5, 54 [NASA ADS] [CrossRef] [Google Scholar]
- Archontis, V., & Hood, A. W. 2013, ApJ, 769, L21 [Google Scholar]
- Bárta, M., Büchner, J., Karlický, M., & Skála, J. 2011, ApJ, 737, 24 [CrossRef] [Google Scholar]
- Bhattacharjee, A., Huang, Y.-M., Yang, H., & Rogers, B. 2009, Phys. Plasma, 16, 112102 [Google Scholar]
- De Jonghe, J., & Sen, S. 2024, MNRAS, 536, 3308 [Google Scholar]
- Fárník, F., Kaastra, J., Kálmán, B., et al. 1983, Sol. Phys., 89, 355 [Google Scholar]
- Furth, H. P., Killeen, J., & Rosenbluth, M. N. 1963, Phys. Fluids, 6, 459 [Google Scholar]
- Giovanelli, R. G. 1939, ApJ, 89, 555 [NASA ADS] [CrossRef] [Google Scholar]
- Giovanelli, R. G. 1947, MNRAS, 107, 338 [NASA ADS] [CrossRef] [Google Scholar]
- Giovanelli, R. G. 1948, MNRAS, 108, 163 [NASA ADS] [CrossRef] [Google Scholar]
- Gosling, J. T., McComas, D. J., Phillips, J. L., et al. 1995, Geophys. Res. Lett., 22, 1753 [NASA ADS] [CrossRef] [Google Scholar]
- Hesse, M., & Cassak, P. A. 2020, J. Geophys. Res.: Space Phys., 125, e25935 [Google Scholar]
- Huang, Y.-M., & Bhattacharjee, A. 2010, Phys. Plasma, 17, 062104 [Google Scholar]
- Joshi, R., Chandra, R., Schmieder, B., et al. 2020, A&A, 639, A22 [NASA ADS] [CrossRef] [EDP Sciences] [Google Scholar]
- Karpen, J. T., Antiochos, S. K., & DeVore, C. R. 2012, ApJ, 760, 81 [NASA ADS] [CrossRef] [Google Scholar]
- Keppens, R., Nool, M., Tóth, G., & Goedbloed, J. P. 2003, Comput. Phys. Commun., 153, 317 [Google Scholar]
- Keppens, R., Teunissen, J., Xia, C., & Porth, O. 2021, Comput. Math. Appl., 81, 316 [Google Scholar]
- Keppens, R., Popescu Braileanu, B., Zhou, Y., et al. 2023, A&A, 673, A66 [NASA ADS] [CrossRef] [EDP Sciences] [Google Scholar]
- Lemen, J. R., Title, A. M., Akin, D. J., et al. 2012, Sol. Phys., 275, 17 [Google Scholar]
- Li, S., Jaroszynski, S., Pearse, S., Orf, L., & Clyne, J. 2019, Atmosphere, 10, 488 [NASA ADS] [CrossRef] [Google Scholar]
- Lohner, R. 1987, Comput. Methods Appl. Mech. Eng., 61, 323 [Google Scholar]
- Loureiro, N. F., Schekochihin, A. A., & Cowley, S. C. 2007, Phys. Plasma, 14, 100703 [Google Scholar]
- Mei, Z., Shen, C., Wu, N., et al. 2012, MNRAS, 425, 2824 [NASA ADS] [CrossRef] [Google Scholar]
- Mondal, S., Srivastava, A. K., Pontin, D. I., Yuan, D., & Priest, E. R. 2024, ApJ, 963, 139 [Google Scholar]
- Moreno-Insertis, F., & Galsgaard, K. 2013, ApJ, 771, 20 [Google Scholar]
- Mulay, S. M., Tripathi, D., Mason, H., Del Zanna, G., & Archontis, V. 2023, MNRAS, 518, 2287 [Google Scholar]
- Ni, L., Roussev, I. I., Lin, J., & Ziegler, U. 2012, ApJ, 758, 20 [Google Scholar]
- Odstrcil, D., & Karlicky, M. 1997, A&A, 326, 1252 [NASA ADS] [Google Scholar]
- Ofman, L., & Liu, W. 2018, ApJ, 860, 54 [NASA ADS] [CrossRef] [Google Scholar]
- Pariat, E., Antiochos, S. K., & DeVore, C. R. 2009, ApJ, 691, 61 [Google Scholar]
- Pearse, S., Li, S., clyne, et al. 2023, https://doi.org/10.5281/zenodo.7779648 [Google Scholar]
- Pesnell, W. D., Thompson, B. J., & Chamberlin, P. C. 2012, Sol. Phys., 275, 3 [Google Scholar]
- Popescu Braileanu, B., & Keppens, R. 2023, A&A, 678, A66 [NASA ADS] [CrossRef] [EDP Sciences] [Google Scholar]
- Porth, O., Xia, C., Hendrix, T., Moschou, S. P., & Keppens, R. 2014, ApJS, 214, 4 [Google Scholar]
- Potter, M. A., Browning, P. K., & Gordovskyy, M. 2019, A&A, 623, A15 [NASA ADS] [CrossRef] [EDP Sciences] [Google Scholar]
- Priest, E., & Forbes, T. 2000, Magnetic Reconnection (Cambridge, UK: Cambridge University Press) [CrossRef] [Google Scholar]
- Rochus, P., Auchère, F., Berghmans, D., et al. 2020, A&A, 642, A8 [NASA ADS] [CrossRef] [EDP Sciences] [Google Scholar]
- Sakai, J. I. 1983, J. Plasma Phys., 30, 109 [Google Scholar]
- Sakai, J. I., & Washimi, H. 1982, ApJ, 258, 823 [Google Scholar]
- Schlüter, A. 1957, in Radio Astronomy, ed. H. C. van de Hulst, IAU Symp., 4, 356 [Google Scholar]
- Schmidt, J. M., & Cargill, P. J. 2003, J. Geophys. Res.: Space Phys., 108, 1023 [NASA ADS] [CrossRef] [Google Scholar]
- Schumacher, J., & Kliem, B. 1997, Phys. Plasma, 4, 3533 [Google Scholar]
- Sen, S., & Keppens, R. 2022, A&A, 666, A28 [NASA ADS] [CrossRef] [EDP Sciences] [Google Scholar]
- Sen, S., Jenkins, J., & Keppens, R. 2023, A&A, 678, A132 [NASA ADS] [CrossRef] [EDP Sciences] [Google Scholar]
- Shen, C., Lin, J., & Murphy, N. A. 2011, ApJ, 737, 14 [Google Scholar]
- Sukarmadji, A. R. C., Antolin, P., & McLaughlin, J. A. 2022, ApJ, 934, 190 [NASA ADS] [CrossRef] [Google Scholar]
- van Leer, B. 1974, J. Comput. Phys., 14, 361 [NASA ADS] [CrossRef] [Google Scholar]
- Wang, H., Chae, J., Yurchyshyn, V., et al. 2001, ApJ, 559, 1171 [NASA ADS] [CrossRef] [Google Scholar]
- Wyper, P. F., & DeVore, C. R. 2016, ApJ, 820, 77 [Google Scholar]
- Xia, C., Teunissen, J., El Mellah, I., Chané, E., & Keppens, R. 2018, ApJS, 234, 30 [Google Scholar]
- Yokoyama, T., & Shibata, K. 1996, PASJ, 48, 353 [Google Scholar]
- Zhou, G., Gao, G., Wang, J., et al. 2020, ApJ, 905, 150 [Google Scholar]
All Figures
|
Fig. 1. Distribution of magnetic field lines projected in the x − y plane, and spatial variations of absolute current density (|Jz|), plasma density, temperature, and thermal pressure are shown from left to right in each panel. The evolution of the above quantities for three different times t = 81.58, 120.22, and 137.39 s are shown in the top, middle, and bottom panels, respectively. The units of |Jz| are chosen arbitrarily, and the maximum saturation limit of the color bar is chosen as 2 for clarity of the enhanced current structures. An associated animation (merging_plasmoids.mp4) corresponding to this figure is available online. |
| In the text | |
|
Fig. 2. Distribution of the vertical components of the Lorentz force, pressure gradient, and gravity force along y at x = 0 for t = 81.58 s. The regions shaded in gray cover the vertical extent of the lower and upper plasmoids at x = 0. The ordinate scale is different for each curve, as shown in the figure. The horizontal dashed red line is the marker of the zero LF. |
| In the text | |
|
Fig. 3. Spatial distribution of the vertical component of the Lorentz force covering the lower (left panel) and upper (right panel) plasmoids at t = 81.58 s. |
| In the text | |
|
Fig. 4. Variation in the magnetic field components at x = 0 along the y direction at t = 120.22 (left) and 137.39 s (middle). The horizontal dashed black lines mark the zero field components. The vertical dashed black lines are located at y = 27.34 and 26 Mm (at x = 0) for the left and middle panels, respectively. The right panel shows the distribution of the vx and vz components along a horizontal axis situated at those values of y at t = 120.22 and 137.39 s, respectively. |
| In the text | |
|
Fig. 5. The magnetic field configuration during the initial 2D-like phase of the reconnection associated with the plasmoid merger (t = 120.22 s). A color map is drawn for vx; the field lines are colored according to the value of Bx. The appearance of a small nanojet-like feature is marked by a white arrow. |
| In the text | |
|
Fig. 6. Selected field lines at t = 139.53 s during the merging process of the two plasmoids, showing details of the 2D reconnection with a guide-field process between them. Left panel: Background map for vx (in km s−1). The color along the field lines corresponds to the Bz field component. Top right panel: Top view of the same configuration, but the field lines are now traced from the transverse current sheet where the merger occurs. The background map corresponds to log T. Bottom right panel: Same as the top right panel, but for a selected region highlighting the interface between the upper and lower plasmoids. |
| In the text | |
|
Fig. 7. Time-distance map of the density at a vertical (along y) cut at x = 0. The solid lines for estimating the slopes at the selected locations of the time-distance map are marked in black. The vertical extent of the upper and lower plasmoids is marked with braces and indicated by the blue arrows. The interface between the plasmoids is marked with a cyan arrow. |
| In the text | |
|
Fig. 8. Spatial distribution of the vertical Poynting flux vector Sy in the early and advanced merging stages of the plasmoids at t = 120.22 (left) and t = 137.39 s (middle), respectively. The right panel shows the vertical distribution of Sy at x = 0 at t = 120.22 and t = 137.39 s. |
| In the text | |
|
Fig. 9. Vertical distributions of the Ohmic heating rate (Hohm), expansion/contraction rate (Π), heating rate by thermal conduction (Qcon), and temperature (T) at x = 0 for the time t = 137.39 s. The horizontal dashed red and cyan lines represent the zero markers for Π and Qcon, respectively. |
| In the text | |
|
Fig. 10. Expansion/contraction rate (left) and temperature distribution (middle) in the region of the merging plasmoids at t = 137.39 s. The dashed horizontal (cyan) lines in the middle panel mark the levels y = 26, 27.5, and 28.5 Mm. Right panel: Temperature distribution along the horizontal direction for the three y-levels marked by the dashed lines in the middle panel. The minimum temperature along the y = 28.5 Mm line (red curve in the right panel) is 0.8 MK. |
| In the text | |
|
Fig. 11. Temporal variation in the fractional counts of pixels that satisfy the conditions indicated in the legend. The vertical dashed lines are marked at t = 81.58 and 137.39 s. |
| In the text | |
|
Fig. 12. TECZ regions (that satisfy the criterion |J|> Jth) for the pre-merger and advanced merging states at t = 81.58 (top row) and 137.39 s (bottom row). The timescale ratios τΠ/τcon, τohm/τΠ, and τohm/τcon are shown in the left, middle, and right columns, respectively, using logarithmic scales. |
| In the text | |
|
Fig. 13. Same as Figure 12, but showing the different characteristic timescales: τΠ (left column), τohm (middle column), and τcon (right column). (a) t = 81.58 s. (b) t = 137.39 s. |
| In the text | |
Current usage metrics show cumulative count of Article Views (full-text article views including HTML views, PDF and ePub downloads, according to the available data) and Abstracts Views on Vision4Press platform.
Data correspond to usage on the plateform after 2015. The current usage metrics is available 48-96 hours after online publication and is updated daily on week days.
Initial download of the metrics may take a while.