Fig. 2.
Download original image
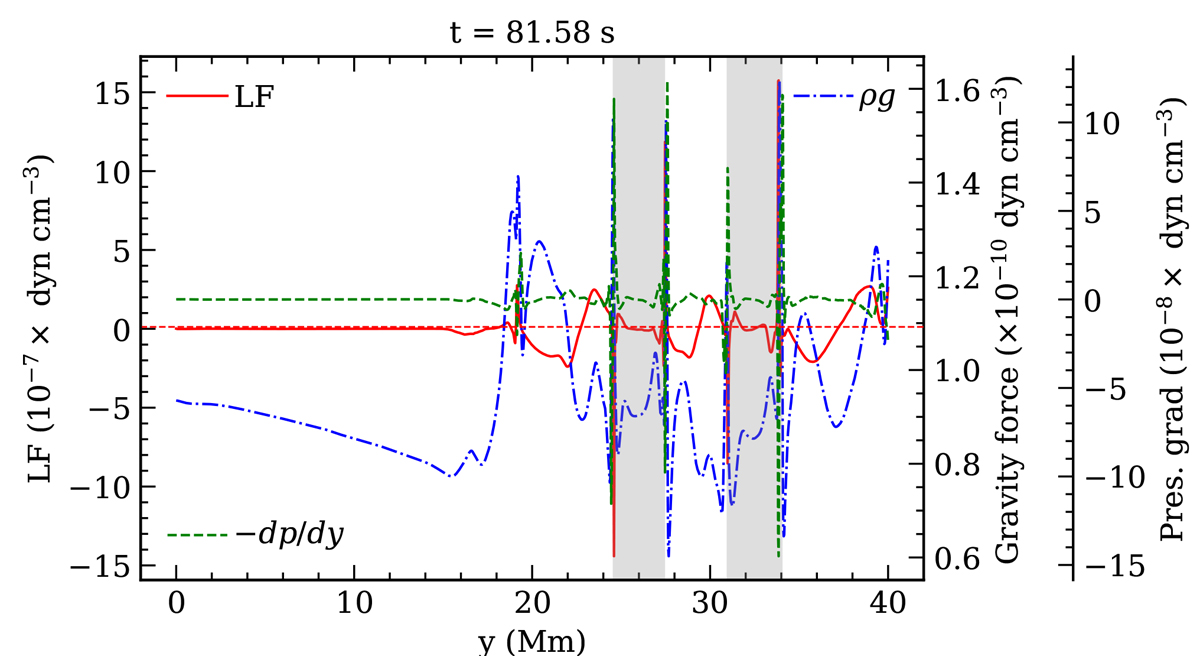
Distribution of the vertical components of the Lorentz force, pressure gradient, and gravity force along y at x = 0 for t = 81.58 s. The regions shaded in gray cover the vertical extent of the lower and upper plasmoids at x = 0. The ordinate scale is different for each curve, as shown in the figure. The horizontal dashed red line is the marker of the zero LF.
Current usage metrics show cumulative count of Article Views (full-text article views including HTML views, PDF and ePub downloads, according to the available data) and Abstracts Views on Vision4Press platform.
Data correspond to usage on the plateform after 2015. The current usage metrics is available 48-96 hours after online publication and is updated daily on week days.
Initial download of the metrics may take a while.