Fig. 7.
Download original image
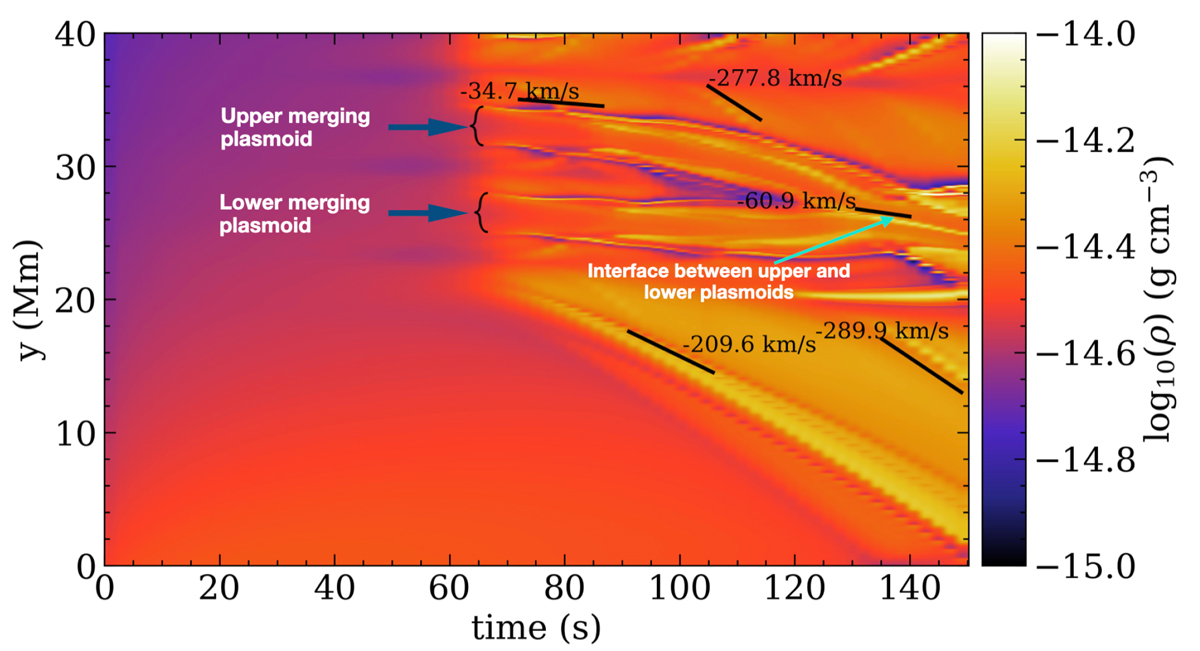
Time-distance map of the density at a vertical (along y) cut at x = 0. The solid lines for estimating the slopes at the selected locations of the time-distance map are marked in black. The vertical extent of the upper and lower plasmoids is marked with braces and indicated by the blue arrows. The interface between the plasmoids is marked with a cyan arrow.
Current usage metrics show cumulative count of Article Views (full-text article views including HTML views, PDF and ePub downloads, according to the available data) and Abstracts Views on Vision4Press platform.
Data correspond to usage on the plateform after 2015. The current usage metrics is available 48-96 hours after online publication and is updated daily on week days.
Initial download of the metrics may take a while.