Fig. 10.
Download original image
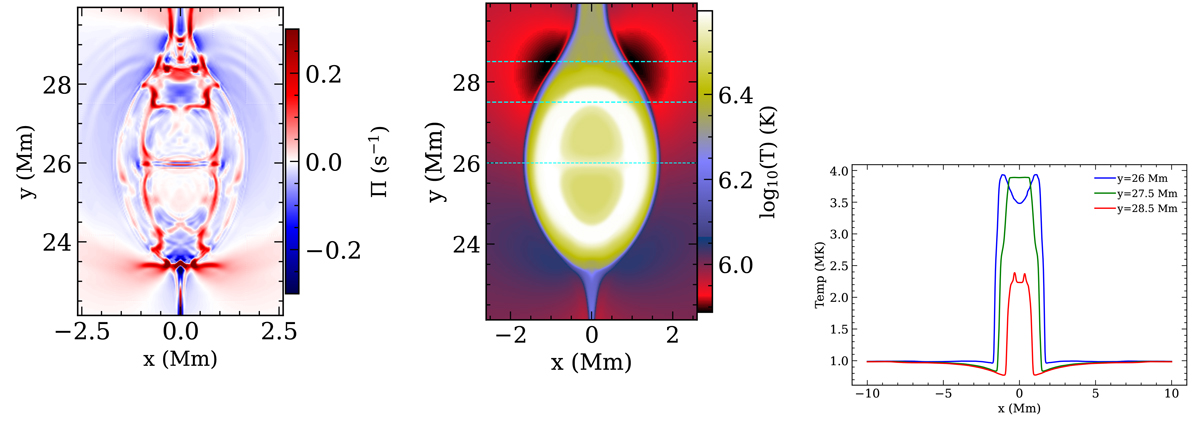
Expansion/contraction rate (left) and temperature distribution (middle) in the region of the merging plasmoids at t = 137.39 s. The dashed horizontal (cyan) lines in the middle panel mark the levels y = 26, 27.5, and 28.5 Mm. Right panel: Temperature distribution along the horizontal direction for the three y-levels marked by the dashed lines in the middle panel. The minimum temperature along the y = 28.5 Mm line (red curve in the right panel) is 0.8 MK.
Current usage metrics show cumulative count of Article Views (full-text article views including HTML views, PDF and ePub downloads, according to the available data) and Abstracts Views on Vision4Press platform.
Data correspond to usage on the plateform after 2015. The current usage metrics is available 48-96 hours after online publication and is updated daily on week days.
Initial download of the metrics may take a while.