Fig. 1.
Download original image
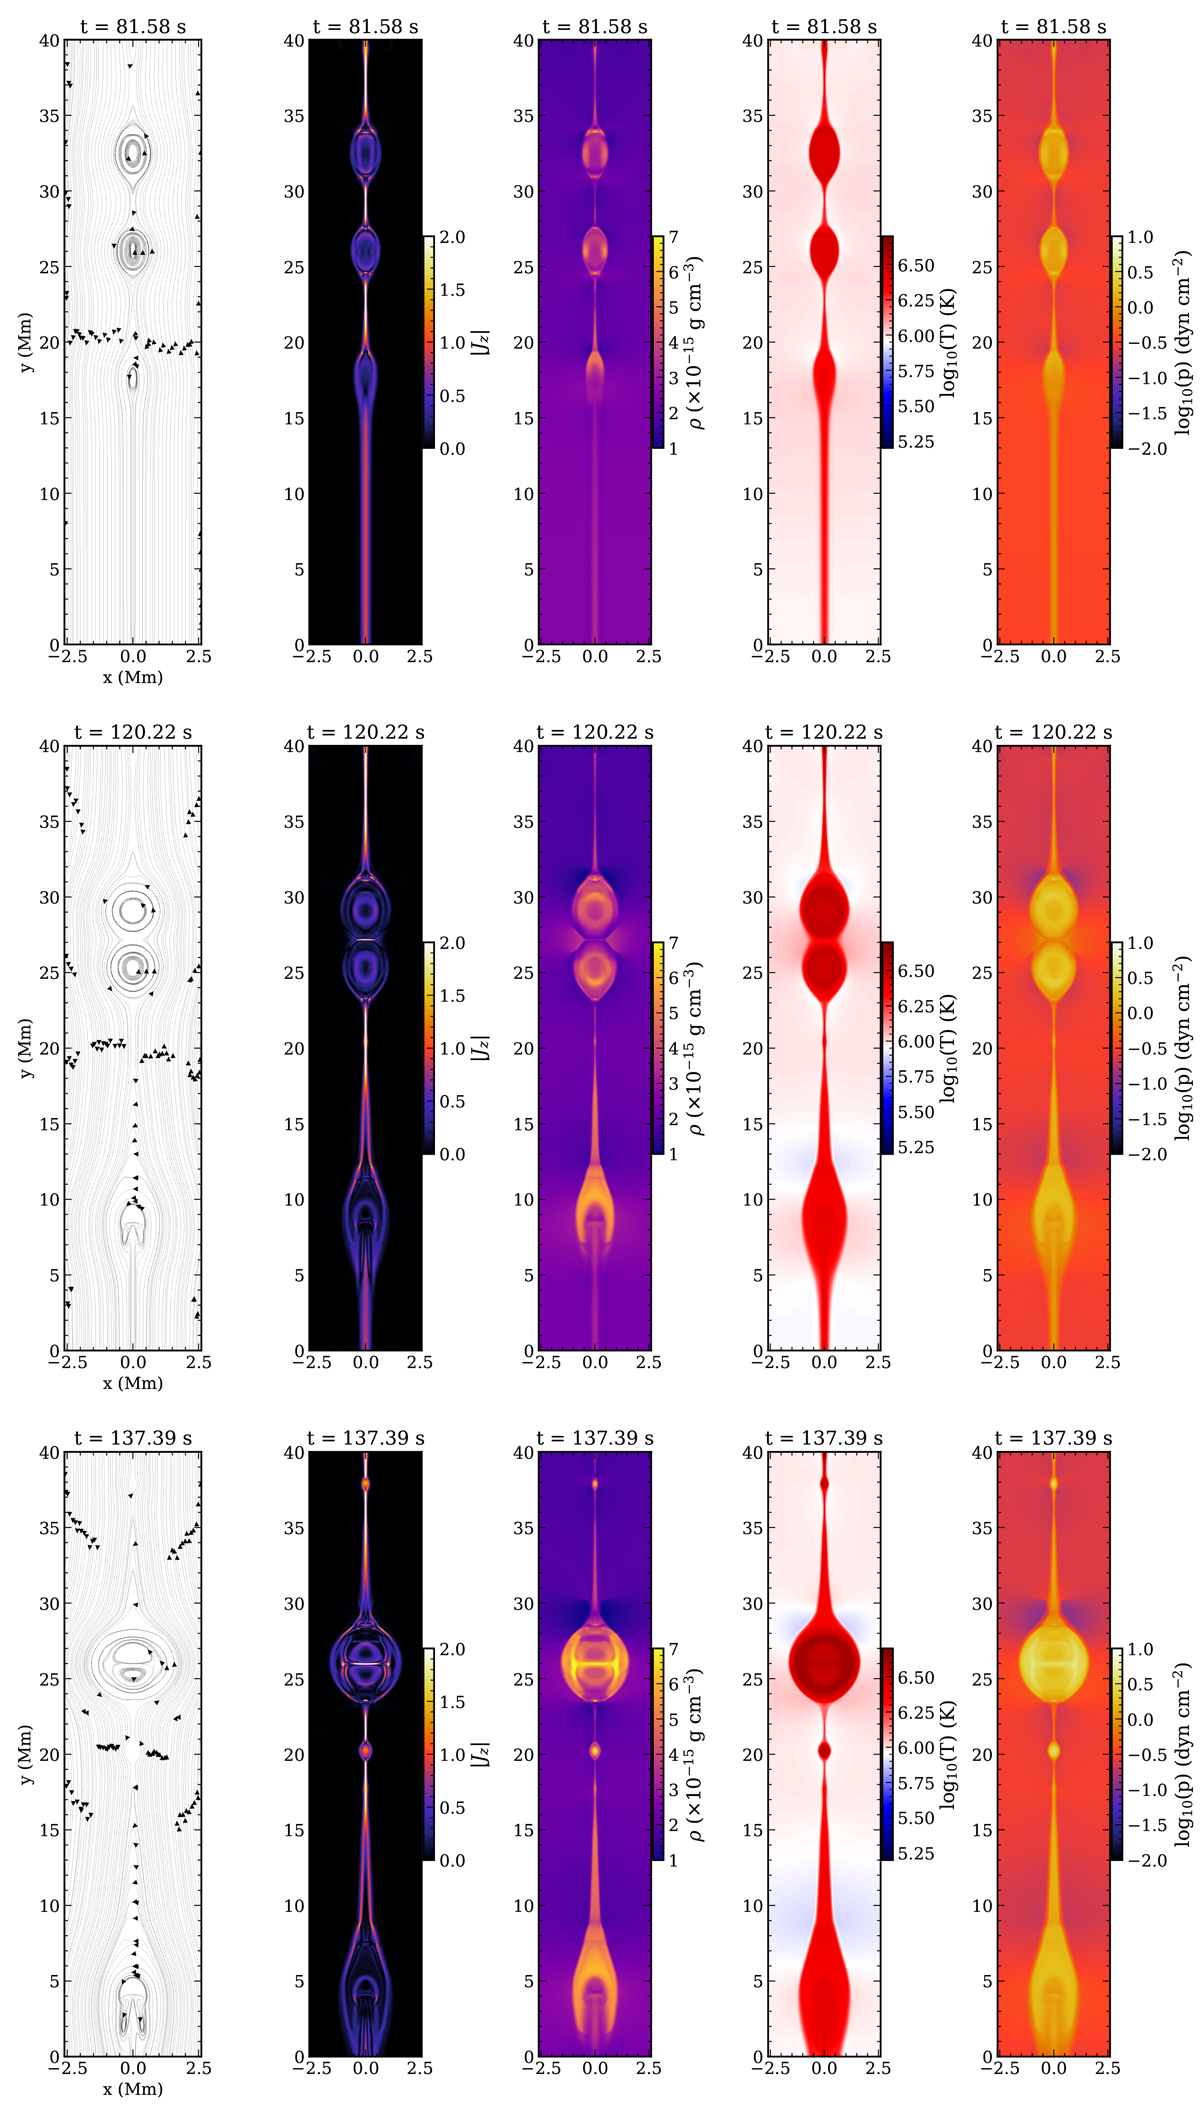
Distribution of magnetic field lines projected in the x − y plane, and spatial variations of absolute current density (|Jz|), plasma density, temperature, and thermal pressure are shown from left to right in each panel. The evolution of the above quantities for three different times t = 81.58, 120.22, and 137.39 s are shown in the top, middle, and bottom panels, respectively. The units of |Jz| are chosen arbitrarily, and the maximum saturation limit of the color bar is chosen as 2 for clarity of the enhanced current structures. An associated animation (merging_plasmoids.mp4) corresponding to this figure is available online.
Current usage metrics show cumulative count of Article Views (full-text article views including HTML views, PDF and ePub downloads, according to the available data) and Abstracts Views on Vision4Press platform.
Data correspond to usage on the plateform after 2015. The current usage metrics is available 48-96 hours after online publication and is updated daily on week days.
Initial download of the metrics may take a while.