Fig. 4.
Download original image
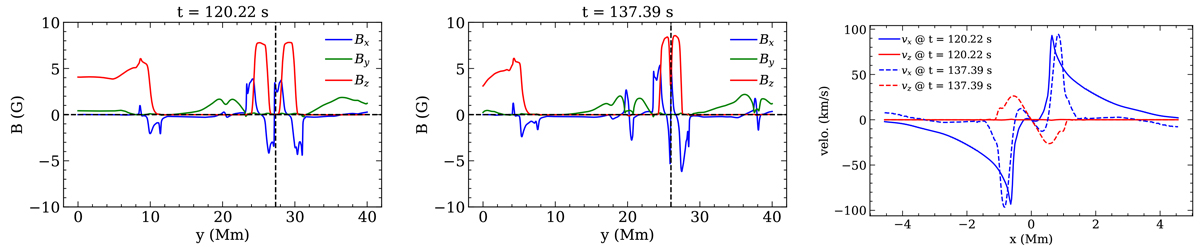
Variation in the magnetic field components at x = 0 along the y direction at t = 120.22 (left) and 137.39 s (middle). The horizontal dashed black lines mark the zero field components. The vertical dashed black lines are located at y = 27.34 and 26 Mm (at x = 0) for the left and middle panels, respectively. The right panel shows the distribution of the vx and vz components along a horizontal axis situated at those values of y at t = 120.22 and 137.39 s, respectively.
Current usage metrics show cumulative count of Article Views (full-text article views including HTML views, PDF and ePub downloads, according to the available data) and Abstracts Views on Vision4Press platform.
Data correspond to usage on the plateform after 2015. The current usage metrics is available 48-96 hours after online publication and is updated daily on week days.
Initial download of the metrics may take a while.