Open Access
Fig. 5.
Download original image
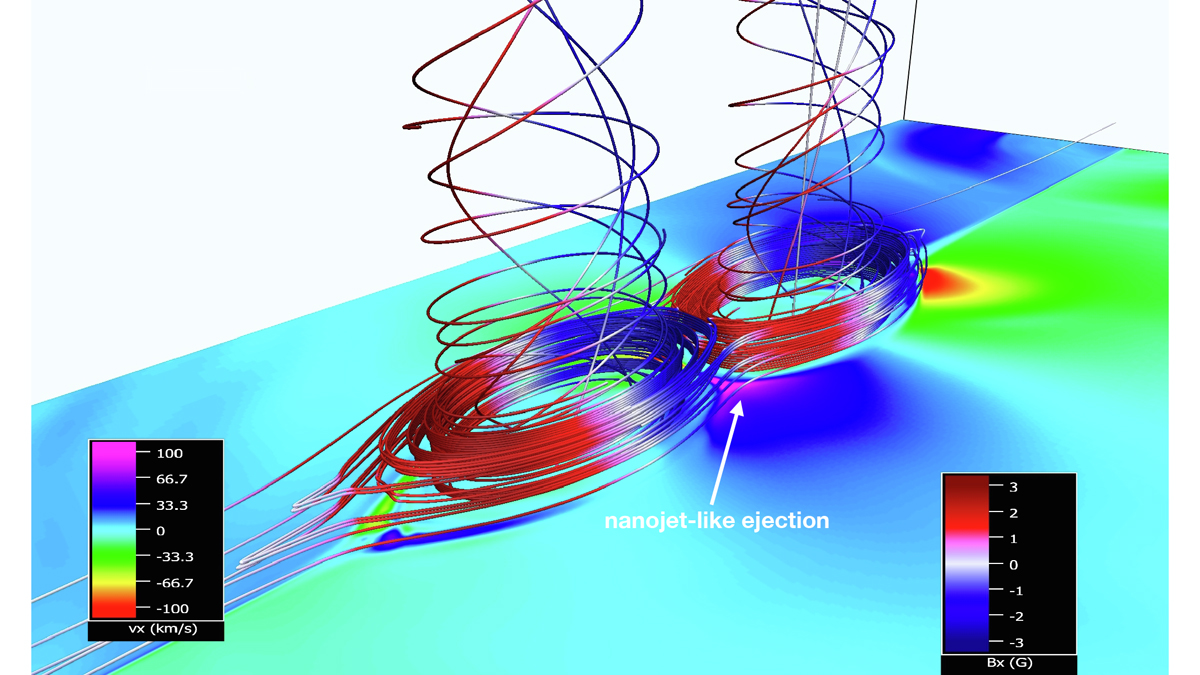
The magnetic field configuration during the initial 2D-like phase of the reconnection associated with the plasmoid merger (t = 120.22 s). A color map is drawn for vx; the field lines are colored according to the value of Bx. The appearance of a small nanojet-like feature is marked by a white arrow.
Current usage metrics show cumulative count of Article Views (full-text article views including HTML views, PDF and ePub downloads, according to the available data) and Abstracts Views on Vision4Press platform.
Data correspond to usage on the plateform after 2015. The current usage metrics is available 48-96 hours after online publication and is updated daily on week days.
Initial download of the metrics may take a while.