| Issue |
A&A
Volume 698, June 2025
|
|
|---|---|---|
| Article Number | A31 | |
| Number of page(s) | 16 | |
| Section | Planets, planetary systems, and small bodies | |
| DOI | https://doi.org/10.1051/0004-6361/202554572 | |
| Published online | 03 June 2025 | |
Retrieving day- and nightside atmospheric properties of the ultra-hot Jupiter TOI-2109b
Detection of Fe and CO emission lines and evidence for inefficient heat transport
1
Universitäts-Sternwarte, Ludwig-Maximilians-Universität München,
Scheinerstrasse 1,
81679
München,
Germany
2
Exzellenzcluster Origins,
Boltzmannstrasse 2,
85748
Garching bei München,
Germany
3
Institut für Astrophysik und Geophysik, Georg-August-Universität Göttingen,
Friedrich-Hund-Platz 1,
37077
Göttingen,
Germany
4
Department of Astronomy, University of Science and Technology of China,
Hefei
230026,
PR China
5
Instituto de Astrofísica de Andalucía (IAA-CSIC),
Glorieta de la Astronomía s/n,
18008
Granada,
Spain
6
Namzitu astro,
31130
Quint-Fonsegrives,
France
7
INAF – Osservatorio Astronomico di Padova,
Vicolo dell’Osservatorio 5,
35122
Padova,
Italy
8
Instituto de Astrofísica de Canarias (IAC),
Calle Vía Lactea s/n,
38200
La Laguna, Tenerife,
Spain
9
Departamento de Astrofísica,
Universidad de La Laguna,
38026
La Laguna,
Tenerife,
Spain
10
Centro de Astrobiología (CAB), CSIC-INTA,
Camino bajo del castillo s/n, Campus ESAC,
28692
Villanueva de la Cañada,
Madrid,
Spain
11
Thüringer Landessternwarte Tautenburg,
Sternwarte 5,
07778
Tautenburg,
Germany
12
Max-Planck-Institut für Astronomie,
Königstuhl 17,
69117
Heidelberg,
Germany
13
Department of Physics and Astronomy, Uppsala University,
Box 516,
75120
Uppsala,
Sweden
14
Landessternwarte, Zentrum für Astronomie der Universität Heidelberg,
Königstuhl 12,
69117
Heidelberg,
Germany
15
Institut de Ciències de l’Espai (CSIC-IEEC),
Campus UAB, c/ de Can Magrans s/n,
08193
Bellaterra, Barcelona,
Spain
16
Institut d’Estudis Espacials de Catalunya (IEEC),
08034
Barcelona,
Spain
17
Centro Astronómico Hispano en Andalucía,
Observatorio de Calar Alto, Sierra de los Filabres,
04550
Gérgal,
Spain
18
Center for Space and Habitability, University of Bern,
Gesellschaftsstrasse 6,
3012
Bern,
Switzerland
19
Department of Astronomy and Astrophysics, Tata Institute of Fundamental Research,
Mumbai
400005,
India
20
ARTORG Center for Biomedical Engineering Research, University of Bern,
Murtenstrasse 50,
3008
Bern,
Switzerland
21
University College London, Department of Physics & Astronomy,
Gower St,
London,
WC1E 6BT,
UK
22
Astronomy & Astrophysics Group, Department of Physics, University of Warwick,
Coventry CV4 7AL,
UK
23
Departamento de Física de la Tierra y Astrofísica and IPARCOS-UCM (Instituto de Física de Partículas y del Cosmos de la UCM),
Facultad de Ciencias Físicas, Universidad Complutense de Madrid,
28040
Madrid,
Spain
24
INAF, Osservatorio Astronomico di Palermo,
Piazza del Parlamento 1,
90134
Palermo,
Italy
25
Department of Astronomy, University of Texas at Austin,
2515
Speedway,
Austin,
TX
78712,
USA
26
Max-Planck-Institut für Sonnensystemforschung,
Justus-von-Liebig-Weg 3,
37077
Göttingen,
Germany
27
Hamburger Sternwarte,
Gojenbergsweg 112,
21029
Hamburg,
Germany
28
European Southern Observatory,
Karl-Schwarzschild-Str. 2,
85748
Garching bei München,
Germany
★ Corresponding author: This email address is being protected from spambots. You need JavaScript enabled to view it.
Received:
17
March
2025
Accepted:
17
April
2025
Abstract
The ultra-hot Jupiter (UHJ) TOI-2109b marks the lower edge of the equilibrium temperature gap between 3500 and 4500 K, an unexplored thermal regime that separates KELT-9b, the hottest planet yet discovered, from all other currently known gas giants. To study the thermochemical structure of TOI-2109b’s atmosphere, we obtained high-resolution emission spectra of both the planetary day- and nightsides with CAHA/CARMENES and VLT/CRIRES+. By applying the cross-correlation technique to the high-resolution spectra, we identified the emission signatures of Fe I (S/N = 4.3) and CO (S/N = 6.3), as well as a thermal inversion layer in the dayside atmo-sphere; no significant H2O signal was detected from the dayside. None of the analyzed species were detectable from the nightside atmosphere. We applied a Bayesian retrieval framework that combines high-resolution spectroscopy with photometric measurements to constrain the dayside atmospheric parameters and derive upper limits for the nightside hemisphere. The dayside thermal inversion extends from approximately 3200 to 4600 K, with an atmospheric metallicity consistent with that of the host star (0.36 dex). Only weak constraints could be placed on the C/O ratio, with a lower limit of 0.15. The retrieved spectral line broadening is consistent with tidally locked rotation, indicating the absence of strong dynamical processes in the atmosphere. An upper temperature limit of approximately 2400 K and a maximum atmospheric temperature gradient of about 700 K/log bar could be derived for the planetary nightside. Comparison of the retrieved dayside temperature-pressure profile with theoretical models, the absence of strong atmospheric dynamics, and significant differences in the thermal constraints between the day- and nightside hemispheres suggest a limited heat transport efficiency across the planetary atmosphere. Overall, our results place TOI-2109b in a transitional regime between the UHJs below the thermal gap, which show both CO and H2O emission lines, and KELT-9b, where molecular features are largely absent.
Key words: techniques: spectroscopic / planets and satellites: atmospheres / planets and satellites: individual: TOI-2109b
© The Authors 2025
 Open Access article, published by EDP Sciences, under the terms of the Creative Commons Attribution License (https://creativecommons.org/licenses/by/4.0), which permits unrestricted use, distribution, and reproduction in any medium, provided the original work is properly cited.
This article is published in open access under the Subscribe to Open model. This email address is being protected from spambots. You need JavaScript enabled to view it. to support open access publication.
1 Introduction
Ultra-hot Jupiters (UHJs) are gas giant exoplanets on close-in orbits around their host stars with dayside temperatures exceeding 2200 K (e.g., Parmentier et al. 2018; Kitzmann et al. 2018). Their large radii and high atmospheric temperatures result in extended scale heights and strong thermal fluxes, making them ideal targets for atmospheric characterization via transmission and emission spectroscopy. The extreme thermal conditions of UHJs lead to dayside atmospheres dominated by atomic and ionic species (e.g., Bell & Cowan 2018; Arcangeli et al. 2018). Only a few molecular species with strong chemical bonds, such as CO, can survive in significant concentrations under these extreme conditions (e.g., Parmentier et al. 2018; Kreidberg et al. 2018). Observations have identified Fe I and CO as dominant contributors to UHJ spectra at visible and near-infrared wave-lengths, respectively (e.g., Pino et al. 2020; Kasper et al. 2021; Yan et al. 2022a; Ramkumar et al. 2023; Lesjak et al. 2025). Another key characteristic of UHJs is the presence of thermal inversions in their dayside atmospheres, driven by strong absorption of stellar irradiation at visible and ultraviolet wavelengths in the upper atmospheric layers (e.g., Hubeny et al. 2003; Fortney et al. 2008; Lothringer et al. 2018; Arcangeli et al. 2018; Fossati et al. 2021, 2023).
Ultra-hot Jupiters typically exhibit synchronous rotation caused by tidal circularization during the early evolutionary stages of these planetary systems (Hut 1981). Therefore, UHJs have permanent day- and nightsides with significant differences in their thermal properties. The thermal contrast between the two planetary hemispheres depends on the atmospheric heat redis-tribution efficiency (Cowan & Agol 2011) controlled by global gas flows, which can be classified into two dominant dynamical regimes: day-to nightside winds and super-rotating jet streams, both capable of reaching speeds of several km s−1 (e.g., Miller-Ricci Kempton & Rauscher 2012; Showman et al. 2013; Tan & Komacek 2019; Seidel et al. 2025). With increasing temperature, UHJs experience a decreasing heat transport across the atmosphere as frictional drag from the coupling between the partially ionized atmosphere and the planetary magnetic field, as well as radiative cooling, can efficiently dampen largescale atmospheric gas flows (e.g., Komacek & Showman 2016; Schwartz et al. 2017; Arcangeli et al. 2018). The heat transport efficiency reaches a minimum at a dayside-redistribution equilibrium temperature1 of Teq ∼ 3000 K, beyond which the atmospheric heat redistribution becomes more effective again (e.g., Fortney et al. 2021; Wong et al. 2021). This is caused by the dissociation of molecular hydrogen into atomic hydrogen at Teq > 3000 K, which is transported to the nightside by atmospheric winds, where it recombines and releases significant amounts of energy (e.g., Bell & Cowan 2018; Komacek & Tan 2018; Tan & Komacek 2019; Roth et al. 2021).
So far, high-resolution spectroscopy has allowed the successful characterization of the atmospheric conditions in the daysides and at the terminators of UHJs (e.g., Yan & Henning 2018; Pino et al. 2020; Kasper et al. 2021; Prinoth et al. 2022; Bello-Arufe et al. 2022; Zhang et al. 2022; Brogi et al. 2023; Johnson et al. 2023; Pelletier et al. 2023; Borsato et al. 2023; Hoeijmakers et al. 2024; Ramkumar et al. 2025). However, high-resolution spectroscopy studies focusing on the physical and chemical conditions in the nightside atmospheres of exoplanets remain limited. In the literature, only tentative evidence for nightside emission has been reported for two exoplanets, the hot Jupiter HD 179949b (Matthews et al. 2024) and the UHJ WASP-33b (Yang et al. 2024; Mraz et al. 2024), with the latter showing conflicting results between the two existing studies. In contrast, space-based photometric and low-resolution spectroscopy measurements have successfully detected the thermal flux and placed constraints on the brightness temperature values for exoplanet nightside atmospheres (e.g., Keating et al. 2019; Morello et al. 2019, 2023). The difficulty of making similar detections with ground-based high-resolution spectroscopy likely stems from the absence of strong line features in the emission signature of UHJ nightsides, as the technique is only sensitive to spectral lines but insensitive to broadband features in the spectra. In fact, theoretical models predict a significant flattening of the temperature-pressure (T -p) profiles towards the upper atmospheres of UHJ nightsides (e.g., Molaverdikhani et al. 2020; Wardenier et al. 2025), which is expected to result in emission spectra without strong line features.
The present study provides the first in-depth spectroscopic characterization of the UHJ TOI-2109b. We report detections of the spectral signatures of Fe I and CO from the planet’s dayside atmosphere, and the nondetection of line features in its nightside emission spectrum. In addition, we provide constraints on TOI-2109b’s atmospheric parameters derived by a Bayesian retrieval framework. The planet was discovered via TESS photometry on a close orbit around a F-type star (Wong et al. 2021) and confirmed through radial velocity (RV) measurements. With an extremely short orbital period of Porb ∼ 0.67 d, an elevated dayside brightness temperature of Tday ∼ 3630 K, a particularly high planetary mass of Mp ∼ 5.0 MJup and density of ρp ∼ 2.5 g cm−3, TOI-2109b represents a departure from the parameters typical of most UHJs. Beyond the discovery paper by Wong et al. (2021), the literature on TOI-2109b remains limited to CHEOPS photometric observations by Harre et al. (2024), which provide tentative evidence for orbital decay and suggest the possible presence of a nearby outer companion. TOI-2109b lies close to the lower boundary of an unexplored thermal regime in the range 3500 K < Teq < 4500 K, which separates the hottest planet yet discovered – KELT-9b (Gaudi et al. 2017) – from the currently known UHJs. While measurable abundances of a few molecular species have been found to persist in UHJ atmospheres with temperatures below this gap (e.g., Yan et al. 2023; Cont et al. 2024; Pelletier et al. 2025), no features of molecular lines have been detected at high spectral resolution in the atmosphere of KELT-9b as of March 20252. This suggests that the temperature range between 3500 and 4500 K could mark a transition in the thermochemical properties of UHJ atmospheres. As the first UHJ identified in this intermediate temperature range, TOI-2109b provides an important opportunity to investigate the connection between distinct thermochemical regimes. All parameters of the TOI-2109 system used in this work are summarized in the Table 1.
This paper is structured as follows. Sections 2 and 3 describe the observations and data reduction procedures. The methodology for identifying the spectral emission lines from TOI-2109b’s atmosphere, along with the resulting detections and nondetections, is presented in Sect. 4. Our retrieval framework and the derived atmospheric parameters are presented and discussed in Sect. 5. Finally, conclusions about our work are given in Sect. 6.
Parameters of the TOI-2109 (BD+16 3058) system.
2 Observations
We observed the thermal emission signal of TOI-2109b over five visits at high spectral resolution using CARMENES (Quirrenbach et al. 2018) and CRIRES+ (Dorn et al. 2023). CARMENES is located at the 3.5-meter Calar Alto Telescope and consists of two fiber-fed high-resolution spectrograph channels that cover the wavelength ranges 520–960 nm in the visible (VIS) and 960–1710 nm in the near-infrared (NIR) domain. The instrument operates at a spectral resolution of R ∼ 94 600 in the VIS channel and R ∼ 80 400 in the NIR channel, with 61 and 28 echelle orders, respectively. The CRIRES+ instrument is a high-resolution slit spectrograph installed at the 8-meter Unit Telescope 3 of the Very Large Telescope. A total of 29 spectral settings provide full coverage of the wavelength interval 950–5380 nm. At the slit width of 0.2′′ chosen for our observations, and under the assumption of homogeneous slit illumination, CRIRES+ achieves a nominal resolving power of R ∼ 100 000. For our observations, we selected the setting K2166, which provides wavelength coverage from 1921 to 2472 nm. This setting consists of seven echelle orders, each divided by two narrow gaps between the detectors, resulting in a total of 21 segments. Throughout this paper, for simplicity, we use the term “wavelength segment” to refer to both the spectral orders of CARMENES and the detector segments of CRIRES+.
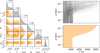
The acquired data cover the entire planetary orbit except for three small intervals during the primary and secondary eclipses and near the quadrature point at orbital phase 0.25. Therefore, our observations target the emission signals from both the day- and nightside hemispheres. Three spectral time series were taken at orbital phases when the dayside of the planet is mostly aligned with the observer’s line of sight (CARMENES: pre- and post-eclipse; CRIRES+: post-eclipse); another two CRIRES+ observations were taken at orbital phases when the nightside of TOI-2109b is mostly facing the observer. The exposure time per spectral frame was 200 and 120 s for CARMENES and CRIRES+, respectively. An overview of the orbital phases covered is provided in Fig. 1 and further details of the observations are summarized in Table 2.
All observations were taken under good meteorological conditions, except for the CRIRES+ night of 2024 May 26. The data from this night are affected by strong variability in the seeing conditions, which caused repeated failures of the adaptive optics (AO) system. We applied the data reduction and cross-correlation procedures described in Sects. 3 and 4 to this dataset. However, precise removal of the telluric contamination was prevented by strong temporal flux variations in the spectral time series caused by the repeated opening and closing of the AO loop. The residual telluric contamination resulted in the presence of artifacts in the cross-correlation analysis. We therefore concluded that the quality of this particular dataset was not suitable for drawing meaningful conclusions about the atmospheric conditions of TOI-2109b and excluded it from further analyses.
We used the reduction pipelines caracal v2.20 (Zechmeister et al. 2014; Caballero et al. 2016) and cr2res 1.4.4 to extract the order-by-order one-dimensional spectra and corresponding uncertainties from the raw frames3. Both pipelines perform dark and flat field corrections, bad pixel removal, and provide a wavelength solution. The CRIRES+ spectra were acquired using an ABBA nodding pattern, which consists of observing the target at two different slit positions (A and B), allowing the removal of sky background and detector artifacts during data extraction. We treated the A and B spectra as independent datasets throughout the data reduction steps in Sect. 3, and combined their information in Sects. 4 and 5.
For the CRIRES+ observations, a precise wavelength solution is obtained only under the condition of a homogeneously illuminated spectrograph slit, which is not generally valid. Therefore, we performed a wavelength refinement step by applying molecfit (Smette et al. 2015) to the time-averaged telluric absorption lines at the nodding positions A and B individually. A further correction of the wavelength solution for the individual exposures was not required, as time-dependent wavelength drifts determined by cross-correlation between the telluric lines were sufficiently small (<0.15 pixels). In addition, for the CRIRES+ data (except for the excluded night of 2024 May 26), the performance of the AO system was very good, resulting in a point spread function (PSF) smaller than the slit and thus a spectral resolution exceeding the nominal value of the spectrograph. We derived the specific spectral resolution of each observation from the width of the PSF. For a more detailed description of the wavelength correction procedures and the determination of the spectral resolution, we refer the reader to Cont et al. (2024).
Observation log.
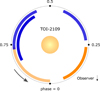 |
Fig. 1 Orbital phase coverage of TOI-2109b observations. CARMENES observations are shown as hatched lines, while CRIRES+ observations are shown as solid lines. Observations where the planet’s day- and nightside are mostly aligned with the observer’s line of sight are represented in blue and orange, respectively. The CRIRES+ observation excluded due to poor data quality is shown in light orange. |
3 Data reduction
3.1 Pre-processing the spectra
Each observational dataset was pre-processed separately. For each wavelength segment, the extracted one-dimensional spectra were arranged chronologically in a two-dimensional array to form a spectral matrix. Variability in atmospheric conditions during the observations caused differences in the continuum level of the individual spectra. To correct for these differences, we normalized each individual spectrum to a common continuum using polynomial fitting (see Cont et al. 2024). We removed outliers in our data using Principal Component Analysis. With this approach, we modeled the spectral matrix (i.e., the two-dimensional array of flux as a function of wavelength and orbital phase), subtracted the model from the data, and identified pixels deviating by more than 5σ in the resulting residuals. These pixels were then removed from the spectral matrix. Additionally, we masked wavelength regions with deep telluric lines, where the flux dropped below 50% of the spectral continuum level.
3.2 Removal of telluric and stellar lines
Analyzing the planetary spectral signature requires the removal of telluric and stellar line contributions from our observations. To this end, we applied SYSREM to the pre-processed spectral matrix of each observation (Tamuz et al. 2005). Originally developed to identify and remove systematic effects in sets of stellar light curves, this algorithm has proven to be a powerful tool in the study of exoplanet atmospheres (e.g., Birkby et al. 2013, 2017). When applied to high-resolution spectral time series, each wavelength bin of the spectral matrix is treated as an independent light curve. SYSREM iteratively derives a linear model in wavelength and time of the systematic contributions to the spectral matrix. These modeled systematics are subtracted from the data, yielding the so-called residual spectral matrix. We refer the reader to Czesla et al. (2024) for a detailed mathematical description of SYSREM in the context of exoplanet science.
The spectral matrix provided as input to the algorithm consists of the following main components: the stellar and telluric lines, the planetary spectral signature, and spectral noise. The positions of stellar and telluric features in wavelength space are stable over the duration of an observation and are therefore treated as systematic effects by SYSREM. Consequently, these components are efficiently modeled and removed from the spectral time series. In contrast, the spectral lines of the planet, which are buried in the noise, exhibit a continuously changing Doppler-shift caused by its orbital motion and are therefore largely unaffected by SYSREM.
We followed the procedure described by Gibson et al. (2022), which involves dividing the spectral matrix by the median spectrum before subtracting the systematics modeled by SYSREM. This approach preserves the relative strengths of the planetary spectral lines and allows us to account for distortions introduced by the algorithm when applying a Bayesian retrieval framework in Sect. 5. SYSREM was run for up to ten consecutive iterations, producing a residual spectral matrix for each iteration and wavelength segment. An overview of the data reduction process, including the use of SYSREM, is provided in Fig. 2.
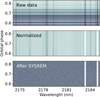 |
Fig. 2 Example of data reduction steps for a selected CRIRES+ wave-length range. Top panel: unprocessed spectra as extracted from the instrument pipeline. Middle panel: spectral matrix after continuum nor-malization and outlier correction; deep telluric lines are masked. Bottom panel: residual spectral matrix after telluric and stellar line removal with SYSREM. |
4 Detection of the planetary emission lines
We applied the cross-correlation method (e.g., Snellen et al. 2010; Brogi et al. 2012; Birkby et al. 2013) to extract the faint spectral emission lines of TOI-2109b from the noise-dominated residual spectra. This method maps the information contained in the ensemble of planetary spectral lines onto a detectable signal peak by calculating the cross-correlation function (CCF) between an exoplanet model spectrum and the residual spectra. Typically, the spectral lines of the two chemical species Fe I and CO dominate the emission signals from the dayside atmospheres of UHJs. The Fe I lines are expected to be most prominent in the CARMENES wavelength range, while the CO lines are expected to be restricted to the CRIRES+ wavelengths. Therefore, we search for Fe I and CO in the CARMENES and CRIRES+ day-side datasets, respectively (orbital phase coverage indicated in blue in Fig. 1). Although the elevated dayside temperature of TOI-2109b suggests significant dissociation of H2O, we also check for the corresponding emission lines, since this species, if present, can significantly affect the atmospheric metallicity and the carbon-to-oxygen (C/O) ratio in the retrieval described in Sect. 5. On the other hand, significant concentrations of CO and H2O are expected in the cooler nightside atmospheres of UHJs. Consequently, we search for CO and H2O in the nightside data of TOI-2109b (orbital phase coverage indicated in orange in Fig. 1). For consistency with our dayside analysis, we also included Fe I in our nightside investigations.
4.1 Model spectra
We modeled a planetary atmosphere consisting of 81 layers logarithmically spaced in pressure, ranging from 10−8 bar to 1 bar. The T -p profile was parameterized with a low-pressure point (T1, p1) and a high-pressure point (T2, p2). An isothermal atmosphere was assumed at pressures below p1 or higher than p2. Between the two isothermal layers, a linear temperature pattern as a function of log p was adopted. The thermal conditions in TOI-2109b’s atmosphere have not yet been studied in detail. Therefore, we used measurements of the atmospheric thermal conditions of the UHJs KELT-9b and WASP-33b to approximate the T -p profile of TOI-2109b, which has an equilibrium temperature between those of the two planets. For our analysis of the planetary dayside, we employed a T -p profile that lies between those determined by Kasper et al. (2021) and Cont et al. (2022a) for KELT-9b and WASP-33b, respectively. This T -p profile corresponds to a thermal inversion and is defined by the pressure points (T1, p1) = (5000 K, 10−5 bar) and (T2, p2) = (3500 K, 1 bar). To study the nightside atmosphere of TOI-2109b, we used a non-inverted T -p profile similar to that retrieved by Mraz et al. (2024) for WASP-33b at orbital phases near the transit. The two-point parametrization of this profile is given by (T1, p1) = (3000 K, 10−2.5 bar) and (T2, p2) = (4000 K, 1 bar). For both T -p profiles used, the mean molecular weight and volume mixing ratios (VMRs) for the studied species were calculated with FastChem (Stock et al. 2022)4, assuming equilibrium chemistry and solar elemental abundances. In addition, we computed a T -p-wavelength grid of the opacities for each chemical species to compute the corresponding planetary model spectrum. The opacities for Fe I were obtained from the Kurucz line list (Kurucz 2018), the CO line information was taken from Li et al. (2015), and H2O data were taken from the POKAZATEL line list (Polyansky et al. 2018). Eventually, the radiative transfer code petitRADTRANS (Mollière et al. 2019) was used to generate the model spectra of the different chemical species.
Since the pre-processed spectra are continuum normalized, normalization of the model spectra was also required. This step consisted of first calculating the planet-to-star flux ratio by dividing the model spectra by the blackbody spectrum of the host star, followed by normalization to the planetary continuum. As a last step, we convolved each model spectrum with the instrument profiles, resulting in the final spectra for cross-correlation. The normalized spectra for studying the day- and nightsides of TOI-2109b are shown in Figs. 3 and 4, respectively.
4.2 Cross-correlation method
We applied the cross-correlation technique using the model spectra of the individual chemical species, as well as the species-combined model spectra. To this end, each model spectrum was shifted to a grid of Doppler-velocities between –800 and +800 km s−1 with an increment of 1 km s−1 and interpolated to the wavelength solution of the data. For each velocity of the grid, the individual residual spectra were multiplied by the shifted model spectrum and weighted by the uncertainties, resulting in a so-called weighted CCF per exposure frame. For the residual spectrum number i of the spectral time series, the CCF is thus defined as
![Mathematical equation: \[{\rm{CC}}{{\rm{F}}_i}(v) = \mathop \sum \limits_j \frac{{{R_{ij}}{m_j}(v)}}{{{\sigma _{ij}}^2}},\]](/articles/aa/full_html/2025/06/aa54572-25/aa54572-25-eq3.png) (1)
where Ri j is the residual spectral matrix, σi j are the uncertainties of the matrix, and mj is the spectral model Doppler-shifted by the velocity v. For each observational dataset and wavelength segment, the CCFs of the spectral time series were arranged in a two-dimensional array. The arrays of the different wave-length segments were then co-added, resulting in a CCF map for each dataset. Eventually, the CCF maps from different datasets were combined into a final CCF map. This was done by first merging the CCF maps of the individual datasets along the time axis and then sorting the rows of the resulting matrix according to the orbital phase. No weighting between different datasets was applied. This procedure allowed us to perform a combined analysis of the CARMENES datasets, as well as to merge the information from the A and B nodding positions of the CRIRES+ data, which were treated independently throughout the data reduction procedures in Sect. 3.
(1)
where Ri j is the residual spectral matrix, σi j are the uncertainties of the matrix, and mj is the spectral model Doppler-shifted by the velocity v. For each observational dataset and wavelength segment, the CCFs of the spectral time series were arranged in a two-dimensional array. The arrays of the different wave-length segments were then co-added, resulting in a CCF map for each dataset. Eventually, the CCF maps from different datasets were combined into a final CCF map. This was done by first merging the CCF maps of the individual datasets along the time axis and then sorting the rows of the resulting matrix according to the orbital phase. No weighting between different datasets was applied. This procedure allowed us to perform a combined analysis of the CARMENES datasets, as well as to merge the information from the A and B nodding positions of the CRIRES+ data, which were treated independently throughout the data reduction procedures in Sect. 3.
The CCF map was aligned to the rest frame of TOI-2109b over a range of orbital semi-amplitude velocity (Kp) values. We assumed a circular orbit of the planet, with a RV described by
![Mathematical equation: \[{v_{\rm{p}}}(t) = {v_{{\rm{sys\;}}}} + {v_{{\rm{bary\;}}}}(t) + {K_{\rm{p}}}\sin 2\pi \phi (t),\]](/articles/aa/full_html/2025/06/aa54572-25/aa54572-25-eq4.png) (2)
where vsys is the velocity of the TOI-2109 system, vbary (t) is the barycentric velocity correction, and ϕ (t) is the orbital phase. For each alignment, the CCF map was collapsed into a one-dimensional CCF by averaging over all orbital phases. The one-dimensional CCFs resulting from these alignments were further arranged into a two-dimensional array. Following Cont et al. (2024), we then fit the distribution of all CCF values with a Gaussian function, divided the array by the resulting standard deviation, and obtained a signal-to-noise detection map (S/N map) as a function of the free parameters Kp and vsys. If the investigated spectral signature of the planet is present in the data, the S/N map will show a significant detection peak near the expected Kp and vsys values.
(2)
where vsys is the velocity of the TOI-2109 system, vbary (t) is the barycentric velocity correction, and ϕ (t) is the orbital phase. For each alignment, the CCF map was collapsed into a one-dimensional CCF by averaging over all orbital phases. The one-dimensional CCFs resulting from these alignments were further arranged into a two-dimensional array. Following Cont et al. (2024), we then fit the distribution of all CCF values with a Gaussian function, divided the array by the resulting standard deviation, and obtained a signal-to-noise detection map (S/N map) as a function of the free parameters Kp and vsys. If the investigated spectral signature of the planet is present in the data, the S/N map will show a significant detection peak near the expected Kp and vsys values.
4.3 Number of SYSREM iterations
The number of SYSREM iterations applied to clean our data from telluric and stellar contamination can significantly affect the morphology of the S/N map, as well as the conclusions drawn by retrieval frameworks. Insufficient iterations result in incomplete correction of telluric and stellar residuals, biasing both the S/N map and the retrieved atmospheric parameters. On the other hand, using an excessive number of SYSREM iterations has the potential to not only remove telluric and stellar lines, but also to partially remove the planetary spectral signature. To objectively determine the optimal number of SYSREM iterations, we used the method proposed by Cheverall et al. (2023), which is summarized as follows: first, a planetary model spectrum is Doppler-shifted using the expected Kp and vsys values. The shifted spectral model is injected into the raw data, pre-processed, and cross-correlated with the unshifted planetary model spectrum. This procedure yields the injected cross-correlation function CCFinj. Subsequently, the differential cross-correlation function between the data with and without the injected spectral model ΔCCF = CCFinj − CCF is computed and converted into a S/N map for each iteration. The iteration corresponding to the highest significance in the S/N map is chosen as the optimal number of SYSREM iterations.
To derive the optimal SYSREM iteration number, we used the species-combined model spectra shown in the bottom left panels of Figs. 3 and 4. The recovered injected signal is maximized at iteration number six for CARMENES; three and seven consecutive iterations maximize the injected signal in the day- and nightside data of CRIRES+, respectively.
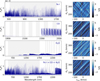 |
Fig. 3 Spectral models (left panels) and S/N maps (right panels) of the chemical species investigated in the dayside atmosphere of TOI-2109b. The three top panels show the information for the individual chemical species Fe I, CO, and H2O, the bottom panels show the information for all species combined. We note that the species-combined signal is dominated by the CO detection with CRIRES+. The Fe I spectral signature mainly stems from CARMENES, the CO signal from the CRIRES+ data; the investigated H2O emission lines fall in the wavelength ranges of both instruments. The H2O model spectrum shows particularly weak emission lines due to the predominant thermal dissociation of the species at the elevated temperatures of the TOI-2109b atmosphere. The wavelengths covered by CARMENES and the CRIRES+ K2166 setting used in this work are indicated by the gray shaded area. The expected position of the planetary signal in the S/N maps is indicated by the yellow dashed lines. We show the S/N maps corresponding to the optimal SYSREM iteration number as determined in Sect. 4.3. |
4.4 Cross-correlation results
4.4.1 Detection of the dayside signal
We detect spectral emission lines from the dayside atmosphere of TOI-2109b. In Fig. 1, the orbital phase coverage of the day-side datasets is shown in blue color. Figure 3 presents the S/N maps resulting from the cross-correlation of our data with the Fe I, CO, H2O, and species-combined model spectra. The dashed lines indicate the expected location of the planetary signal in these maps. The expected Kp value is derived from the parameters in Wong et al. (2021), while the value of vsys is taken from the Gaia catalog (Gaia Collaboration 2018, 2023).
We find tentative evidence for Fe I emission lines consistent with the planetary rest frame in the CARMENES wavelength range. The signal is clearly visible at all SYSREM iterations, reaching its maximum strength at a S/N of 4.3 after one iteration. In addition, we identify a clear S/N detection peak of atmospheric CO close to the predicted values of Kp and vsys in the CRIRES+ data. The signal is visible at all SYSREM iterations greater than one, with the strongest detection at S/N = 6.3 after two consecutive iterations of the algorithm. No H2O signal is detected at any SYSREM iteration. Cross-correlation with a model spectrum containing spectral lines from all three chemical species and combining data from both instruments gives a maximum detection at S/N = 6.6 after two iterations of SYSREM. Comparison of this detection strength with that of the individual species shows that the spectral signature of CO, whose lines are restricted to the CRIRES+ wavelength range, clearly dominates the species-combined signal. This is a reasonable result considering the significantly higher photon collecting power of the 8-meter mirror at the Very Large Telescope available to CRIRES+ compared to the 3.5-meter mirror at Calar Alto Observatory used by CARMENES. The evolution of the signal strengths as a function of SYSREM iterations is shown in Fig. 5. The detection of spectral lines in emission unambiguously proves the presence of an atmospheric temperature inversion on the dayside of TOI-2109b, which is in agreement with theoretical work on the temperature structure of UHJ atmospheres (e.g., Hubeny et al. 2003; Fortney et al. 2008). In addition to the CARMENES data, we cross-correlated our Fe I model spectrum with the CRIRES+ dayside dataset. However, this resulted in a nondetection, likely due to the limited number and low intensity of Fe I spectral emission lines in the wavelength range of the selected CRIRES+ setting.
While most high-resolution studies have shown a strong increase in detection significance between the first run of SYSREM and subsequent iterations, the Fe I signal shows a stable pattern that includes the first iteration. This behavior can be attributed to two factors. First, the planetary Fe I lines are predominantly located at the blue end of the CARMENES wavelength range, where the telluric contamination is minimal. Second, the normalization of the spectral time series with the median spectrum prior to the SYSREM application in Sect. 3.2 already provides a preliminary removal of telluric and stellar lines. As a result, telluric and stellar contamination, and consequently SYSREM, have a limited effect on the Fe I signal.
In addition to Fe I, previous studies with CARMENES have detected several other chemical species in the atmospheres of UHJs, including Ti I, V I, Si I, OH, and TiO (e.g., Landman et al. 2021; Cont et al. 2021, 2022a,b; Ridden-Harper et al. 2023; Guo et al. 2024). Therefore, we also checked for these species in the CARMENES data of TOI-2109b, but found no significant detections. The nondetections are not surprising, since these species typically produce weaker signals than Fe I, whose S/N is relatively low in our analysis. Thus, even if these species are present in TOI-2109b’s atmosphere, their signals are unlikely to overcome the noise in our data. For Ti- and V-bearing species, depletion mechanisms such as gravitational settling or cold trapping on the nightside may provide an additional explanation for their nondetection (e.g., Spiegel et al. 2009; Parmentier et al. 2013).
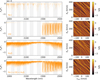 |
Fig. 4 Same as Fig. 3 but for the nightside atmosphere of TOI-2109b. The investigated species result in nondetections. The nightside hemisphere was observed exclusively with CRIRES+. |
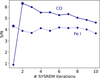 |
Fig. 5 S/N values of Fe I and CO as a function of SYSREM iterations. Iterations with the most significant S/N peaks are indicated by the star symbol. |
4.4.2 Nondetection of the nightside signal
No significant emission signal is detected in the CRIRES+ data taken when the nightside atmosphere of TOI-2109b is facing the observer. The nightside observations correspond to the orbital phases indicated in orange color in Fig. 1. The S/N maps of the nondetections obtained from cross-correlation with the Fe I, CO, H2O, and the species-combined model spectra are reported in Fig. 4. Our nondetections are most likely due to an approximately isothermal nightside T -p profile in the pressure range probed by high-resolution spectroscopy, rather than the absence of the investigated species. In general, an isothermal structure results in a featureless blackbody spectrum of the planetary atmosphere, which prevents the detection of a cross-correlation signal. In a broader context, our nondetections are not surprising, given that only a small number of tentative nightside signals have been found for other gas giant exoplanets at high spectral resolution (i.e., HD 179949b, WASP-33b; Matthews et al. 2024; Yang et al. 2024; Mraz et al. 2024).
Previous work by Wong et al. (2021) suggests that, depending on the thermal conditions, the nightside hemisphere of TOI-2109b may exhibit detectable emission features of CO and H2O. Their study focused on spectral signals accessible with low-resolution space-based spectroscopy, which is primarily sensitive to pressure levels near the planetary photosphere. In addition to the atmospheric layers at lower pressures, high-resolution ground-based spectroscopy can also probe the pressure range near the photosphere and is therefore potentially sensitive to these spectral features. Our nondetection of molecular signals suggests that TOI-2109b has nightside thermal conditions resulting in an emission signal without strong spectral features. According to Fig. 16 of Wong et al. (2021), this may be the case for nightside temperatures below 2500 K, which is consistent with the temperature constraints obtained from our nightside retrieval in Sect. 5.2.2.
5 Retrieval of the atmospheric properties
5.1 Retrieval framework
The retrieval of TOI-2109b’s atmospheric properties employs a framework closely resembling that used by Cont et al. (2024) for characterizing the atmosphere of WASP-178b. Our implementation relies on the petitRADTRANS radiative transfer code (Mollière et al. 2019) to forward model the planetary emission spectrum. The atmosphere was modeled with 25 layers, uniformly distributed on a logarithmic pressure scale from 10−8 bar to 1 bar. We included the opacities of the chemical species studied in Sect. 4.4, i.e., Fe I, CO, and H2O. In addition, the presence of H− was considered for both hemispheres, as this species is a critical continuum opacity source that can mute emission features in the spectra of UHJs (e.g., Arcangeli et al. 2018; Lothringer et al. 2018). The thermal and chemical structure of the planetary atmosphere was parametrized by a two-point T -p profile with the high-pressure point p2 defined as log p2 = log p1 + dp and dp restricted to positive values, and by the atmospheric metallicity ([M/H]) and C/O ratio. Following Lesjak et al. (2025), we assumed that most atmospheric metals vary with the overall metallicity and hence [M/H] = [Fe/H] = [O/H], while the carbon abundance is determined by the C/O ratio and oxygen abundance. Using these parameters, the VMRs of the different chemical species were calculated with the FastChem code (Stock et al. 2022). We incorporated the effect of rotational broadening into the calculation of the spectral model, which is parameterized by the planet’s equatorial rotation velocity veq (Díaz et al. 2011). The resulting model spectrum was converted to the planet-to-star flux ratio and convolved with the instrumental profile as described in Sect. 4.1. For each individual spectrum of our high-resolution time series, we used Kp and vsys to Doppler-shift the spectral model to the planetary rest frame and interpolated to the wavelength solution of the observational data. The short orbital period of TOI-2109b causes its RV to change significantly during a single spectral exposure, smearing the observed spectral signal over multiple detector pixels. We accounted for this effect by convolving each Doppler-shifted model spectrum in velocity space with a box-function kernel corresponding to the RV change during each individual exposure. These procedures resulted in a two-dimensional representation of the model spectrum with the same shape as the residual spectral matrix. We adopted the filtering method described by Gibson et al. (2022) to account for the presence of potential distortion effects introduced into our data by SYSREM.
High-resolution spectroscopy lacks the information from the spectral continuum level that is lost during the telluric and stellar line correction with SYSREM. Therefore, only the relative strengths of the spectral lines with respect to the local continuum are measured. On the other hand, photometric and low-resolution spectroscopy observations can measure absolute flux levels that encode the spectral continuum information. In addition to our high-resolution spectroscopy datasets, photometric measurements of TOI-2109b are available in the literature. Wong et al. (2021) measured the secondary eclipse depth of TOI-2109b using space- and ground-based photometry with TESS and the Palomar/WIRC instrument, obtaining eclipse depth values of 731±46 ppm and 2012±80 ppm, respectively. From the nightside, they obtained a photometric flux of 9±43 ppm in the TESS passband. To incorporate this information into our retrieval framework, we modeled the photometric data points with petitRADTRANS. As the TESS bandpass covers a substantial fraction of the visible wavelength range, which can encompass emission features of a variety of atomic metals, their oxides, and hydrides, we included the opacities of Fe, Ti, Na, K, Ca, Mg, TiO, VO, FeH, CrH, and CaH into our photometric modeling. In addition, we included the CO and H2O opacities, which are expected to have the most dominant effect on the WIRC K band photometry. The contribution from the continuum opacity source H− was also taken into account. We applied the same thermal and chemical parametrization as for the high-resolution spectroscopy data. The resulting emission flux was integrated over the bandpass of each instrument. Since the integration of the model spectrum occurs over relatively wide bandpasses, the petitRADTRANS low-resolution mode was used to speed up the radiative transfer calculations. The opacities used in the low-resolution mode are available in the petitRADTRANS opacity database5.
Our approach follows that of Yan et al. (2022b), assuming that the dayside flux observed in photometry results solely from thermal emission, with no contribution from reflected stellar light. This approximation is motivated by the extremely high temperatures of TOI-2109b’s dayside atmosphere, which prevent the formation of reflective clouds or hazes (e.g., Lothringer et al. 2018; Kitzmann et al. 2018). The assumption is also supported by measurements of the reflection properties of other close-in gas giant exoplanets, which indicate very low albedo values (e.g., Bell et al. 2017; Shporer et al. 2019).
Following the pioneering works of Brogi & Line (2019) and Gibson et al. (2020), a standard Gaussian log likelihood function was used to compare the model spectra to the observations. For the high-resolution spectroscopy data this function is defined as
![Mathematical equation: \[\ln {\cal L} = - \frac{1}{2}\mathop \sum \limits_{i,j} \left[ {\frac{{{{({R_{ij}} - {M_{ij}})}^2}}}{{{{(\beta {\sigma _{ij}})}^2}}} + \ln 2\pi {{(\beta {\sigma _{ij}})}^2}} \right],\]](/articles/aa/full_html/2025/06/aa54572-25/aa54572-25-eq5.png) (3)
where Ri j and Mi j are the individual elements of the residual spectral matrix and the filtered spectral forward model, respectively. The uncertainties of the residual spectra are denoted by σi j; β acts as a scaling factor to correct for possible over- or underestimation of the uncertainties. For each high-resolution spectroscopy dataset, the log likelihood functions resulting from the individual wavelength segments were coadded. This yielded a total of five log likelihood functions for the analysis of the planetary dayside (two CARMENES VIS, two CARMENES NIR, and one CRIRES+ dataset) and one function for the analysis of the planetary nightside (one CRIRES+ dataset). The residual spectra used were those corresponding to the optimal number of SYSREM iterations computed in Sect. 4.3.
(3)
where Ri j and Mi j are the individual elements of the residual spectral matrix and the filtered spectral forward model, respectively. The uncertainties of the residual spectra are denoted by σi j; β acts as a scaling factor to correct for possible over- or underestimation of the uncertainties. For each high-resolution spectroscopy dataset, the log likelihood functions resulting from the individual wavelength segments were coadded. This yielded a total of five log likelihood functions for the analysis of the planetary dayside (two CARMENES VIS, two CARMENES NIR, and one CRIRES+ dataset) and one function for the analysis of the planetary nightside (one CRIRES+ dataset). The residual spectra used were those corresponding to the optimal number of SYSREM iterations computed in Sect. 4.3.
The Gaussian log likelihood function for the photometric data points was defined as
![Mathematical equation: \[\ln {{\cal L}_{{\rm{ph}}}} = - \frac{1}{2}\left[ {\frac{{{{({R_{{\rm{ph}}}} - {\delta _{{\rm{ph}}}})}^2}}}{{\sigma _{{\rm{ph}}}^2}} + \ln 2\pi \sigma _{{\rm{ph}}}^2} \right].\]](/articles/aa/full_html/2025/06/aa54572-25/aa54572-25-eq6.png) (4)
(4)
In this expression, Rph is the photometric flux, δph is the modeled flux, and σph is the measurement uncertainty. We computed the log likelihood functions for both the TESS and Palomar/WIRC data points.
Eventually, the log likelihood functions were combined into a final log likelihood function for the planetary dayside and a separate final log likelihood function for the planetary nightside. This combination was achieved by coadding the log likelihood functions of the high-resolution spectroscopy and photometric measurements separately for the day- and nightside. To obtain the posterior parameter estimates, we explored the resulting posterior probability distribution, which is proportional to the likelihood for uniform priors, by Markov Chain Monte Carlo (MCMC) sampling using the emcee software package (Foreman-Mackey et al. 2013). In summary, our high-resolution retrieval framework includes the following parameters: the temperature profile parameters T1, T2, p1, dp; the chemical properties represented by [M/H] and the C/O ratio; the equatorial rotation velocity veq; the velocity parameters Kp and vsys; the noise scaling parameters of the high-resolution spectrographs βCV, βCN, βC+ (the instruments have independent noise scaling factors, where CV, CN, and C+ denote CARMENES VIS, CARMENES NIR, and CRIRES+, respectively). For each free parameter, 32 walkers with 30 000 steps each were used in the MCMC sampling process.
5.2 Retrieval results and discussion
5.2.1 Dayside retrieval
Our retrieval is able to constrain physical and chemical properties in the dayside atmosphere of TOI-2109b. The corner plot in Fig. A.1 shows the posterior distributions along with the correlations of the atmospheric parameters. A summary of the best-fit retrieval parameters is provided in Table 3.
The retrieved T -p profile is shown in Fig. 6, confirming the presence of the thermal inversion layer detected in Sect. 4.2. This finding is consistent with theoretical predictions (e.g., Hubeny et al. 2003; Fortney et al. 2008; Arcangeli et al. 2018) and is in line with previous observational studies of UHJs (e.g., Nugroho et al. 2017; Cont et al. 2022b; Yan et al. 2022a; Lesjak et al. 2025). The thermal inversion spans a temperature range between approximately 3200 and 4600 K in the lower and upper planetary atmosphere, respectively. Our retrieval provides narrower constraints on the thermal conditions at high pressure levels compared to low pressure levels. The smaller uncertainties at higher pressures result from the inclusion of photometric data points, which predominantly probe the layers at low atmospheric altitudes. Therefore, the measured temperature of these atmospheric layers is expected to be close to the value of 3631 ± 69 K determined by Wong et al. (2021) exclusively from TESS and Palomar/WIRC photometric measurements. We note that the temperature derived by our retrieval is slightly lower, with a discrepancy of approximately 100 K between the confidence intervals of their measurement and that of our work. We attribute this offset to differences in the modeling approaches used: while Wong et al. (2021) assume a blackbody emission spectrum to determine TOI-2109b’s dayside temperature, our analysis includes the additional contribution of line emission, which requires a lower temperature to obtain the same band-integrated flux. On the other hand, the larger uncertainties of the T -p point describing the high-altitude atmospheric layers are caused by the predominant ionization and dissociation of the studied chemical species in the low-pressure regime.
To compare with the T -p profile obtained from our retrieval, we calculated the thermal structure of TOI-2109b’s dayside atmosphere using the HELIOS6 radiative-convective equilibrium code (Malik et al. 2017, 2019). We followed the procedures described by Fossati et al. (2021) with the only difference that we include cross sections of all molecules available in the DACE7 database. The atomic line opacities also included C I-II, O I-II, Na I-II, Mg I-II, Si I-II, K I-II, Ca I-II, Ti I-II, Cr I-II, and Fe I-II, which we pre-tabulated using the HELIOS-K8 package (Grimm & Heng 2015) and the original Kurucz9 line list (Kurucz 2018). Since HELIOS does not include photochemistry, we assumed equilibrium abundances which we obtained with the FastChem code (Stock et al. 2022).
Our HELIOS calculations considered two extreme scenarios: no heat redistribution and full heat redistribution from the dayside to the nightside atmosphere of the planet. The T -p curve from our retrieval lies between the two HELIOS models, which is a reasonable result since the expected heat redistribution should fall between the two extremes. We also note that the gradient of the retrieved T -p curve and that from the theoretical models are in agreement over the full pressure range of the thermal inversion layer. Figure 6 shows that the HELIOS model without heat redistribution is slightly closer to our T -p measurement than the full redistribution scenario, suggesting that TOI-2109b’s atmosphere may have a limited heat redistribution efficiency. However, further observations to refine the constraints on the dayside temperature profile are needed to allow a conclusive characterization of the planetary heat redistribution properties.
We derived an atmospheric metallicity of ![Mathematical equation: \[\left[ {{\rm{M}}/{\rm{H}}} \right] = 0.36_{ - 1.17}^{ + 1.42}{\rm{dex}}\]](/articles/aa/full_html/2025/06/aa54572-25/aa54572-25-eq16.png) , which is consistent with the host star value of
, which is consistent with the host star value of ![Mathematical equation: \[ - 0.07_{ - 0.06}^{ + 0.07}{\rm{dex}}\]](/articles/aa/full_html/2025/06/aa54572-25/aa54572-25-eq17.png) dex (Wong et al. 2021). The atmospheric C/O ratio is only weakly constrained by our retrieval, excluding values below approximately 0.15. However, between the lower limit of 0.15 and a value of about 0.9, the posterior density estimate shows a maximum consistent with solar values. We attribute the relatively broad [M/H] interval and the inability of our retrieval to robustly constrain the C/O ratio to a degeneracy between the two parameters, as well as to degeneracies with the T -p profile. The degeneracies can be identified as diagonal patterns in the correlation plots shown in Fig. A.1. In principle, stronger detections of Fe I and CO would be able to mitigate these degeneracies. However, our signals of these species appear to be insufficient for this purpose. This is in line with previous studies that were able to constrain [M/H] and the C/O ratio with significantly stronger detections than those achieved in our work (e.g., Line et al. 2021).
dex (Wong et al. 2021). The atmospheric C/O ratio is only weakly constrained by our retrieval, excluding values below approximately 0.15. However, between the lower limit of 0.15 and a value of about 0.9, the posterior density estimate shows a maximum consistent with solar values. We attribute the relatively broad [M/H] interval and the inability of our retrieval to robustly constrain the C/O ratio to a degeneracy between the two parameters, as well as to degeneracies with the T -p profile. The degeneracies can be identified as diagonal patterns in the correlation plots shown in Fig. A.1. In principle, stronger detections of Fe I and CO would be able to mitigate these degeneracies. However, our signals of these species appear to be insufficient for this purpose. This is in line with previous studies that were able to constrain [M/H] and the C/O ratio with significantly stronger detections than those achieved in our work (e.g., Line et al. 2021).
The VMRs of Fe I, CO, and H2O derived from the T -p and chemical retrieval parameters are shown in Fig. 6. Despite the relatively weak constraints on [M/H] and the C/O ratio, our retrieval yields VMRs in the lower atmosphere of approximately 10−4 for Fe I and 10−3 for CO, with uncertainties of ± 1.5 dex. Towards higher atmospheric altitudes the VMRs decrease significantly and the uncertainties increase. This effect can be attributed to increasing ionization and dissociation of Fe I and CO, and suggests that our observations are mainly sensitive to the atmospheric layers at higher pressures. Significant VMRs of H2O are obtained only at the highest pressures studied, which are typically probed exclusively by photometric measurements. The rapid decrease in H2O abundances toward lower pressures is consistent with our nondetection of H2O with high-resolution spectroscopy in Sect. 4.
Our retrieval yields relatively tight confidence intervals for the planetary velocity parameters encoded in the Doppler-shift of the spectral lines. The orbital and systemic velocity parameters are derived as ![Mathematical equation: \[{K_{\rm{p}}} = 262.95_{ - 5.72}^{ + 6.65}\;{\rm{km}}\;{{\rm{s}}^{ - 1}}\]](/articles/aa/full_html/2025/06/aa54572-25/aa54572-25-eq18.png) km s−1 and
km s−1 and ![Mathematical equation: \[{v_{{\rm{sys\;}}}} = - 18.64_{ - 4.98}^{ + 5.86}\;{\rm{km}}\;{{\rm{s}}^{ - 1}}\]](/articles/aa/full_html/2025/06/aa54572-25/aa54572-25-eq19.png) km s−1, respectively. The retrieved Kp is consistent with the value predicted from the orbital period and adopted stellar mass. However, direct comparison of our vsys measurement with literature values is difficult due to inconsistencies between previous systemic velocity measurements. For instance, Wong et al. (2021) report −25.64 ± 0.11 km s−1 and −25.61 ± 0.21 km s−1 with the TRES and FIES spectrographs, respectively, which differ from Gaia measurements of −19.72 ± 3.46 km s−1 and −22.28 ± 1.23 km s−1 (Gaia Collaboration 2018, 2023). Consequently, we treat the vsys value derived in our work as an independent measurement of the TOI-2109 systemic velocity.
km s−1, respectively. The retrieved Kp is consistent with the value predicted from the orbital period and adopted stellar mass. However, direct comparison of our vsys measurement with literature values is difficult due to inconsistencies between previous systemic velocity measurements. For instance, Wong et al. (2021) report −25.64 ± 0.11 km s−1 and −25.61 ± 0.21 km s−1 with the TRES and FIES spectrographs, respectively, which differ from Gaia measurements of −19.72 ± 3.46 km s−1 and −22.28 ± 1.23 km s−1 (Gaia Collaboration 2018, 2023). Consequently, we treat the vsys value derived in our work as an independent measurement of the TOI-2109 systemic velocity.
We observe significant spectral line broadening, which, assuming it is caused by planetary rotation, allows us to derive an effective rotational velocity of ![Mathematical equation: \[{v_{{\rm{eq\;}}}} = 12.07_{ - 5.78}^{ + 5.75}\;{\rm{km}}\;{{\rm{s}}^{ - 1}}\]](/articles/aa/full_html/2025/06/aa54572-25/aa54572-25-eq20.png) . This 10 km s value is consistent with the velocity of ∼ −5.78 −1 that is derived under the assumption that the rotation of TOI-2109b is tidally locked. The absence of a significant velocity excess in the retrieved veq value suggests the lack of strong atmospheric dynamics, as phenomena such as super-rotating winds or turbulent flow would produce additional line broadening beyond what is expected from planetary rotation. This finding is in line with the picture of inefficient atmospheric heat redistribution suggested by the retrieved T -p profile. We caution, however, that drawing firm conclusions about the impact of atmospheric dynamics on TOI-2109b’s heat redistribution efficiency is difficult given the relatively large uncertainties in veq, and that further interpretation would require additional observations.
. This 10 km s value is consistent with the velocity of ∼ −5.78 −1 that is derived under the assumption that the rotation of TOI-2109b is tidally locked. The absence of a significant velocity excess in the retrieved veq value suggests the lack of strong atmospheric dynamics, as phenomena such as super-rotating winds or turbulent flow would produce additional line broadening beyond what is expected from planetary rotation. This finding is in line with the picture of inefficient atmospheric heat redistribution suggested by the retrieved T -p profile. We caution, however, that drawing firm conclusions about the impact of atmospheric dynamics on TOI-2109b’s heat redistribution efficiency is difficult given the relatively large uncertainties in veq, and that further interpretation would require additional observations.
The noise scaling terms βCV and βCN are close to one, indicating a proper estimate of the CARMENES uncertainties. The CRIRES+ data show a slight underestimation of the uncertainties, resulting in a noise scaling term βC+ greater than one. This discrepancy, which was not observed in previous studies with the CRIRES+ instrument (e.g., Cont et al. 2024; Lesjak et al. 2025), can be attributed to changes in the noise estimation routine between versions of the cr2res extraction pipeline10. Pipeline versions prior to cr2res 1.4.0 used a more conservative approach based on residual noise, while later versions used Poisson noise, resulting in a more optimistic estimation of the uncertainties.
In the context of the broader UHJ population, our results suggest that the atmospheric thermochemical regime of TOI-2109b represents a transition between the properties of UHJs below the thermal gap and those of the extreme object KELT-9b. The presence of significant CO abundances contrasts with the chemical properties of KELT-9b, for which no CO molecular features have been detected in the planetary dayside. On the other hand, the chemistry of TOI-2109b’s dayside atmosphere also differs from that of the UHJs with temperatures cooler than 3500 K. This is because H2O, which has been detected in the emission spectra of several UHJs – including WASP-33b (Teq ∼ 3250 K; Nugroho et al. 2021; Finnerty et al. 2023), the third hottest known UHJ – is largely absent from the dayside of TOI-2109b. Finally, the evidence for inefficient day-night heat transport suggests that TOI-2109b has heat redistribution properties more similar to those of UHJs with temperatures below the thermal gap than to those of KELT-9b.
Results of atmospheric retrievals on TOI-2109b.
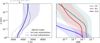 |
Fig. 6 Atmospheric temperature and abundance profiles. The left panel shows a comparison between the median T -p profile from the retrieval (solid line) and the T -p profiles from the self-consistent HELIOS model. The HELIOS temperature curves represent the two limiting cases of no and full day-to nightside heat redistribution. The uncertainty interval of the retrieved T -p curve is represented by the blue shaded area. Our T -p measurement is slightly closer to the no heat redistribution scenario than to the full heat redistribution scenario. For comparison, we also include the dayside temperature measurement from Wong et al. (2021), shown as the gray data point. This measurement is expected to reflect the thermal conditions at low atmospheric altitudes, and is therefore in line with the retrieved T -p profile. Since Wong et al. (2021) do not provide a specific pressure value, we show this data point outside the T -p space. The right panel shows the abundances (solid lines) of the chemical species studied by cross-correlation and the corresponding uncertainties (shaded areas). Both Fe I and CO abundances drop significantly at pressures below ∼10−3 bar, indicating that our data are most sensitive to atmospheric layers at or above this pressure level. |
5.2.2 Nightside retrieval
In the retrieval analysis targeting the nightside atmosphere of TOI-2109b, we set the chemical, velocity, and broadening parameters to fixed values due to their poor constraints when left as free parameters. The chemical parameters [M/H] and C/O ratio were set to solar values, consistent with the results obtained for the planetary dayside. The Kp and vsys values were fixed to those listed in Table 1, and the spectral lines were broadened according
to a tidally locked planetary rotation with veq = 10 km s−1. This setup allowed us to focus on investigating the T -p profile of the planetary nightside atmosphere.
The posterior distributions and correlations between the atmospheric parameters are illustrated in the corner plot in Fig. A.2, showing that only upper limits on the nightside temperatures can be retrieved. The upper limits of the nightside T -p profile over the entire pressure range studied are shown in Fig. 7. At pressures greater than 10−4 bar, the atmospheric temperature is restricted to values below approximately 2400 K. This result is consistent with the maximum nightside temperature of 2500 K previously derived by Wong et al. (2021) from TESS photometric measurements. On the other hand, the atmospheric temperature at pressures below 10−4 bar in TOI-2109b’s nightside remains largely unconstrained. This suggests a limited ability of our retrieval to distinguish between different T -p profile scenarios in this pressure range, presumably due to the absence of a sufficiently strong spectral signal. In fact, both an isothermal T -p profile and a T -p profile exhibiting thermal inversion, where temperatures at low pressures reach values high enough to cause ionization and dissociation of the species studied, produce signals with no spectral lines, which would be consistent with our nondetection. In principle, our retrieval is expected to be sensitive only to T -p profiles with decreasing temperatures towards the upper layers of the atmosphere. This is because the limited impact of ionization and dissociation on the studied chemical species allows for the formation of significant spectral lines in this scenario. However, we are unable to constrain such a T -p profile, and therefore rule out the existence of a strong thermal gradient towards lower temperatures in the upper atmosphere of TOI-2109b.
To place upper limits on the thermal gradient below which the atmospheric signal cannot be retrieved in the present data, we analyzed the posterior distribution of temperature gradients, defined as
![Mathematical equation: \[{T_{{\rm{slope\;}}}} = \frac{{{T_1} - {T_2}}}{{\log {p_1} - \log {p_2}}},\]](/articles/aa/full_html/2025/06/aa54572-25/aa54572-25-eq21.png) (5)
using only those MCMC samples corresponding to a T -p profile decreasing with altitude. The probability distribution in Fig. 7 peaks at low Tslope values, with an extended tail towards higher values. This tail corresponds to thermal profiles with rapid temperature decreases over a narrow pressure range, resulting in isothermal profiles over almost the entire pressure range. The tail is a consequence of our two-point T -p parametrization, which also allows for sharp temperature changes, which are likely unphysical. As a result, the 84th percentile confidence interval at 695 K/log bar provides a reliable upper limit of the T -p gradient in TOI-2109b’s atmosphere, while we consider the 95th percentile interval commonly used for this purpose to be biased by the tail of the distribution.
(5)
using only those MCMC samples corresponding to a T -p profile decreasing with altitude. The probability distribution in Fig. 7 peaks at low Tslope values, with an extended tail towards higher values. This tail corresponds to thermal profiles with rapid temperature decreases over a narrow pressure range, resulting in isothermal profiles over almost the entire pressure range. The tail is a consequence of our two-point T -p parametrization, which also allows for sharp temperature changes, which are likely unphysical. As a result, the 84th percentile confidence interval at 695 K/log bar provides a reliable upper limit of the T -p gradient in TOI-2109b’s atmosphere, while we consider the 95th percentile interval commonly used for this purpose to be biased by the tail of the distribution.
We note that an alternative explanation for the weak constraints on the nightside thermal structure of TOI-2109b is that the T -p profile may be more complex than a purely inverted, non-inverted, or isothermal pattern. Such a profile could produce spectral features that combine both emission and absorption components (for an example, see Fig. 2 of Schwarz et al. 2015). In this scenario, our two-point T -p parameterization, which only allows for a single temperature gradient, would be insufficient to accurately describe the thermal structure, thereby limiting the ability of the retrieval to constrain the atmospheric conditions. The use of more flexible T -p parameterizations in future studies may allow a more effective characterization of exoplanet nightside conditions (e.g. Pelletier et al. 2021; Gandhi et al. 2023).
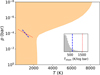 |
Fig. 7 Upper temperature limits in the nightside hemisphere of TOI-2109b and posterior distribution of the atmospheric temperature gradient. The orange shaded area represents the 95th percentile confidence interval of the temperatures as a function of atmospheric pressure. The inset panel shows the posterior distribution of the T -p gradient for thermal profiles with decreasing temperatures towards lower pressures. The 84th and 95th percentile confidence intervals at 695 K/log bar and 1535 K/log bar are indicated by the blue dashed and red dotted lines, respectively. These gradients represent upper limits below which the atmospheric signal cannot be retrieved in the present data. The gradients are shown as blue dashed and red dotted lines in T -p space. |
6 Conclusions
We have characterized the atmospheric properties of the UHJ TOI-2109b using high-resolution spectroscopy with CARMENES and CRIRES+ at visible and near-infrared wave-lengths. Applying the cross-correlation technique and a Bayesian retrieval framework incorporating broadband photometric data, we were able to derive the following key results:
We identified emission lines of Fe I and CO in the dayside spectrum of TOI-2109b. The detected Doppler-shifts of the spectral lines are consistent with the planet’s orbital motion. Emission lines of H2O remain undetected, most likely due to thermal dissociation of this species at the extreme temperatures of the planetary dayside (Sect. 4.4.1);
Our finding of Fe I and CO spectral lines in emission proves the presence of a thermal inversion layer in the dayside atmosphere, which is consistent with the expectations from theoretical work on UHJs (Sect. 4.4.1). A joint retrieval with secondary eclipse depth measurements from TESS and Palomar/WIRC allowed us to obtain tight constraints on the T -p profile. Weaker constraints on the metallicity and C/O ratio are found due to a degeneracy between the two parameters; the retrieved values are consistent with solar abundances (Sect. 5.2.1);
Comparison of the retrieved T -p profile with self-consistent models suggests an inefficient day-to nightside heat transport in TOI-2109b’s atmosphere. This finding is supported by a broadening of the spectral emission lines consistent with a tidally locked rotation, indicating the absence of strong day-to nightside wind flows (Sect. 5.2.1);
Finally, no significant emission signal was detected in the nightside observations of TOI-2109b (Sect. 4.4.2). A retrieval combining CRIRES+ high-resolution spectroscopy and TESS photometry provides only upper limits on the gradient of the T -p profile and temperature in the nightside atmosphere (Sect. 5.2.2).
The present study provides the first in-depth atmospheric characterization of TOI-2109b, a UHJ located at the lower end of the unexplored thermal regime between 3500 and 4500 K. This gap separates the well studied sample of UHJs with lower temperatures from the extreme case of KELT-9b, the hottest exoplanet orbiting a main sequence star known to date. Overall, our findings of prominent CO spectral emission, absence of H2O features, and evidence for low day-night heat transport suggest that the chemical and thermal properties of TOI-2109b correspond to a transition between the properties of the UHJs below the thermal gap and KELT-9b. Future observations of TOI-2109b will help to further connect the unique physical and chemical properties of the extreme object KELT-9b to the population of gas giants at lower temperatures.
Acknowledgements
CRIRES+ is an ESO upgrade project carried out by Thüringer Landessternwarte Tautenburg, Georg-August Universität Göttingen, and Uppsala University. The project is funded by the Federal Ministry of Education and Research (Germany) through Grants 05A11MG3, 05A14MG4, 05A17MG2 and the Knut and Alice Wallenberg Foundation. This project is based on observations collected at the European Organisation for Astronomical Research in the Southern Hemisphere under the ESO programmes 113.26GE.001 and 113.26GE.002. CARMENES is an instrument at the Centro Astronómico Hispano en Andalucía (CAHA) at Calar Alto (Almería, Spain), operated jointly by the Junta de Andalucía and the Instituto de Astrofísica de Andalucía (CSIC). CARMENES was funded by the Max-Planck-Gesellschaft (MPG), the Consejo Superior de Investigaciones Científicas (CSIC), the Min-isterio de Economía y Competitividad (MINECO) and the European Regional Development Fund (ERDF) through projects FICTS-2011-02, ICTS-2017-07-CAHA-4, and CAHA16-CE-3978, and the members of the CARMENES Consortium (Max-Planck-Institut für Astronomie, Instituto de Astrofísica de Andalucía, Landessternwarte Königstuhl, Institut de Ciències de l’Espai, Institut für Astrophysik Göttingen, Universidad Complutense de Madrid, Thüringer Landessternwarte Tautenburg, Instituto de Astrofísica de Canarias, Hamburger Sternwarte, Centro de Astrobiología and Centro Astronómico Hispano-Alemán), with additional contributions by the MINECO, the Deutsche Forschungsge-meinschaft (DFG) through the Major Research Instrumentation Programme and Research Unit FOR2544 “Blue Planets around Red Stars”, the Klaus Tschira Stiftung, the states of Baden-Württemberg and Niedersachsen, and by the Junta de Andalucía. We acknowledge support from DFG through Germany’s Excellence Strategy EXC 2094 – 390783311, the priority program SPP 1992 “Exploring the Diversity of Extrasolar Planets” DFG PR 36 24602/41, and project 31466515; the LMU-Munich Fraunhofer-Schwarzschild Fellowship; the Knut and Alice Wallenberg Foundation through grant 2018.0192; the National Natural Science Foundation of China through project 42375118; the Agencia Estatal de Investigación (AEI/10.13039/501100011033) of the Ministerio de Ciencia e Innovación and the ERDF “A way of making Europe” through projects PID2022-137241NB-C4[1:4], PID2021-125627OB-C31, PID2021-126365NB-C21, RYC2022-037854-I, and the Centre of Excellence “Severo Ochoa” and “María de Maeztu” awards to the Instituto de Astrofísica de Canarias (CEX2019-000920-S), Instituto de Astrofísica de Andalucía (CEX2021-001131-S) and Institut de Ciències de l’Espai (CEX2020-001058-M). This work has made use of the following Python packages: Astropy (Astropy Collaboration 2013), CMasher (van der Velden 2020), corner (Foreman-Mackey 2016), GNU Parallel (Tange 2021), Matplotlib (Hunter 2007), NumPy (Harris et al. 2020), PyAstronomy (Czesla et al. 2019), and SciPy (Virtanen et al. 2020).
Appendix A Posterior distributions
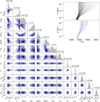 |
A.1 Results of retrieval investigating the dayside atmosphere of TOI-2109b. Corner plot: posterior distributions and correlations between the atmospheric parameters. The dashed vertical lines in the posterior distributions denote the median and 1σ intervals (16th, 50th, and 84th percentiles) for the bounded parameters. For parameters with lower limits, we report the 2σ intervals (5th percentiles). We note that in addition to the free parameters of the retrieval, the present figure also includes log p2, which is calculated as the sum of the free parameters log p1 and dp. Top inset panel: examples of the T -p profiles sampled by the MCMC analysis. Bottom inset panel: median temperature curve with uncertainty intervals. |
 |
A.2 Results of retrieval investigating the nightside atmosphere of TOI-2109b. Corner plot: posterior distributions and correlations between the atmospheric temperature and uncertainty scaling parameters; chemical, velocity, and broadening parameters are set to fixed values. The dashed vertical lines in the posterior distributions denote the median and 1σ intervals (16th, 50th and 84th percentiles) for the bounded parameters. For parameters with upper limits, we report the 2σ intervals (95th percentiles). We note that in addition to the free parameters of the retrieval, the present figure also includes log p2, which is calculated as the sum of the free parameters log p1 and dp. Right top panel: examples of the T -p profiles sampled by the MCMC analysis. Right bottom panel: upper temperature limits of the nightside atmosphere as a function of atmospheric pressure. |
References
- Arcangeli, J., Désert, J.-M., Line, M. R., et al. 2018, ApJ, 855, L30 [Google Scholar]
- Astropy Collaboration (Robitaille, T. P., et al.) 2013, A&A, 558, A33 [NASA ADS] [CrossRef] [EDP Sciences] [Google Scholar]
- Bell, T. J., & Cowan, N. B. 2018, ApJ, 857, L20 [Google Scholar]
- Bell, T. J., Nikolov, N., Cowan, N. B., et al. 2017, ApJ, 847, L2 [Google Scholar]
- Bello-Arufe, A., Cabot, S. H. C., Mendonça, J. M., Buchhave, L. A., & Rathcke, A. D. 2022, AJ, 163, 96 [NASA ADS] [CrossRef] [Google Scholar]
- Birkby, J. L., de Kok, R. J., Brogi, M., et al. 2013, MNRAS, 436, L35 [Google Scholar]
- Birkby, J. L., de Kok, R. J., Brogi, M., Schwarz, H., & Snellen, I. A. G. 2017, AJ, 153, 138 [NASA ADS] [CrossRef] [Google Scholar]
- Borsato, N. W., Hoeijmakers, H. J., Prinoth, B., et al. 2023, A&A, 673, A158 [NASA ADS] [CrossRef] [EDP Sciences] [Google Scholar]
- Brogi, M., & Line, M. R. 2019, AJ, 157, 114 [Google Scholar]
- Brogi, M., Snellen, I. A. G., de Kok, R. J., et al. 2012, Nature, 486, 502 [Google Scholar]
- Brogi, M., Emeka-Okafor, V., Line, M. R., et al. 2023, AJ, 165, 91 [NASA ADS] [CrossRef] [Google Scholar]
- Caballero, J. A., Guàrdia, J., López del Fresno, M., et al. 2016, Proc. SPIE, 9910, 99100E [Google Scholar]
- Cheverall, C. J., Madhusudhan, N., & Holmberg, M. 2023, MNRAS, 522, 661 [NASA ADS] [CrossRef] [Google Scholar]
- Cont, D., Yan, F., Reiners, A., et al. 2021, A&A, 651, A33 [NASA ADS] [CrossRef] [EDP Sciences] [Google Scholar]
- Cont, D., Yan, F., Reiners, A., et al. 2022a, A&A, 668, A53 [NASA ADS] [CrossRef] [EDP Sciences] [Google Scholar]
- Cont, D., Yan, F., Reiners, A., et al. 2022b, A&A, 657, L2 [NASA ADS] [CrossRef] [EDP Sciences] [Google Scholar]
- Cont, D., Nortmann, L., Yan, F., et al. 2024, A&A, 688, A206 [NASA ADS] [CrossRef] [EDP Sciences] [Google Scholar]
- Cowan, N. B., & Agol, E. 2011, ApJ, 726, 82 [NASA ADS] [CrossRef] [Google Scholar]
- Czesla, S., Schröter, S., Schneider, C. P., et al. 2019, Astrophysics Source Code Library [record ascl:1906.010] [Google Scholar]
- Czesla, S., Lampón, M., Cont, D., et al. 2024, A&A, 683, A67 [NASA ADS] [CrossRef] [EDP Sciences] [Google Scholar]
- Díaz, C. G., González, J. F., Levato, H., & Grosso, M. 2011, A&A, 531, A143 [NASA ADS] [CrossRef] [EDP Sciences] [Google Scholar]
- Dorn, R. J., Bristow, P., Smoker, J. V., et al. 2023, A&A, 671, A24 [NASA ADS] [CrossRef] [EDP Sciences] [Google Scholar]
- Finnerty, L., Schofield, T., Sappey, B., et al. 2023, AJ, 166, 31 [NASA ADS] [CrossRef] [Google Scholar]
- Foreman-Mackey, D. 2016, J. Open Source Softw., 1, 24 [NASA ADS] [CrossRef] [Google Scholar]
- Foreman-Mackey, D., Hogg, D. W., Lang, D., & Goodman, J. 2013, PASP, 125, 306 [Google Scholar]
- Fortney, J. J., Lodders, K., Marley, M. S., & Freedman, R. S. 2008, ApJ, 678, 1419 [CrossRef] [Google Scholar]
- Fortney, J. J., Dawson, R. I., & Komacek, T. D. 2021, J. Geophys. Res. Planets, 126, e06629 [NASA ADS] [CrossRef] [Google Scholar]
- Fossati, L., Young, M. E., Shulyak, D., et al. 2021, A&A, 653, A52 [NASA ADS] [CrossRef] [EDP Sciences] [Google Scholar]
- Fossati, L., Biassoni, F., Cappello, G. M., et al. 2023, A&A, 676, A99 [NASA ADS] [CrossRef] [EDP Sciences] [Google Scholar]
- Gaia Collaboration (Brown, A. G. A., et al.) 2018, A&A, 616, A1 [NASA ADS] [CrossRef] [EDP Sciences] [Google Scholar]
- Gaia Collaboration (Vallenari, A., et al.) 2023, A&A, 674, A1 [NASA ADS] [CrossRef] [EDP Sciences] [Google Scholar]
- Gandhi, S., de Regt, S., Snellen, I., et al. 2023, ApJ, 957, L36 [NASA ADS] [CrossRef] [Google Scholar]
- Gaudi, B. S., Stassun, K. G., Collins, K. A., et al. 2017, Nature, 546, 514 [NASA ADS] [Google Scholar]
- Gibson, N. P., Merritt, S., Nugroho, S. K., et al. 2020, MNRAS, 493, 2215 [Google Scholar]
- Gibson, N. P., Nugroho, S. K., Lothringer, J., Maguire, C., & Sing, D. K. 2022, MNRAS, 512, 4618 [NASA ADS] [CrossRef] [Google Scholar]
- Grimm, S. L., & Heng, K. 2015, ApJ, 808, 182 [NASA ADS] [CrossRef] [Google Scholar]
- Guo, B., Yan, F., Nortmann, L., et al. 2024, A&A, 687, A103 [NASA ADS] [CrossRef] [EDP Sciences] [Google Scholar]
- Harre, J. V., Smith, A. M. S., Barros, S. C. C., et al. 2024, A&A, 692, A254 [NASA ADS] [CrossRef] [EDP Sciences] [Google Scholar]
- Harris, C. R., Millman, K. J., van der Walt, S. J., et al. 2020, Nature, 585, 357 [NASA ADS] [CrossRef] [Google Scholar]
- Hoeijmakers, H. J., Kitzmann, D., Morris, B. M., et al. 2024, A&A, 685, A139 [NASA ADS] [CrossRef] [EDP Sciences] [Google Scholar]
- Hubeny, I., Burrows, A., & Sudarsky, D. 2003, ApJ, 594, 1011 [Google Scholar]
- Hunter, J. D. 2007, Comput. Sci. Eng., 9, 90 [Google Scholar]
- Hut, P. 1981, A&A, 99, 126 [NASA ADS] [Google Scholar]
- Johnson, M. C., Wang, J., Asnodkar, A. P., et al. 2023, AJ, 165, 157 [NASA ADS] [CrossRef] [Google Scholar]
- Kasper, D., Bean, J. L., Line, M. R., et al. 2021, ApJ, 921, L18 [CrossRef] [Google Scholar]
- Keating, D., Cowan, N. B., & Dang, L. 2019, Nat. Astron., 3, 1092 [Google Scholar]
- Kitzmann, D., Heng, K., Rimmer, P. B., et al. 2018, ApJ, 863, 183 [Google Scholar]
- Komacek, T. D., & Showman, A. P. 2016, ApJ, 821, 16 [CrossRef] [Google Scholar]
- Komacek, T. D., & Tan, X. 2018, Res. Notes Am. Astron. Soc., 2, 36 [Google Scholar]
- Kreidberg, L., Line, M. R., Parmentier, V., et al. 2018, AJ, 156, 17 [NASA ADS] [CrossRef] [Google Scholar]
- Kurucz, R. L. 2018, ASP Conf. Ser., 515, 47 [Google Scholar]
- Landman, R., Sánchez-López, A., Mollière, P., et al. 2021, A&A, 656, A119 [NASA ADS] [CrossRef] [EDP Sciences] [Google Scholar]
- Lavail, A. 2025, 10.5281/zenodo.15037659 [Google Scholar]
- Lesjak, F., Nortmann, L., Cont, D., et al. 2025, A&A, 693, A72 [NASA ADS] [CrossRef] [EDP Sciences] [Google Scholar]
- Li, G., Gordon, I. E., Rothman, L. S., et al. 2015, ApJS, 216, 15 [NASA ADS] [CrossRef] [Google Scholar]
- Line, M. R., Brogi, M., Bean, J. L., et al. 2021, Nature, 598, 580 [NASA ADS] [CrossRef] [Google Scholar]
- Lothringer, J. D., Barman, T., & Koskinen, T. 2018, ApJ, 866, 27 [NASA ADS] [CrossRef] [Google Scholar]
- Malik, M., Grosheintz, L., Mendonça, J. M., et al. 2017, AJ, 153, 56 [Google Scholar]
- Malik, M., Kitzmann, D., Mendonça, J. M., et al. 2019, AJ, 157, 170 [Google Scholar]
- Matthews, S. M., Watson, C. A., de Mooij, E. J. W., et al. 2024, MNRAS, 531, 3800 [Google Scholar]
- Miller-Ricci Kempton, E., & Rauscher, E. 2012, ApJ, 751, 117 [CrossRef] [Google Scholar]
- Molaverdikhani, K., Helling, C., Lew, B. W. P., et al. 2020, A&A, 635, A31 [NASA ADS] [CrossRef] [EDP Sciences] [Google Scholar]
- Mollière, P., Wardenier, J. P., van Boekel, R., et al. 2019, A&A, 627, A67 [Google Scholar]
- Morello, G., Danielski, C., Dickens, D., Tremblin, P., & Lagage, P. O. 2019, AJ, 157, 205 [NASA ADS] [CrossRef] [Google Scholar]
- Morello, G., Changeat, Q., Dyrek, A., Lagage, P. O., & Tan, J. C. 2023, A&A, 676, A54 [NASA ADS] [CrossRef] [EDP Sciences] [Google Scholar]
- Mraz, G., Darveau-Bernier, A., Boucher, A., et al. 2024, ApJ, 975, L42 [Google Scholar]
- Nugroho, S. K., Kawahara, H., Masuda, K., et al. 2017, AJ, 154, 221 [Google Scholar]
- Nugroho, S. K., Kawahara, H., Gibson, N. P., et al. 2021, ApJ, 910, L9 [CrossRef] [Google Scholar]
- Parmentier, V., Showman, A. P., & Lian, Y. 2013, A&A, 558, A91 [NASA ADS] [CrossRef] [EDP Sciences] [Google Scholar]
- Parmentier, V., Line, M. R., Bean, J. L., et al. 2018, A&A, 617, A110 [NASA ADS] [CrossRef] [EDP Sciences] [Google Scholar]
- Pelletier, S., Benneke, B., Darveau-Bernier, A., et al. 2021, AJ, 162, 73 [NASA ADS] [CrossRef] [Google Scholar]
- Pelletier, S., Benneke, B., Ali-Dib, M., et al. 2023, Nature, 619, 491 [NASA ADS] [CrossRef] [Google Scholar]
- Pelletier, S., Benneke, B., Chachan, Y., et al. 2025, AJ, 169, 10 [NASA ADS] [CrossRef] [Google Scholar]
- Pino, L., Désert, J.-M., Brogi, M., et al. 2020, ApJ, 894, L27 [Google Scholar]
- Polyansky, O. L., Kyuberis, A. A., Zobov, N. F., et al. 2018, MNRAS, 480, 2597 [NASA ADS] [CrossRef] [Google Scholar]
- Prinoth, B., Hoeijmakers, H. J., Kitzmann, D., et al. 2022, Nat. Astron., 6, 449 [Google Scholar]
- Quirrenbach, A., Amado, P. J., Ribas, I., et al. 2018, SPIE Conf. Ser., 10702, 107020W [Google Scholar]
- Ramkumar, S., Gibson, N. P., Nugroho, S. K., Maguire, C., & Fortune, M. 2023, MNRAS, 525, 2985 [CrossRef] [Google Scholar]
- Ramkumar, S., Gibson, N. P., Nugroho, S. K., Fortune, M., & Maguire, C. 2025, A&A, 695, A110 [NASA ADS] [CrossRef] [EDP Sciences] [Google Scholar]
- Ridden-Harper, A., de Mooij, E., Jayawardhana, R., et al. 2023, AJ, 165, 211 [NASA ADS] [CrossRef] [Google Scholar]
- Roth, A., Drummond, B., Hébrard, E., et al. 2021, MNRAS, 505, 4515 [NASA ADS] [CrossRef] [Google Scholar]
- Schwarz, H., Brogi, M., de Kok, R., Birkby, J., & Snellen, I. 2015, A&A, 576, A111 [NASA ADS] [CrossRef] [EDP Sciences] [Google Scholar]
- Schwartz, J. C., Kashner, Z., Jovmir, D., & Cowan, N. B. 2017, ApJ, 850, 154 [Google Scholar]
- Seidel, J. V., Prinoth, B., Pino, L., et al. 2025, Nature, 639, 902 [Google Scholar]
- Showman, A. P., Fortney, J. J., Lewis, N. K., & Shabram, M. 2013, ApJ, 762, 24 [Google Scholar]
- Shporer, A., Wong, I., Huang, C. X., et al. 2019, AJ, 157, 178 [Google Scholar]
- Smette, A., Sana, H., Noll, S., et al. 2015, A&A, 576, A77 [NASA ADS] [CrossRef] [EDP Sciences] [Google Scholar]
- Snellen, I. A. G., de Kok, R. J., de Mooij, E. J. W., & Albrecht, S. 2010, Nature, 465, 1049 [Google Scholar]
- Spiegel, D. S., Silverio, K., & Burrows, A. 2009, ApJ, 699, 1487 [Google Scholar]
- Stock, J. W., Kitzmann, D., & Patzer, A. B. C. 2022, MNRAS, 517, 4070 [NASA ADS] [CrossRef] [Google Scholar]
- Tamuz, O., Mazeh, T., & Zucker, S. 2005, MNRAS, 356, 1466 [Google Scholar]
- Tan, X., & Komacek, T. D. 2019, ApJ, 886, 26 [Google Scholar]
- Tange, O. 2021, 10.5281/zenodo.5233953 [Google Scholar]
- van der Velden, E. 2020, J. Open Source Softw., 5, 2004 [Google Scholar]
- Virtanen, P., Gommers, R., Oliphant, T. E., et al. 2020, Nat. Methods, 17, 261 [Google Scholar]
- Wardenier, J. P., Parmentier, V., Lee, E. K. H., & Line, M. R. 2025, arXiv e-prints [arXiv:2502.01606] [Google Scholar]
- Wong, I., Shporer, A., Zhou, G., et al. 2021, AJ, 162, 256 [NASA ADS] [CrossRef] [Google Scholar]
- Yan, F., & Henning, T. 2018, Nat. Astron., 2, 714 [Google Scholar]
- Yan, F., Pallé, E., Reiners, A., et al. 2022a, A&A, 661, L6 [NASA ADS] [CrossRef] [EDP Sciences] [Google Scholar]
- Yan, F., Reiners, A., Pallé, E., et al. 2022b, A&A, 659, A7 [NASA ADS] [CrossRef] [EDP Sciences] [Google Scholar]
- Yan, F., Nortmann, L., Reiners, A., et al. 2023, A&A, 672, A107 [NASA ADS] [CrossRef] [EDP Sciences] [Google Scholar]
- Yang, Y., Chen, G., Yan, F., Tan, X., & Ji, J. 2024, ApJ, 971, L8 [Google Scholar]
- Zechmeister, M., Anglada-Escudé, G., & Reiners, A. 2014, A&A, 561, A59 [NASA ADS] [CrossRef] [EDP Sciences] [Google Scholar]
- Zhang, Y., Snellen, I. A. G., Wyttenbach, A., et al. 2022, A&A, 666, A47 [NASA ADS] [CrossRef] [EDP Sciences] [Google Scholar]
As in Wong et al. (2021), Teq refers to the dayside-redistribution equilibrium temperature, which assumes uniform heat redistribution over the dayside and T = 0 K in the nightside hemisphere (Cowan & Agol 2011).
The extracted data, including the refined wavelength solution of CRIRES+, are available at https://zenodo.org/records/ 15037659 (Lavail 2025).
See Sect. 6.1.3 of the cr2res user manual at https://ftp.eso.org/pub/dfs/pipelines/instruments/cr2res/cr2re-pipeline-manual-1.4.4.pdf
All Tables
All Figures
|
Fig. 1 Orbital phase coverage of TOI-2109b observations. CARMENES observations are shown as hatched lines, while CRIRES+ observations are shown as solid lines. Observations where the planet’s day- and nightside are mostly aligned with the observer’s line of sight are represented in blue and orange, respectively. The CRIRES+ observation excluded due to poor data quality is shown in light orange. |
| In the text | |
|
Fig. 2 Example of data reduction steps for a selected CRIRES+ wave-length range. Top panel: unprocessed spectra as extracted from the instrument pipeline. Middle panel: spectral matrix after continuum nor-malization and outlier correction; deep telluric lines are masked. Bottom panel: residual spectral matrix after telluric and stellar line removal with SYSREM. |
| In the text | |
|
Fig. 3 Spectral models (left panels) and S/N maps (right panels) of the chemical species investigated in the dayside atmosphere of TOI-2109b. The three top panels show the information for the individual chemical species Fe I, CO, and H2O, the bottom panels show the information for all species combined. We note that the species-combined signal is dominated by the CO detection with CRIRES+. The Fe I spectral signature mainly stems from CARMENES, the CO signal from the CRIRES+ data; the investigated H2O emission lines fall in the wavelength ranges of both instruments. The H2O model spectrum shows particularly weak emission lines due to the predominant thermal dissociation of the species at the elevated temperatures of the TOI-2109b atmosphere. The wavelengths covered by CARMENES and the CRIRES+ K2166 setting used in this work are indicated by the gray shaded area. The expected position of the planetary signal in the S/N maps is indicated by the yellow dashed lines. We show the S/N maps corresponding to the optimal SYSREM iteration number as determined in Sect. 4.3. |
| In the text | |
|
Fig. 4 Same as Fig. 3 but for the nightside atmosphere of TOI-2109b. The investigated species result in nondetections. The nightside hemisphere was observed exclusively with CRIRES+. |
| In the text | |
|
Fig. 5 S/N values of Fe I and CO as a function of SYSREM iterations. Iterations with the most significant S/N peaks are indicated by the star symbol. |
| In the text | |
|
Fig. 6 Atmospheric temperature and abundance profiles. The left panel shows a comparison between the median T -p profile from the retrieval (solid line) and the T -p profiles from the self-consistent HELIOS model. The HELIOS temperature curves represent the two limiting cases of no and full day-to nightside heat redistribution. The uncertainty interval of the retrieved T -p curve is represented by the blue shaded area. Our T -p measurement is slightly closer to the no heat redistribution scenario than to the full heat redistribution scenario. For comparison, we also include the dayside temperature measurement from Wong et al. (2021), shown as the gray data point. This measurement is expected to reflect the thermal conditions at low atmospheric altitudes, and is therefore in line with the retrieved T -p profile. Since Wong et al. (2021) do not provide a specific pressure value, we show this data point outside the T -p space. The right panel shows the abundances (solid lines) of the chemical species studied by cross-correlation and the corresponding uncertainties (shaded areas). Both Fe I and CO abundances drop significantly at pressures below ∼10−3 bar, indicating that our data are most sensitive to atmospheric layers at or above this pressure level. |
| In the text | |
|
Fig. 7 Upper temperature limits in the nightside hemisphere of TOI-2109b and posterior distribution of the atmospheric temperature gradient. The orange shaded area represents the 95th percentile confidence interval of the temperatures as a function of atmospheric pressure. The inset panel shows the posterior distribution of the T -p gradient for thermal profiles with decreasing temperatures towards lower pressures. The 84th and 95th percentile confidence intervals at 695 K/log bar and 1535 K/log bar are indicated by the blue dashed and red dotted lines, respectively. These gradients represent upper limits below which the atmospheric signal cannot be retrieved in the present data. The gradients are shown as blue dashed and red dotted lines in T -p space. |
| In the text | |
|
A.1 Results of retrieval investigating the dayside atmosphere of TOI-2109b. Corner plot: posterior distributions and correlations between the atmospheric parameters. The dashed vertical lines in the posterior distributions denote the median and 1σ intervals (16th, 50th, and 84th percentiles) for the bounded parameters. For parameters with lower limits, we report the 2σ intervals (5th percentiles). We note that in addition to the free parameters of the retrieval, the present figure also includes log p2, which is calculated as the sum of the free parameters log p1 and dp. Top inset panel: examples of the T -p profiles sampled by the MCMC analysis. Bottom inset panel: median temperature curve with uncertainty intervals. |
| In the text | |
|
A.2 Results of retrieval investigating the nightside atmosphere of TOI-2109b. Corner plot: posterior distributions and correlations between the atmospheric temperature and uncertainty scaling parameters; chemical, velocity, and broadening parameters are set to fixed values. The dashed vertical lines in the posterior distributions denote the median and 1σ intervals (16th, 50th and 84th percentiles) for the bounded parameters. For parameters with upper limits, we report the 2σ intervals (95th percentiles). We note that in addition to the free parameters of the retrieval, the present figure also includes log p2, which is calculated as the sum of the free parameters log p1 and dp. Right top panel: examples of the T -p profiles sampled by the MCMC analysis. Right bottom panel: upper temperature limits of the nightside atmosphere as a function of atmospheric pressure. |
| In the text | |
Current usage metrics show cumulative count of Article Views (full-text article views including HTML views, PDF and ePub downloads, according to the available data) and Abstracts Views on Vision4Press platform.
Data correspond to usage on the plateform after 2015. The current usage metrics is available 48-96 hours after online publication and is updated daily on week days.
Initial download of the metrics may take a while.