Fig. 6
Download original image
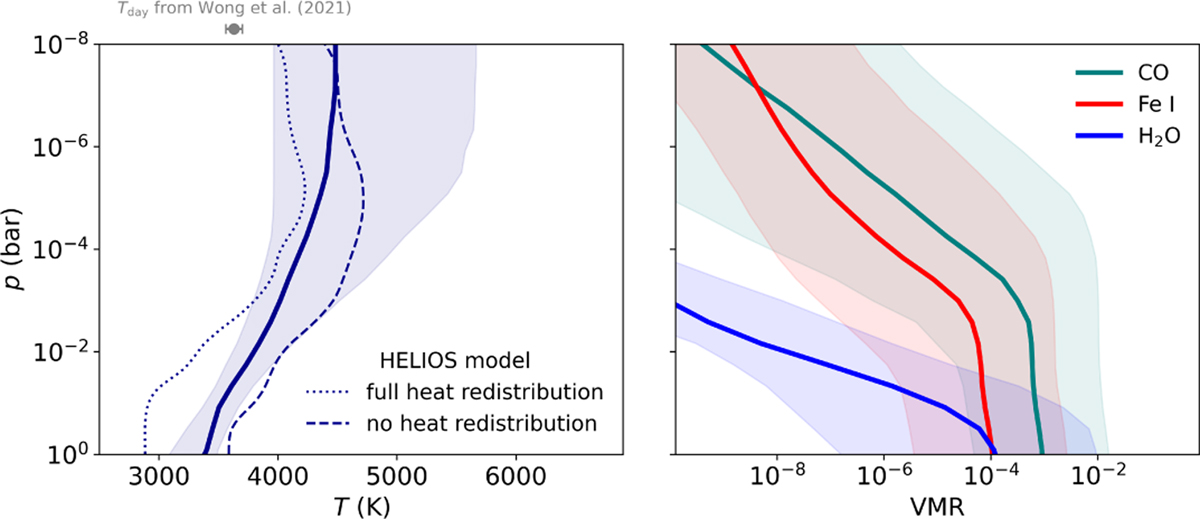
Atmospheric temperature and abundance profiles. The left panel shows a comparison between the median T -p profile from the retrieval (solid line) and the T -p profiles from the self-consistent HELIOS model. The HELIOS temperature curves represent the two limiting cases of no and full day-to nightside heat redistribution. The uncertainty interval of the retrieved T -p curve is represented by the blue shaded area. Our T -p measurement is slightly closer to the no heat redistribution scenario than to the full heat redistribution scenario. For comparison, we also include the dayside temperature measurement from Wong et al. (2021), shown as the gray data point. This measurement is expected to reflect the thermal conditions at low atmospheric altitudes, and is therefore in line with the retrieved T -p profile. Since Wong et al. (2021) do not provide a specific pressure value, we show this data point outside the T -p space. The right panel shows the abundances (solid lines) of the chemical species studied by cross-correlation and the corresponding uncertainties (shaded areas). Both Fe I and CO abundances drop significantly at pressures below ∼10−3 bar, indicating that our data are most sensitive to atmospheric layers at or above this pressure level.
Current usage metrics show cumulative count of Article Views (full-text article views including HTML views, PDF and ePub downloads, according to the available data) and Abstracts Views on Vision4Press platform.
Data correspond to usage on the plateform after 2015. The current usage metrics is available 48-96 hours after online publication and is updated daily on week days.
Initial download of the metrics may take a while.