Fig. 2
Download original image
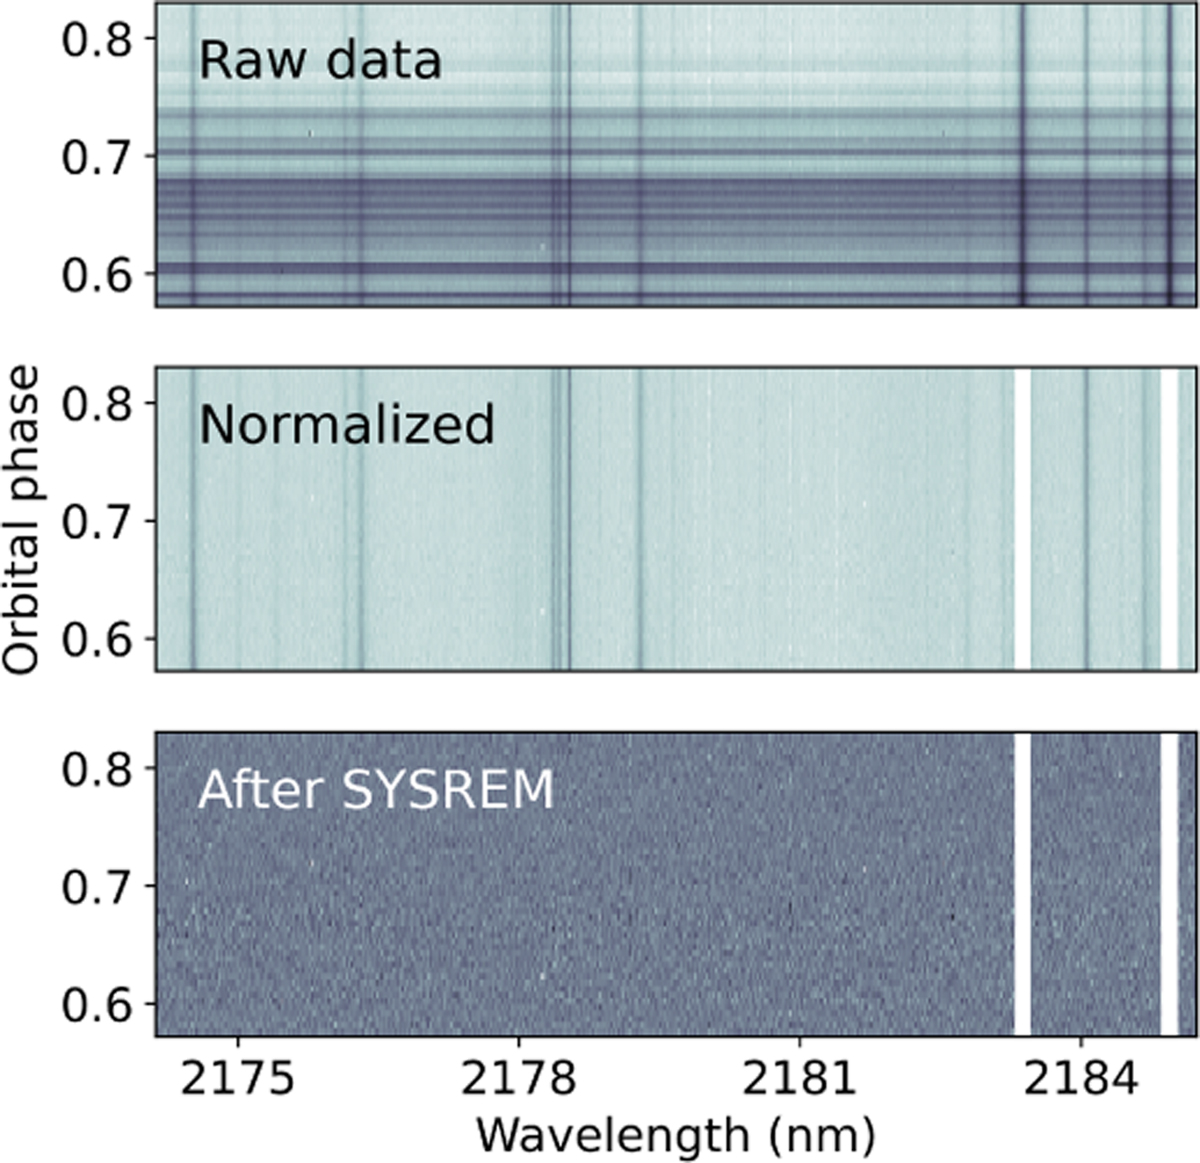
Example of data reduction steps for a selected CRIRES+ wave-length range. Top panel: unprocessed spectra as extracted from the instrument pipeline. Middle panel: spectral matrix after continuum nor-malization and outlier correction; deep telluric lines are masked. Bottom panel: residual spectral matrix after telluric and stellar line removal with SYSREM.
Current usage metrics show cumulative count of Article Views (full-text article views including HTML views, PDF and ePub downloads, according to the available data) and Abstracts Views on Vision4Press platform.
Data correspond to usage on the plateform after 2015. The current usage metrics is available 48-96 hours after online publication and is updated daily on week days.
Initial download of the metrics may take a while.