A.2
Download original image
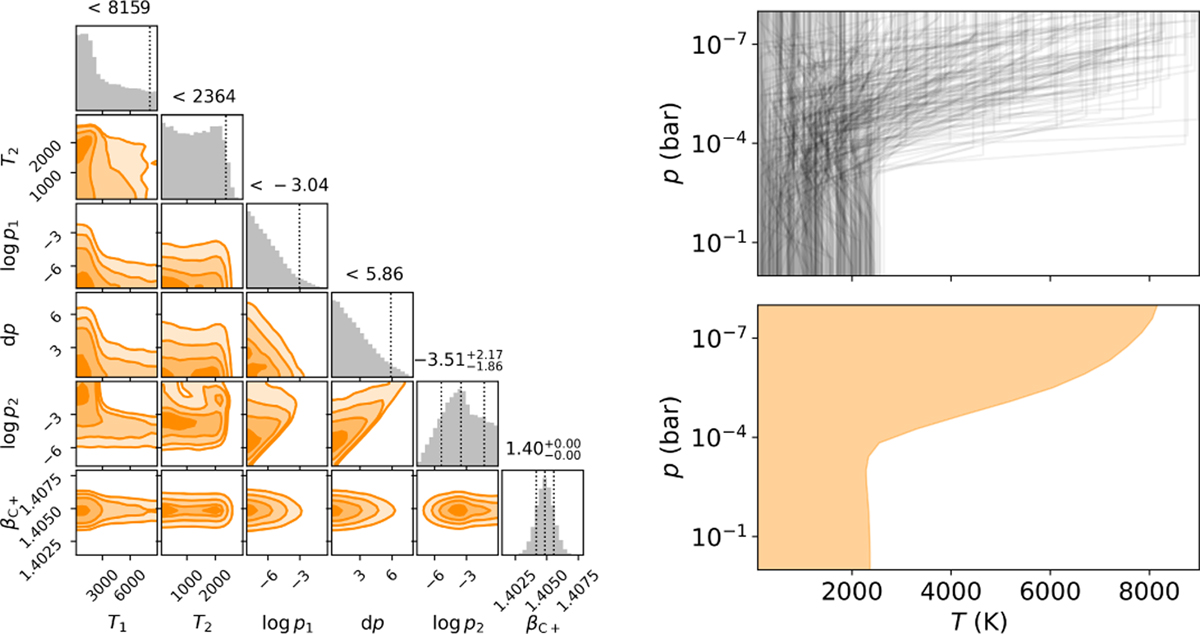
Results of retrieval investigating the nightside atmosphere of TOI-2109b. Corner plot: posterior distributions and correlations between the atmospheric temperature and uncertainty scaling parameters; chemical, velocity, and broadening parameters are set to fixed values. The dashed vertical lines in the posterior distributions denote the median and 1σ intervals (16th, 50th and 84th percentiles) for the bounded parameters. For parameters with upper limits, we report the 2σ intervals (95th percentiles). We note that in addition to the free parameters of the retrieval, the present figure also includes log p2, which is calculated as the sum of the free parameters log p1 and dp. Right top panel: examples of the T -p profiles sampled by the MCMC analysis. Right bottom panel: upper temperature limits of the nightside atmosphere as a function of atmospheric pressure.
Current usage metrics show cumulative count of Article Views (full-text article views including HTML views, PDF and ePub downloads, according to the available data) and Abstracts Views on Vision4Press platform.
Data correspond to usage on the plateform after 2015. The current usage metrics is available 48-96 hours after online publication and is updated daily on week days.
Initial download of the metrics may take a while.