Fig. 7
Download original image
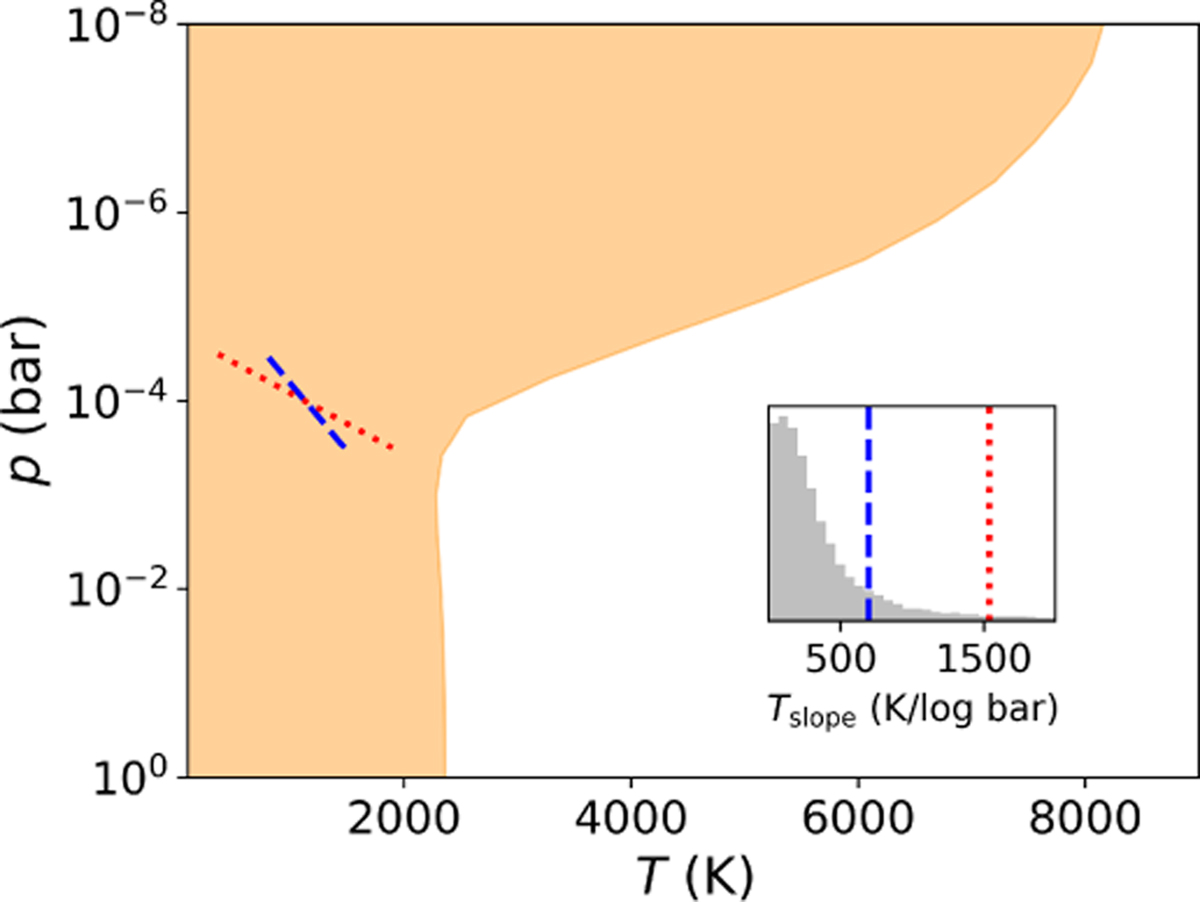
Upper temperature limits in the nightside hemisphere of TOI-2109b and posterior distribution of the atmospheric temperature gradient. The orange shaded area represents the 95th percentile confidence interval of the temperatures as a function of atmospheric pressure. The inset panel shows the posterior distribution of the T -p gradient for thermal profiles with decreasing temperatures towards lower pressures. The 84th and 95th percentile confidence intervals at 695 K/log bar and 1535 K/log bar are indicated by the blue dashed and red dotted lines, respectively. These gradients represent upper limits below which the atmospheric signal cannot be retrieved in the present data. The gradients are shown as blue dashed and red dotted lines in T -p space.
Current usage metrics show cumulative count of Article Views (full-text article views including HTML views, PDF and ePub downloads, according to the available data) and Abstracts Views on Vision4Press platform.
Data correspond to usage on the plateform after 2015. The current usage metrics is available 48-96 hours after online publication and is updated daily on week days.
Initial download of the metrics may take a while.