| Issue |
A&A
Volume 698, June 2025
|
|
|---|---|---|
| Article Number | L25 | |
| Number of page(s) | 9 | |
| Section | Letters to the Editor | |
| DOI | https://doi.org/10.1051/0004-6361/202451984 | |
| Published online | 17 June 2025 | |
Letter to the Editor
Discovery of a kinematically distinct component in the central region of the collisional ring galaxy AM0644-741
1
Academia Sinica Institute of Astronomy and Astrophysics (ASIAA), No. 1, Section 4, Roosevelt Road, Taipei 106319, Taiwan
2
Inter-University Centre for Astronomy and Astrophysics, Ganeshkhind, Post Bag 4, Pune 411007, India
3
Indian Institute of Astrophysics, Koramangala II Block, Bangalore 560034, India
⋆ Corresponding author: This email address is being protected from spambots. You need JavaScript enabled to view it.
; This email address is being protected from spambots. You need JavaScript enabled to view it.
Received:
25
August
2024
Accepted:
19
May
2025
Abstract
We present the discovery of a peculiar central stellar structure in the collisional ring galaxy AM0644-741 using HST imaging and MUSE integral field unit (IFU) data. We identified two Sérsic components with a Sérsic index of 1.72 (inner part) and 1.11 (outer part) in the HST F814W band optical image using GALFIT. We utilized the MUSE data cube to construct stellar line-of-sight velocity (VLOS), velocity dispersion (σLOS), h3 and h4 velocity moments, and stellar population age maps using the GIST pipeline for further investigating both Sérsic components, which have a difference of ∼60° in their position angle. The inner component, with an effective radius of ∼1 kpc, shows a strong anticorrelation between VLOS/σLOS and h3, indicating the presence of a rotating stellar structure. In addition, the inner component shows a higher velocity dispersion (average values reaching up to ∼240 km s−1) along with disky isophotes and a stronger Mg b line strength, which all together highlight a peculiar dynamical state of AM0644-741’s central region. Our analysis suggests that the recent encounter has had a smaller impact on the stellar orbits within the inner component. In contrast, it has specifically affected the stellar orbits of the progenitor’s outer disk when forming the star-forming ring. The Baldwin, Phillips and Terlevich (BPT) analysis of the unresolved nuclear source shows a low-ionization nuclear emission-line region (LINER) type ionization, hinting at active galactic nucleus (AGN) activity in the galaxy. Our study projects the dynamical evolution of collisional systems and provides scope for simulations to explore the central region in greater detail.
Key words: galaxies: bulges / galaxies: evolution / galaxies: interactions / galaxies: kinematics and dynamics / galaxies: structure
© The Authors 2025
 Open Access article, published by EDP Sciences, under the terms of the Creative Commons Attribution License (https://creativecommons.org/licenses/by/4.0), which permits unrestricted use, distribution, and reproduction in any medium, provided the original work is properly cited.
This article is published in open access under the Subscribe to Open model. This email address is being protected from spambots. You need JavaScript enabled to view it. to support open access publication.
1. Introduction
Collisional ring galaxies (CRGs) are known to form through the encounter of two galaxies in which a satellite compact galaxy crashes through the disk of a larger progenitor galaxy (Lynds & Toomre 1976; Theys & Spiegel 1976; Appleton & Struck-Marcell 1996). Such encounters produce radially propagating density waves, resulting in the formation of rings (Lynds & Toomre 1976). The ring hosts the majority of the ongoing star formation in the galaxy, whereas it is generally quenched in the enclosed disk (Marston & Appleton 1995; Appleton & Marston 1997; Korchagin et al. 2001). Depending on the intruder galaxy and the nature of the collision, the central region of the progenitor also goes through morphological and dynamical changes (Athanassoula et al. 1997; Renaud et al. 2018; Elagali et al. 2018). A stellar bar was discovered in the central region of the Cartwheel galaxy, and its preexisting nature was shown by studying the kinematics and stellar populations in the bar region using integral field spectroscopy data from MUSE (Barway et al. 2020; Mondal & Barway 2024). A photometric and kinematic analysis of the central region of such galaxies is required to understand how a collision can affect the disk and other preexisting structural components.
AM0644-741 and the Cartwheel galaxy (Arp & Madore 1987; Few et al. 1982; Marcum et al. 1992; Appleton & Marston 1997; Higdon et al. 2011) host two of the physically largest rings among the CRGs, and are often used to illustrate the success of collisional ring formation. However, a recent study by Pasha et al. (2025) reported an even larger ring with a diameter of ∼140 kpc in the galaxy Bullseye that hosts nine ring structures. The ring of the galaxy AM0644-741 (the “Lindsay-Shapley Ring”) has a major axis diameter of ∼42 kpc (Higdon et al. 2011). The kinematics of the ring suggests that the galaxy underwent a collision ∼133 Myr ago, which confirms that this encounter was more recent than Cartwheel’s (Higdon et al. 2011). The position of the nucleus with respect to the asymmetrically distributed ring indicates an off-centered collision (Antunes & Wallin 2007; Higdon et al. 2011). Optical spectroscopy by Few et al. (1982) showed the ring to be rich in giant star-forming complexes and expanding at a velocity of ∼128 km/sec in accordance with the collisional scenario of ring formation. Utilizing molecular data from the SEST and the H I observations from the ATCA, Higdon et al. (2011) found the ring to be predominant in atomic gas (fmol = 0.062), with no evidence of molecular gas in the nuclear region. However, Horellou et al. (1995) reported the presence of molecular gas in the central region of AM0644-741.
The majority of studies on AM0644-741 have targeted the star-forming outer ring. The properties of the inner stellar disk, which carries the imprint of the progenitor galaxy, have not been explored well. Considering the morphology and the grand size of the ring, the galaxy AM0644-741 offers an ideal platform to understand the structural evolution of a typical collisional system. In this Letter, we study the photometric and kinematic properties of the inner region of the galaxy AM0644-741 to understand its post-collisional nature. The Letter is arranged as follows. Section 2 presents the details of data used. Section 3 describes the analysis. The discussion takes place in Section 4, followed by the conclusion in Section 5. We adopt a cosmology with H0 = 70 km s−1 Mpc−1, ΩΛ = 0.7, ΩM = 0.3, and provide all magnitudes in the AB system.
2. Data
We used the integral field unit (IFU) spectroscopic data of the galaxy AM0644-741 observed using the Multi-Unit Spectroscopic Explorer (MUSE) instrument installed at ESO’s Very Large Telescope (VLT) (Bacon et al. 2010). Each spaxel (size ∼ 0 2 × 0
2 × 0 2) of the MUSE IFU (field of view ∼ 1′ × 1′) provides an optical spectrum covering the wavelength range 4750–9350 Å. The IFU offers a spectral resolution of ∼1.25 Å, enabling deblended identification of many important optical emission lines. We acquired the IFU data of the galaxy AM0644-741 from the ESO science portal (Program ID – 106.2155.001). The entire MUSE deep cube covers a rectangular area of ∼1.0′ × 1.8′ (Figure 1). We created a smaller cutout ∼40″×40″ (area marked in blue rectangle in Figure 1) in size for analyzing only the inner part of AM0644-741 in this study. We note here that by “inner part of the galaxy” or “the galaxy” in the rest of the paper we mean the region inside the blue rectangle. The seeing of the MUSE observation is reported as ∼1
 16, which allows us to characterize the spectral properties of the reported central source in the galaxy. We also used the optical image (size ∼ 25″×25″, i.e., the area marked in the red rectangle in Figure 1) in the F814W filter observed with ACS wide field channel on board the Hubble Space Telescope (HST) to perform a photometric structural decomposition. The HST image, with ∼10 times better angular resolution than MUSE, is particularly useful to identify any existing smaller structural components in the central part of the galaxy.
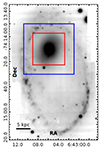 |
Fig. 1. MUSE white light image of the galaxy AM0644-741 constructed by combining frames between 4800 and 5800 Å from the IFU cube. The red and blue rectangles show the extent of the HST F814W band image and the MUSE data cube analyzed in this study, respectively. |
3. Analysis
3.1. Structural components from 2D image decomposition
We used GALFIT (Peng et al. 2002) to perform a 2D decomposition of the inner part (as shown in Figure 2) in the HST F814W band image. A good fit was obtained using two Sérsic functions, while the central object was modeled as an unresolved point source convolved with the PSF, which has a total F814W band magnitude of 19.29 mag. The resulting surface brightness profiles, derived using the IRAF ELLIPSE task, from the observed and model images are shown in Figure 2, and the model-derived parameters are listed in Table 1. For better visualization of the GALFIT modeling, we have also shown the observed image, the best-fit model, and the residual map in Figure A.1. The outer component has a Sérsic index (nb) of 1.11, which signals an exponential disk, whereas detection of the inner Sérsic component, with nb = 1.72, could indicate the presence of a bulge-like structure in the galaxy. The effective radii (re) of the inner and outer components are found to be 2 19 (∼0.97 kpc) and 9
 98 (∼4.44 kpc), respectively. We noticed a difference of ∼60° between the position angle (PA) of the two fit Sérsic models (clear from the PA profile in Figure A.2 as well), which strengthens the existence of two distinct components in the galaxy. The ellipticity and PA profiles, shown in Figure A.2, exhibit isophotal twisting, which further confirms the presence of two components (discussed in Appendix A). As the galaxy is known to be moderately inclined in the sky (i = 57.2°; Few et al. 1982), we further examined the effect of inclination on the detected components and found that the observed isophotal twist is not a result of the inclination angle (discussed in Appendix B). In this work, we present our analysis using the observed images as the measurement of the inclination angle in CRGs, especially from the outer ring, can include significant bias in the case of non-isotropic expansion of the ring (e.g., Bizyaev et al. 2007). As a result, one has to be cautious while interpreting structures even from a deprojected image.
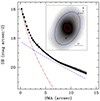 |
Fig. 2. Surface brightness profiles derived using the IRAF ELLIPSE task from the HST F814W band observed and GALFIT model images. The black points denote the values derived from the observed image, whereas the profiles for the inner Sérsic, outer Sérsic, and the combined model are shown in dashed red, dashed blue, and solid black lines, respectively. In the inset, we show the HST image and the extent of both components in respective colors, considering values as specified in Table 1. The errors, shown for the observed surface brightness, were calculated from the root mean square scatter of the isophotal intensity. |
3.2. MUSE kinematics of the detected components
We employed the penalised pixel fitting (pPXF) module (Cappellari & Emsellem 2004; Cappellari 2017) of the GIST IFU data analysis pipeline (Bittner et al. 2019) to produce kinematic maps of the galaxy using the MUSE data cube. The observed MUSE data were binned spatially considering the Voronoi binning method (Cappellari & Copin 2003) to improve the signal-to-noise ratio (S/N) of the spectra before performing the fitting. As a convenient choice, we fixed the upper limit of the S/N as 30 and the lower limit as 3 for the Voronoi binning. The integrated spectrum of each binned unit was fit with MILES template spectra (Vazdekis et al. 2010) combined with a line-of-sight velocity distribution (LOSVD) function within the wavelength range 4800–5800 Å as suggested in Bittner et al. (2021, 2019) to extract the kinematic maps. As a product of the best-fit solution, we derived the values of stellar LOS velocity (VLOS), velocity dispersion (σLOS), and higher-order velocity moments, h3 and h4. In Figure 3, we show the spatial maps of VLOS/σLOS, σLOS, and the h3 velocity moment. We have shown the LOS velocity and the h4 velocity moment maps in Figure A.3. Both the LOS velocity and VLOS/σLOS maps show the signature of a rotating stellar disk. We also notice that the PA of the line of nodes, observed in the VLOS/σLOS map, shows a significant shift from the inner part to the outer part, which matches well with the change in the PA of the two Sérsic components. Our findings convey that although the photometric and kinematic axes of each respective Sérsic component are closely aligned, the axes of the inner component are misaligned by ∼60° with respect to that of the outer component, which reinforces the existence of two distinct units in the galaxy. Furthermore, the overall elevated h4 values, observed within the extent of the inner component (Figure A.3), suggest the presence of two superimposed structural components in the central part of the galaxy (Gadotti et al. 2020). The VLOS/σLOS and h3 show a clear trend of anticorrelation within the extent of the inner component. However, the LOS stellar velocity dispersion in the inner part is higher (σ ∼ 200 − 260 km/s) than the typical values observed in normal disk galaxies (Mogotsi & Romeo 2019; Oh et al. 2020; Gadotti et al. 2020). Considering the inclination angle of the galaxy, we note here that the actual values of velocity and velocity dispersion would be higher than the derived LOS measurements. However, the trend observed in different maps shown in Figure 3, which are primarily utilized for interpreting the kinematic nature of the inner region, will persist even after correcting for the inclination effect.
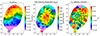 |
Fig. 3. Stellar kinematic maps of AM0644-741 derived from the MUSE IFU data using the GIST pipeline. The figure shows stellar VLOS/σLOS (left), velocity dispersion (σLOS) (middle), and h3 velocity moment (right) maps of the inner part (i.e., the region within the blue rectangle shown in Figure 1). The ellipses shown in solid and dashed black lines represent the inner and outer Sérsic components identified in the HST optical image (Figure 2). The dashed black rectangle shows the pseudo slit that was used to derive the radial VLOS/σLOS and σLOS profiles (shown in Figure 4) along the major axis of the detected inner component. |
4. Discussion
4.1. Photometric and kinematic nature of the inner component
Collisional ring galaxies are ideal laboratories for studying the impact of galaxy interaction on their structural evolution and the subsequent star formation. The newly formed rings, which host sites of intense star formation in the post-collisional phase, carry important clues about the dynamics of the collision. The majority of the studies on CRGs have targeted these star-forming rings, keeping the central region, which carries the imprint of the progenitor’s disk, less explored. Our findings in the galaxy AM0644-741 are therefore important to understand the evolution of the underlying disk in CRGs. Our photometric image decomposition has identified two Sersic components in the galaxy with Sérsic index values of 1.72 (inner) and 1.11 (outer), signifying the presence of two distinct stellar structures. To better understand the photometric nature of these structures, we have inspected the ellipticity, PA, and Fourier component b4 profiles of the fit isophotes (Figure A.2). The ellipticity and PA profiles strengthen the presence of two distinct components, while the values of b4 signify that the inner component is disky and the outer component has a mixed nature (discussed in Appendix A).
The LOS stellar kinematic maps also show promising evidence of two distinct structures in the galaxy. The VLOS/σLOS map shows a clear signature of rotation, which is stronger in the inner part (Figure 3). This is also clear in the radial VLOS/σLOS profile (Figure 4 – left panel), which shows a steeper gradient within the extent of the inner component. To further explore the kinematic nature of both components, we plot the VLOS/σLOS and h3 values of all the spaxels belonging to each respective component in Figure 4 (right panel). The spaxel part of the inner component (i.e., those within the solid black ellipse in Figure 3) shows a stronger trend of anticorrelation (Spearman coefficient = −0.75) between VLOS/σLOS and h3 (red points in Figure 4 – right panel), which is a signature of near-circular stellar orbits observed in a stable galaxy disk (Bender et al. 1994; Bittner et al. 2019; Gadotti et al. 2020). Though we see a disk-like rotating body in the central part, the LOS velocity dispersion is found to be higher within the same region (Figure 3). We employed a pseudo slit along the major axis of the inner component (Figure 3) and derived the radial velocity dispersion profile (Figure 4), which shows a central peak with average values reaching ∼240 km/s, which is around three times higher than the values observed in Cartwheel (Mondal & Barway 2024). Such velocity dispersion values with characteristic central peaks are more common in stellar bulges than normal disks (Fisher et al. 2016).
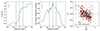 |
Fig. 4. VLOS/σLOS (left) and LOS velocity dispersion (middle) profiles, measured along the pseudo slit shown in Figure 3. The vertical dashed black lines in both panels mark the edge of the identified inner component on either side of the minor axis, which is shown in a dashed green line. The red points on the right panel show the VLOS/σLOS and h3 values of the spaxels enclosed within the extent of the identified inner component (as is shown by the ellipse in solid black line in Figure 3). The gray points represent spaxels located outside the inner component. The error bars shown in each panel represent the typical error values associated with each respective quantity. |
Therefore, the galaxy AM0644-741 hosts two components, of which the outer one plausibly represents an exponential disk with an effective radius of 4.4 kpc, whereas the central component of re ∼ 1 kpc shows a stronger rotational signature, disky isophotes (i.e., b4 > 0) along with a higher velocity dispersion. The stronger rotational support observed within the inner component could also indicate the central part of the compact stellar disk that the progenitor galaxy had before the encounter. Considering the predominance of older stellar populations of age ∼11 Gyr in the inner part (see discussion in Appendix C and Figure C.1), we infer that the detected rotating stellar structure was most likely formed in the progenitor galaxy and the stellar orbits within it have not been affected significantly due to the recent encounter that the galaxy AM0644-741 experienced around 133 Myr ago. From the presence of a smaller amount of massive star formation in AM0644-741 compared to the Cartwheel, Higdon & Wallin (1997) indicated that the progenitor of AM0644-741 had a thicker pre-collisional disk. This further justifies the existence of a post-collisional disk-like structure in the galaxy. In the case of the outer component, the weaker anticorrelation between V/σ and h3 and the presence of both boxy and disky isophotes (discussed in Appendix A) signify that the collision has impacted the stellar orbits in the outer part of the progenitor’s disk more strongly while forming the star-forming ring.
4.2. Characterizing the central region using optical emission and absorption lines
To improve our understanding of the central region, we explored the properties of identified emission and absorption lines in the MUSE optical spectrum. The integrated spectrum extracted from spaxels within the inner component shows the presence of Mg b absorption line (see Appendix D and Figure D.1). Following the method discussed in Kuntschner et al. (2006), we estimated the Mg b line index as 4.9 Å, which falls within the range typically seen in elliptical galaxies and/or classical bulges (Dressler et al. 1987; Ziegler & Bender 1997; Fisher et al. 2016). The stronger Mg b line index justifies the higher velocity dispersion observed in the inner region of the galaxy, suggesting the plausible emergence of a dynamically hotter central structure.
Wolter et al. (2019) reported the detection of an unresolved central source in X-ray with a luminosity ![Mathematical equation: $ L^{[0.5 {-} 10\,\mathrm{keV}]}_{\mathrm{X}} = 22.4\times 10^{39} $](/articles/aa/full_html/2025/06/aa51984-24/aa51984-24-eq8.gif) erg s−1, which is higher than the typical values observed in ultraluminous X-ray sources. We show the BPT measurement of the nuclear source in Figure D.1 (described in Appendix D), which indicates a low-ionization nuclear emission-line region (LINER) type ionization. This further justifies the absence of star formation and molecular gas in the nuclear region that was reported by Higdon et al. (2011). This is also true in general for CRGs, which show a reduction in ongoing star formation in the inner part (Romano et al. 2008; Elagali et al. 2018). Our measurements, combined with the nature of X-ray emission from the nuclear source, signify the presence of an active galactic nucleus (AGN) in the galaxy AM0644-741. Including the peculiar behavior noticed in stellar kinematics, the detection of AGN activity makes the inner part of the galaxy even more compelling. While the AGN could also have a pre-collisional origin, we speculate that the recent collision might have played a crucial role in triggering AGN activity and also in gearing up the stellar velocity dispersion in the central region of the galaxy.
erg s−1, which is higher than the typical values observed in ultraluminous X-ray sources. We show the BPT measurement of the nuclear source in Figure D.1 (described in Appendix D), which indicates a low-ionization nuclear emission-line region (LINER) type ionization. This further justifies the absence of star formation and molecular gas in the nuclear region that was reported by Higdon et al. (2011). This is also true in general for CRGs, which show a reduction in ongoing star formation in the inner part (Romano et al. 2008; Elagali et al. 2018). Our measurements, combined with the nature of X-ray emission from the nuclear source, signify the presence of an active galactic nucleus (AGN) in the galaxy AM0644-741. Including the peculiar behavior noticed in stellar kinematics, the detection of AGN activity makes the inner part of the galaxy even more compelling. While the AGN could also have a pre-collisional origin, we speculate that the recent collision might have played a crucial role in triggering AGN activity and also in gearing up the stellar velocity dispersion in the central region of the galaxy.
5. Conclusion
Our photometric and spectroscopic analysis of the galaxy AM0644-741 has identified two stellar structures of different properties. The inner component of re ∼ 1 kpc shows: disky isophotes (b4 > 0), strong stellar rotational support (VLOS/σLOS − h3 anticorrelation), a higher velocity dispersion with a central peak (σLOS ∼ 240 km sec−1), and a stronger Mg b line index. Combining all the evidence, we conclude that the central stellar structure in AM0644-741 has a peculiar dynamical state with reference to different known secularly built structures. While the observed trend of stellar rotation implies a minor impact of the recent collision on stellar orbits within the inner part, the elevated value of the velocity dispersion and the Mg b line index could also indicate some level of dynamical heating in the central region. The other component, with a difference of ∼60° in the PA, has a more disk-like shape (nb = 1.11) of re = 4.44 kpc. However, the isophote part of this extended component has both boxy and disky shapes along with weaker VLOS/σLOS − h3 anticorrelation, which plausibly suggests that the recent encounter have impacted the stellar orbits in the progenitor’s outer disk more strongly. The mass-weighted age of the stellar populations indicates that both these structures have a pre-collisional origin. Our study conveys that the dynamical evolution of post-collisional systems can be unique and needs more attention to explore with detailed simulations. We also identified a LINER-type ionization in the nuclear region through a BPT diagnostic plot. Though a low-luminosity AGN could have already existed in the progenitor galaxy, we speculate that the recent encounter might have enhanced AGN activity in the galaxy.
Acknowledgments
We thank the anonymous referee for valuable suggestions. This Letter made use of Matplotlib (Hunter 2007), Astropy (Astropy Collaboration 2013, 2018), and SAOImageDS9 (Joye & Mandel 2003). This work has used observations collected at the European Southern Observatory under ESO program 106.2155.001. This research has made use of the NASA/IPAC Extragalactic Database (NED), which is operated by the Jet Propulsion Laboratory, California Institute of Technology (Caltech), under contract with NASA. This research is based on observations made with the NASA/ESA Hubble Space Telescope obtained from the Space Telescope Science Institute. We are grateful to Adrian Bittner for his numerous suggestions, which helped us to understand the GIST pipeline used in this work.
References
- Antunes, A., & Wallin, J. 2007, ApJ, 670, 261 [Google Scholar]
- Appleton, P. N., & Marston, A. P. 1997, AJ, 113, 201 [NASA ADS] [CrossRef] [Google Scholar]
- Appleton, P. N., & Struck-Marcell, C. 1996, Fund. Cosmic Phys., 16, 111 [NASA ADS] [Google Scholar]
- Arp, H. C., & Madore, B. 1987, A Catalogue of Southern Peculiar Galaxies and Associations (Cambridge: Cambridge University Press) [Google Scholar]
- Astropy Collaboration (Robitaille, T. P., et al.) 2013, A&A, 558, A33 [NASA ADS] [CrossRef] [EDP Sciences] [Google Scholar]
- Astropy Collaboration (Price-Whelan, A. M., et al.) 2018, AJ, 156, 123 [Google Scholar]
- Athanassoula, E., Puerari, I., & Bosma, A. 1997, MNRAS, 286, 284 [NASA ADS] [CrossRef] [Google Scholar]
- Bacon, R., Accardo, M., Adjali, L., et al. 2010, in Ground-based and Airborne Instrumentation for Astronomy III, eds. I. S. McLean, S. K. Ramsay, & H. Takami, SPIE Conf. Ser., 7735, 773508 [Google Scholar]
- Barway, S., Mayya, Y. D., & Robleto-Orús, A. 2020, MNRAS, 497, 44 [NASA ADS] [CrossRef] [Google Scholar]
- Bender, R., Saglia, R. P., & Gerhard, O. E. 1994, MNRAS, 269, 785 [Google Scholar]
- Bittner, A., Falcón-Barroso, J., Nedelchev, B., et al. 2019, A&A, 628, A117 [NASA ADS] [CrossRef] [EDP Sciences] [Google Scholar]
- Bittner, A., de Lorenzo-Cáceres, A., Gadotti, D. A., et al. 2021, A&A, 646, A42 [NASA ADS] [CrossRef] [EDP Sciences] [Google Scholar]
- Bizyaev, D. V., Moiseev, A. V., & Vorobyov, E. I. 2007, ApJ, 662, 304 [Google Scholar]
- Cappellari, M. 2017, MNRAS, 466, 798 [Google Scholar]
- Cappellari, M., & Copin, Y. 2003, MNRAS, 342, 345 [Google Scholar]
- Cappellari, M., & Emsellem, E. 2004, PASP, 116, 138 [Google Scholar]
- Dressler, A., Lynden-Bell, D., Burstein, D., et al. 1987, ApJ, 313, 42 [Google Scholar]
- Elagali, A., Lagos, C. D. P., Wong, O. I., et al. 2018, MNRAS, 481, 2951 [NASA ADS] [CrossRef] [Google Scholar]
- Few, J. M. A., Madore, B. F., & Arp, H. C. 1982, MNRAS, 199, 633 [Google Scholar]
- Fisher, D. B., & Drory, N. 2016, in Galactic Bulges, eds. E. Laurikainen, R. Peletier, & D. Gadotti, Astrophysics and Space Science Library, 418, 41 [Google Scholar]
- Gadotti, D. A., Bittner, A., Falcón-Barroso, J., et al. 2020, A&A, 643, A14 [NASA ADS] [CrossRef] [EDP Sciences] [Google Scholar]
- Higdon, J. L., & Wallin, J. F. 1997, ApJ, 474, 686 [Google Scholar]
- Higdon, J. L., Higdon, S. J. U., & Rand, R. J. 2011, ApJ, 739, 97 [Google Scholar]
- Horellou, C., Casoli, F., Combes, F., & Dupraz, C. 1995, A&A, 298, 743 [NASA ADS] [Google Scholar]
- Hunter, J. D. 2007, Comput. Sci. Eng., 9, 90 [NASA ADS] [CrossRef] [Google Scholar]
- Jedrzejewski, R. I. 1987, MNRAS, 226, 747 [Google Scholar]
- Joye, W. A., & Mandel, E. 2003, in Astronomical Data Analysis Software and Systems XII, eds. H. E. Payne, R. I. Jedrzejewski, & R. N. Hook, ASP Conf. Ser., 295, 489 [NASA ADS] [Google Scholar]
- Kauffmann, G., Heckman, T. M., Tremonti, C., et al. 2003, MNRAS, 346, 1055 [Google Scholar]
- Kewley, L. J., Dopita, M. A., Sutherland, R. S., Heisler, C. A., & Trevena, J. 2001, ApJ, 556, 121 [Google Scholar]
- Korchagin, V., Mayya, Y. D., & Vorobyov, E. 2001, ApJ, 554, 281 [Google Scholar]
- Kuntschner, H., Emsellem, E., Bacon, R., et al. 2006, MNRAS, 369, 497 [NASA ADS] [CrossRef] [Google Scholar]
- Lynds, R., & Toomre, A. 1976, ApJ, 209, 382 [NASA ADS] [CrossRef] [Google Scholar]
- Marcum, P. M., Appleton, P. N., & Higdon, J. L. 1992, ApJ, 399, 57 [NASA ADS] [CrossRef] [Google Scholar]
- Marston, A. P., & Appleton, P. N. 1995, AJ, 109, 1002 [NASA ADS] [CrossRef] [Google Scholar]
- Mogotsi, K. M., & Romeo, A. B. 2019, MNRAS, 489, 3797 [Google Scholar]
- Mondal, C., & Barway, S. 2024, A&A, 681, A53 [NASA ADS] [CrossRef] [EDP Sciences] [Google Scholar]
- Oh, S., Colless, M., Barsanti, S., et al. 2020, MNRAS, 495, 4638 [Google Scholar]
- Pasha, I., van Dokkum, P. G., Liu, Q., et al. 2025, ApJ, 980, L3 [Google Scholar]
- Peng, C. Y., Ho, L. C., Impey, C. D., & Rix, H.-W. 2002, AJ, 124, 266 [Google Scholar]
- Renaud, F., Athanassoula, E., Amram, P., et al. 2018, MNRAS, 473, 585 [NASA ADS] [CrossRef] [Google Scholar]
- Romano, R., Mayya, Y. D., & Vorobyov, E. I. 2008, AJ, 136, 1259 [Google Scholar]
- Schawinski, K., Thomas, D., Sarzi, M., et al. 2007, MNRAS, 382, 1415 [Google Scholar]
- Theys, J. C., & Spiegel, E. A. 1976, ApJ, 208, 650 [NASA ADS] [CrossRef] [Google Scholar]
- Vazdekis, A., Sánchez-Blázquez, P., Falcón-Barroso, J., et al. 2010, MNRAS, 404, 1639 [NASA ADS] [Google Scholar]
- Wolter, A., Consolandi, G., Longhetti, M., Landoni, M., & Bianco, A. 2019, IAU Symp., 346, 297 [NASA ADS] [Google Scholar]
- Ziegler, B. L., & Bender, R. 1997, MNRAS, 291, 527 [NASA ADS] [CrossRef] [Google Scholar]
Appendix A: Additional photometric and kinematic analysis
In this appendix, we provide some relevant additional results to support our inferences presented in the Letter. In Figure 2, we have shown the surface brightness profile of the galaxy, derived using IRAF ELLIPSE task, from the HST F814W band observed and model (generated using GALFIT) images. However, to better visualize the GALFIT image decomposition, we show the 2D observed and model images along with the residual map in Figure A.1. The goodness of the fit can be seen from the overall small residuals. The filamentary vertical structure in the central region of the residual map originates due to the dust lanes, which can also be seen in the actual image of the galaxy.
We have shown the extent and projected shape of both detected components in the inset of Figure 2. However, to inspect the shape better, we further show the fit isophotal ellipses in Figure A.2 (top left) along with their ellipticity (top right), PA (bottom left), and Fourier coefficient b4 (bottom right) profiles. The ellipticity (i.e., 1 − b/a) and PA highlight the observed projected shape of the isophotes, whereas the value of b4 can infer the disky (b4 > 0) or boxy (b4 < 0) nature of the fit component (Jedrzejewski 1987). The ellipticity values of the isophotes, located within the extent of the inner component, overlap with the overall range (∼ 0.14 - 0.35) observed in the outer component, indicating no significant difference in the projected shape of both components. This also agrees with the similar axis ratio (i.e., b/a) values estimated for both Sérsic components (Table 1). However, the ellipticity profile does show a transition near the boundary of the inner component. We also notice a gradual change in the PA angle of the fit ellipses from center to outer part, reinforcing the presence of two distinct structures that we have detected using GALFIT. Interestingly, the majority of the isophotes within the inner component have positive b4 values, signifying their disky nature. The isophotes, around the boundary of the detected outer component, also have positive b4 values, indicating disky signature. However, the isophotes from the edge of the inner component up to  within the outer component show a boxy nature (i.e., b4< 0). The transition of b4, within the span of the outer component, could indicate the impact of the collision on the progenitor’s main disk, adding more peculiarity to post-collisional systems.
In Figure A.3, we have shown the LOS velocity and h4 velocity moment maps produced from the MUSE data cube. The rotational signature, discussed with reference to the VLOS/σLOS map (Figure 3), can also be seen in the LOS velocity map of the galaxy. The PA shift of the line of nodes from the inner to the outer part is also evident.
 |
Fig. A.1. The 2D images to highlight the GALFIT modeling of the detected components. The figure shows the observed HST F814W band image (left), model image (middle), and the residual map (right). |
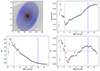 |
Fig. A.2. Results derived using the IRAF ELLIPSE package on the HST F814W band image of the galaxy. The fit ellipses are shown in blue on the HST F814W band image (top left). The ellipticity, PA, and the Fourier coefficient b4 of the fit ellipses with the length of their semi-major axes are shown in the top right, bottom left, and bottom right panels, respectively. The vertical red and blue dashed lines, shown in these three profiles, mark the extent of the detected inner and outer components, respectively. |
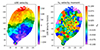 |
Fig. A.3. Stellar LOS velocity and h4 velocity moment maps of AM0644-741 for the same region as shown in Figure 3. The ellipses shown in solid and dashed black lines are also the same as displayed in Figure 3. |
Appendix B: Effect of Inclination angle
To understand the effect of inclination angle on the observed isophotes, we performed isophotal ellipse fitting analysis on the deprojected galaxy image. Using the observed orientation of the outer ring, Few et al. (1982) estimated an inclination angle of 57.2 degrees for AM0644-741. We derived the PA of the ring as 7.7 degrees from the HST image (as it is not provided by Few et al. (1982)). We also used the GALFIT measurements of the detected outer component from Table 1 and estimated inclination and PA as 49.4 and -26.5 degrees, respectively. Considering both these orientations, we deprojected the HST image using IRAF geotran and performed isophotal ellipse fitting. In both cases, we found the PA of the fit isophotes to show a gradual change of around 25 degrees from the edge of the inner component to the outer part. This exercise, therefore, confirms that though inclination angle has some effects on the projected shape of the isophotes, the photometric detection of two distinct components in our study is real and not a result of galaxy inclination.
Appendix C: Stellar population age
We have derived the mass-weighted age map of the galaxy’s stellar populations from the same MUSE IFU data using the GIST pipeline. GIST utilizes the regularized pPXF technique to fit the observed continuum using model templates and derive the best-fit age and metallicity of the underlying stellar populations for each Voronoi bin (Bittner et al. 2019). We have produced age maps considering four different orders of regularization by choosing REGUL_ERR as 0.10, 0.15, 0.30, and 0.45 (where regularization = 1/REGUL_ERR). The age map for REGUL_ERR = 0.15 (the value adopted throughout the analysis) is shown in Figure C.1. The average age profile along the pseudo slit (placed along the major axis of the inner component) is also shown in the same figure.
The mass-weighted age values show that the galaxy’s inner part is dominated by older stellar populations of age ∼11 Gyr. The structural components identified in the HST optical image, as well as in the MUSE stellar kinematic maps, represent these older populations whose formation has no connection with the recent collision. Therefore, we think the inner structure most likely has a pre-collisional origin and has survived the recent collision. We also note that an N-body dynamical simulation of the entire system would be ideal for understanding the evolution of such unique structural components in a CRG.
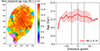 |
Fig. C.1. Mass-weighted age map of the stellar populations in AM0644-741 derived from the MUSE data using the GIST pipeline. The left panel shows the age map of the same region as displayed in Figure 3, estimated with a regularization error (RE) of 0.15. The solid red line on the right panel shows the average age values plotted along the pseudo slit as shown on the left panel. The shaded red region around the solid line highlights 1σ deviation on the age values estimated considering four different RE values (i.e., RE = 0.10, 0.15, 0.30, 0.45). |
Appendix D: Spectroscopic measurement of the central region
We placed a circular aperture of radius 1 2 (∼ seeing of the MUSE observation) and extracted the integrated MUSE spectrum (Figure D.1) from all the spaxels inside the aperture. We used lmfit module and derived continuum-subtracted line flux for [OIII] 5007 Å, [NII] 6583 Å, and Hα emission lines to construct the Baldwin, Phillips & Terlevich (BPT) diagnostic diagram (Figure D.1). As the Hβ line is not detected with a good SNR, we considered the continuum flux at λ = 4862 Å to derive an upper limit for [OIII] 5007/Hβ line ratio. In the case of Mg b 5176 line, we similarly extracted a spectrum integrated from all the spaxels within the identified inner component and estimated the line index following the method described in Kuntschner et al. (2006).
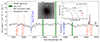 |
Fig. D.1. The Bluer half of the MUSE spectrum of the nuclear source is shown in gray. The signal is integrated from all the spaxels enclosed within the red circle, as shown in the inset image. The vertical red dashed lines mark four emission lines used to characterize the ionization type through a [NII] BPT diagram, which is also shown in the inset. We showed three diagnostic lines from Kauffmann et al. (2003) (solid), Kewley et al. (2001) (dashed), and Schawinski et al. (2007) (dotted) in the BPT diagram for characterizing our measurements. The vertical green shaded lines represent regions of known optical sky lines. Two prominent absorption lines, Mg b 5176 Å and Na I D 5895 Å, are marked by blue dashed lines. |
All Tables
All Figures
|
Fig. 1. MUSE white light image of the galaxy AM0644-741 constructed by combining frames between 4800 and 5800 Å from the IFU cube. The red and blue rectangles show the extent of the HST F814W band image and the MUSE data cube analyzed in this study, respectively. |
| In the text | |
|
Fig. 2. Surface brightness profiles derived using the IRAF ELLIPSE task from the HST F814W band observed and GALFIT model images. The black points denote the values derived from the observed image, whereas the profiles for the inner Sérsic, outer Sérsic, and the combined model are shown in dashed red, dashed blue, and solid black lines, respectively. In the inset, we show the HST image and the extent of both components in respective colors, considering values as specified in Table 1. The errors, shown for the observed surface brightness, were calculated from the root mean square scatter of the isophotal intensity. |
| In the text | |
|
Fig. 3. Stellar kinematic maps of AM0644-741 derived from the MUSE IFU data using the GIST pipeline. The figure shows stellar VLOS/σLOS (left), velocity dispersion (σLOS) (middle), and h3 velocity moment (right) maps of the inner part (i.e., the region within the blue rectangle shown in Figure 1). The ellipses shown in solid and dashed black lines represent the inner and outer Sérsic components identified in the HST optical image (Figure 2). The dashed black rectangle shows the pseudo slit that was used to derive the radial VLOS/σLOS and σLOS profiles (shown in Figure 4) along the major axis of the detected inner component. |
| In the text | |
|
Fig. 4. VLOS/σLOS (left) and LOS velocity dispersion (middle) profiles, measured along the pseudo slit shown in Figure 3. The vertical dashed black lines in both panels mark the edge of the identified inner component on either side of the minor axis, which is shown in a dashed green line. The red points on the right panel show the VLOS/σLOS and h3 values of the spaxels enclosed within the extent of the identified inner component (as is shown by the ellipse in solid black line in Figure 3). The gray points represent spaxels located outside the inner component. The error bars shown in each panel represent the typical error values associated with each respective quantity. |
| In the text | |
|
Fig. A.1. The 2D images to highlight the GALFIT modeling of the detected components. The figure shows the observed HST F814W band image (left), model image (middle), and the residual map (right). |
| In the text | |
|
Fig. A.2. Results derived using the IRAF ELLIPSE package on the HST F814W band image of the galaxy. The fit ellipses are shown in blue on the HST F814W band image (top left). The ellipticity, PA, and the Fourier coefficient b4 of the fit ellipses with the length of their semi-major axes are shown in the top right, bottom left, and bottom right panels, respectively. The vertical red and blue dashed lines, shown in these three profiles, mark the extent of the detected inner and outer components, respectively. |
| In the text | |
|
Fig. A.3. Stellar LOS velocity and h4 velocity moment maps of AM0644-741 for the same region as shown in Figure 3. The ellipses shown in solid and dashed black lines are also the same as displayed in Figure 3. |
| In the text | |
|
Fig. C.1. Mass-weighted age map of the stellar populations in AM0644-741 derived from the MUSE data using the GIST pipeline. The left panel shows the age map of the same region as displayed in Figure 3, estimated with a regularization error (RE) of 0.15. The solid red line on the right panel shows the average age values plotted along the pseudo slit as shown on the left panel. The shaded red region around the solid line highlights 1σ deviation on the age values estimated considering four different RE values (i.e., RE = 0.10, 0.15, 0.30, 0.45). |
| In the text | |
|
Fig. D.1. The Bluer half of the MUSE spectrum of the nuclear source is shown in gray. The signal is integrated from all the spaxels enclosed within the red circle, as shown in the inset image. The vertical red dashed lines mark four emission lines used to characterize the ionization type through a [NII] BPT diagram, which is also shown in the inset. We showed three diagnostic lines from Kauffmann et al. (2003) (solid), Kewley et al. (2001) (dashed), and Schawinski et al. (2007) (dotted) in the BPT diagram for characterizing our measurements. The vertical green shaded lines represent regions of known optical sky lines. Two prominent absorption lines, Mg b 5176 Å and Na I D 5895 Å, are marked by blue dashed lines. |
| In the text | |
Current usage metrics show cumulative count of Article Views (full-text article views including HTML views, PDF and ePub downloads, according to the available data) and Abstracts Views on Vision4Press platform.
Data correspond to usage on the plateform after 2015. The current usage metrics is available 48-96 hours after online publication and is updated daily on week days.
Initial download of the metrics may take a while.