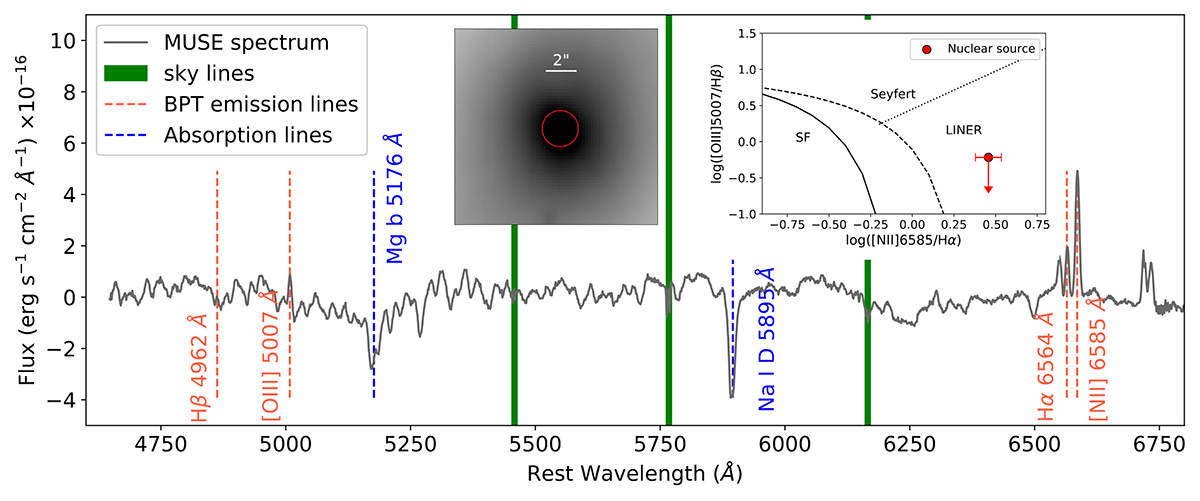
Fig. D.1.
Download original image
The Bluer half of the MUSE spectrum of the nuclear source is shown in gray. The signal is integrated from all the spaxels enclosed within the red circle, as shown in the inset image. The vertical red dashed lines mark four emission lines used to characterize the ionization type through a [NII] BPT diagram, which is also shown in the inset. We showed three diagnostic lines from Kauffmann et al. (2003) (solid), Kewley et al. (2001) (dashed), and Schawinski et al. (2007) (dotted) in the BPT diagram for characterizing our measurements. The vertical green shaded lines represent regions of known optical sky lines. Two prominent absorption lines, Mg b 5176 Å and Na I D 5895 Å, are marked by blue dashed lines.
Current usage metrics show cumulative count of Article Views (full-text article views including HTML views, PDF and ePub downloads, according to the available data) and Abstracts Views on Vision4Press platform.
Data correspond to usage on the plateform after 2015. The current usage metrics is available 48-96 hours after online publication and is updated daily on week days.
Initial download of the metrics may take a while.