| Issue |
A&A
Volume 681, January 2024
|
|
|---|---|---|
| Article Number | A53 | |
| Number of page(s) | 8 | |
| Section | Extragalactic astronomy | |
| DOI | https://doi.org/10.1051/0004-6361/202347560 | |
| Published online | 10 January 2024 | |
Unravelling the post-collision properties of the Cartwheel galaxy: A MUSE exploration of its bar and inner region
1
Inter-University Centre for Astronomy and Astrophysics, Ganeshkhind, Post Bag 4, Pune 411007, India
e-mail: This email address is being protected from spambots. You need JavaScript enabled to view it.
; This email address is being protected from spambots. You need JavaScript enabled to view it.
2
Indian Institute of Astrophysics, Koramangala II Block, Bangalore 560034, India
Received:
25
July
2023
Accepted:
27
September
2023
Abstract
Aims. We aim to investigate the characteristics of the bar and inner disc in the collisional ring galaxy Cartwheel.
Methods. We used integral field unit (IFU) observations from the Multi-Unit Spectroscopic Explorer (MUSE) of the Very Large Telescope (VLT) to investigate the stellar kinematics, age, and nature of ionised gas in the inner region of the Cartwheel galaxy. We produced stellar line of sight velocity (V), velocity dispersion (σ), h3 velocity moment, stellar population age, and emission-line maps of the galaxy using the Galaxy IFU Spectroscopy Tool (GIST) pipeline.
Results. The observed nature of the intensity, V, and σ profiles together support the existence of a stellar bar, as earlier revealed from near-infrared (NIR) Ks-band imaging. A weak correlation between V/σ and h3 is found within the bar radius, providing more kinematic evidence for a stellar bar that survived the drop-through collision. The overall weak anti-correlation between V/σ and h3 in the disc implies that the stellar orbits in the disc are less stable, which might be due to the impact of the collision. The mass-weighted age map of the galaxy shows that the stellar populations in the bar region are relatively old, with an increasing gradient from the bar edge to the centre, further evidence that the bar was present before the galaxy underwent collision. Using a BPT diagram, we analysed a central unresolved source detected earlier with NIR imaging and do not find evidence of an active galactic nucleus. Our findings signify the preservation of the pre-collisional structures in the inner region of the Cartwheel, an important point to note when attempting to determine the evolution of collisional galaxy systems, particularly when investigating pre-collisional central regions in theoretical studies.
Key words: galaxies: individual: Cartwheel or ESO 350–G040 / galaxies: structure / galaxies: kinematics and dynamics / galaxies: evolution / galaxies: stellar content
© The Authors 2024
 Open Access article, published by EDP Sciences, under the terms of the Creative Commons Attribution License (https://creativecommons.org/licenses/by/4.0), which permits unrestricted use, distribution, and reproduction in any medium, provided the original work is properly cited.
This article is published in open access under the Subscribe to Open model. This email address is being protected from spambots. You need JavaScript enabled to view it. to support open access publication.
1. Introduction
Stellar bars are extended linear structures frequently found in nearby disc galaxies, where they reshape bulges, regulate star formation, and drive the host galaxies’ transformation (Kormendy & Kennicutt 2004; Sakamoto et al. 1999; Ellison et al. 2011; Kim et al. 2016; Kruk et al. 2018; Donohoe-Keyes et al. 2019). Strong bars are found in more than 60% of the disc galaxies that dominate star formation in the local universe (Eskridge et al. 2000; Menéndez-Delmestre et al. 2007; Marinova & Jogee 2007). The stellar bar is a long-lived and robust structure; however, it is unknown when the first bar formed in disc galaxies. Many simulations show that bars are strong structures that are difficult to dissolve once formed (Athanassoula et al. 2005; Kraljic et al. 2012). So, in the absence of legitimate pieces of evidence and clues, determining whether the same bar still exists in present-day galaxies or if it has been dissolved and rejuvenated remains a complex problem (Bournaud & Combes 2002; Barway & Saha 2020).
Stellar bars are found across all environments and are more common in group and cluster environments, particularly for S0 galaxies (Barway et al. 2011). The evolution of bars in such environments is poorly studied, particularly in the case when a galaxy undergoes an interaction and/or collision. Recently, Barway et al. (2020) discovered a bar in the Cartwheel using near-infrared (NIR) Ks-band images, making it the first collisionally formed ring galaxy to have a bar detected. The Cartwheel is the archetype of collisional ring galaxies and was formed by a compact galaxy falling head-on through a massive gas-rich disc galaxy close to its centre and almost perpendicular to it (Lynds & Toomre 1976); it is distinguished by an outer ring that contains a chain of star-forming knots (Marston & Appleton 1995; Appleton & Marston 1997; Higdon et al. 2015).
The Cartwheel has a distinct inner ring that, unlike the outer ring, is gas-poor, with little H I (Higdon 1996), Hα (Amram et al. 1998), and star formation (Charmandaris & Mirabel 1997). The inner ring’s low star formation rate has cast doubt on its interpretation as a post-collisional structure, and it could equally well be of pre-collisional origin. Several studies have attempted to simulate the Cartwheel’s observed structure through a collision of two galaxies. Most of these have explored the nature of the outer ring and spokes in detail (Marcum et al. 1992; Appleton & Marston 1997; Renaud et al. 2018). Very few studies have used numerical simulations to understand the evolution of a pre-collisional bar or the inner disc’s orientation after the collision. A theoretical study by Athanassoula et al. (1997) using an N-body simulation to create the rings in galactic discs by infalling small companions attempted to address the abovementioned questions. The authors found that the bar survives the interaction and gradually grows fatter, eventually forming an oval structure. A small ring surrounds the bar and expands and detaches from it, forming an arm on one side.
Studies using Multi-Unit Spectroscopic Explorer (MUSE; Bacon et al. 2010) observations of the Very Large Telescope (VLT) also focus primarily on the outer ring of the Cartwheel galaxy (Zaragoza-Cardiel et al. 2022; Mayya et al. 2023). In this paper, we present a detailed analysis of the inner region of the Cartwheel galaxy using MUSE data, which cover the entire optical extent of the galaxy at the seeing-limited angular resolution of  . Utilising the MUSE integral field unit (IFU) data, we studied the kinematics and star formation history (SFH) of the inner part to explore the existence of a pre-discovered bar in the Cartwheel. We also probed the nature of ionised gas and the gas-phase metallicity of the same part using identified emission lines in the MUSE data. Our primary aims are to provide more evidence for the presence of a bar in this collisional ring galaxy and to understand the overall properties of its inner disc.
This article is organised as follows. Section 2 presents the photometric properties of the inner region. Section 3 describes the MUSE dataset, the detailed analysis is presented in Sect. 4, and the results are presented in Sect. 5. We summarise our conclusions in Sect. 6.
2. Photometric properties of the Cartwheel bar
In general, stellar bars are predominantly composed of older stellar populations. As a result, NIR observations, known to reveal structures that are not always visible in optical images, are frequently used to identify bars in galaxies. The NIR emission from older stars is less affected by dust extinction and the presence of younger stars (Cardelli et al. 1989; Riad et al. 2010). Utilising this property of NIR emission, Barway et al. (2020) reported the discovery of a stellar bar, a pseudo-bulge, and an unresolved point source in the archetype collisional ring galaxy Cartwheel through a careful morphological analysis of an excellent quality NIR Ks-band image from the European Southern Observatory (ESO) archive taken at the VLT-U1 telescope in the year 2000 using the Infrared Spectrometer And Array Camera (ISAAC) instrument. Due to a combination of its red colour and the presence of dusty features in the central region of the Cartwheel galaxy, the newly discovered bar is not recognisable in optical images, even with the spatial resolution of the Hubble Space Telescope (HST).
The Cartwheel’s stellar bar is oval-shaped, with a semi-major axis length (bar length) of 2.09 kpc and a nearly flat light distribution. The bulge is nearly circular, with an effective radius of 1.05 kpc and a Sersic index of 0.99, which are typical of late-type galaxies’ pseudo-bulges. Another important bar characteristic is the “strength” of the bar, which is 0.36 for the Cartwheel bar as determined by Barway et al. (2020), a value typically found in late-type spiral galaxies with a strong bar (Aguerri et al. 2009). To summarise, the Cartwheel’s stellar bar is a strong and robust structure that survived the collision and was unaffected by the impact. Collisional ring galaxies offer the opportunity to study a new, less explored aspect of bar evolution, and investigating kinematic details using MUSE will be critical in this respect.
3. MUSE IFS data
We used Integral Field Spectrograph (IFS) data of the Cartwheel observed with the MUSE instrument. MUSE is an optical IFS instrument installed on ESO’s VLT (Bacon et al. 2010). The instrument operates within the wavelength range 4750 Å to 9350 Å with a 1′ × 1′ almost square field of view. The detector has the capability of  spatial sampling and an average 1.25 Å spectral sampling. The galaxy Cartwheel was observed UT 24−25 August 2014 as part of MUSE’s science verification program (ID 60.A-9333). We obtained the science-ready MUSE deep data cube of the galaxy from the ESO archive science portal1 (archive ID ADP.2017-03-23T15:47:52.027). The deep cube has a sky coverage of 2.2 arcmin2 with a total integration time of 8400 s. During the observation, the effective seeing was
  . In Fig. 1 we show the 2D intensity map of the galaxy, constructed from the obtained deep cube, for the wavelength range 4800−5800 Å. The 2.2 sq. arcmin MUSE deep cube covers the entire galaxy, including the bright and distinct outer ring. In this work, we studied only the inner ∼20″ × 20″ part of the galaxy, as shown in the right panel of Fig. 1. We produced a smaller cutout of dimension 100 × 100 spaxels for the inner part from the larger deep cube and used that for further analysis. At the distance of the Cartwheel (which is 133 Mpc as per the NASA/IPAC Extragalactic Database2), each MUSE spaxel corresponds to a length scale of ∼130 pc in the galaxy frame. The MUSE intensity map of the galaxy’s inner part clearly shows a bright central component surrounded by another ring structure. Our cutout encloses the inner ring, including some parts of the spokes.
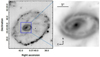 |
Fig. 1. MUSE image of the Cartwheel galaxy. Left: optical image of the Cartwheel ring galaxy extracted from the MUSE deep data cube for the wavelength range 4800−5800 Å. Right: zoomed-in view of the Cartwheel’s inner region (i.e. the part studied in this work), shown in the blue box of size 20″ × 20″ in the left panel. North is up, and east is to the left. |
4. Analysis of the MUSE cube
We used the Galaxy IFU Spectroscopy Tool (GIST) pipeline (version V3.0.2) developed by Bittner et al. (2019) to analyse the MUSE data cube. The pipeline is specifically designed to analyse reduced IFS data and has been successfully tested on several IFUs, including MUSE, PPAK (Calar Alto Legacy Integral Field spectroscopy Area – CALIFA), and the Spectrograph for INtegral Field Observations in the Near Infrared (SINFONI; Bittner et al. 2021, 2020; Yadav et al. 2021; Gadotti et al. 2020; Neumann et al. 2020; Eisenhauer et al. 2003). We used the penalised pixel-fitting (pPXF) module (Cappellari & Emsellem 2004; Cappellari 2017) of the pipeline to study the stellar kinematics of the galaxy. To apply the pPXF routine, we spatially binned the data using the Voronoi binning algorithm (Cappellari & Copin 2003). We fixed the targeted S/N to 30 for the binning, which allowed us to retain a good spatial resolution of the binned data. We calculated the S/N of each spaxel within the wavelength range 4800−5800 Å while performing the Voronoi binning. The spaxels with S/N greater than 30 remain unbinned, while those with S/N less than 3 were excluded and not considered in the binning. The integrated spectrum of each binned unit was then fitted with the MILES single stellar population model spectra (Vazdekis et al. 2010) combined with a line-of-sight velocity distribution (LOSVD) of the stellar populations. The LOSVD function is composed of four velocity parameters: the line-of-sight (LOS) velocity (V), velocity dispersion (σ), and h3 and h4 Gauss-Hermite moments. The fitting was performed for the continuum of the spectra in the wavelength range 4800−5800 Å. We adopted this wavelength range to avoid contamination from the redder wavelength part, as suggested by Bittner et al. (2019, 2021). We masked several prominent spectral lines that fall within the considered wavelength range while performing the fit. We also considered an eighth-order multiplicative Legendre polynomial during the fitting to account for small deviations between the model and the observed continuum shape. The best fit was obtained using a least-square minimisation technique. Following the fitting using pPXF, we obtained the values of the four parameters (V, σ, h3, and h4) for each bin. With the best-fit values, we constructed the spatial maps of V, σ, V/σ, and h3 for the inner part of the galaxy, as shown in Fig. 2. As we have studied only the inner part of the galaxy (Fig. 1) in this work, in the rest of this paper when we use the term “galaxy” we mean “the inner region”.
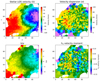 |
Fig. 2. Stellar kinematic maps of the Cartwheel. Top left: stellar LOS velocity (V) distribution for the inner region (shown by the blue rectangle in Fig. 1) of the Cartwheel produced using the GIST pipeline on the MUSE data cube. Ellipses shown in dashed and solid black lines indicate the bar and bulge of the galaxy, respectively, as reported in Barway et al. (2020). North is up, and east is to the left. The stellar velocity dispersion (σ; top right), V/σ (bottom left), and h3 velocity moment (bottom right) maps are also shown for the same part of the galaxy. |
In the LOS velocity map (Fig. 2, top left), we see that the north-western region of the galaxy has a blueshifted velocity, whereas the south-eastern part is redshifted. The velocity shown in the figure is measured in the rest frame of the galaxy. In the top-right panel of Fig. 2, we display the velocity dispersion map of the galaxy. The dispersion values mostly range between 40 and 80 km s−1. In the south-eastern part, in between the ring and the central disc, we notice a region with a high dispersion velocity (red bins). The average velocity dispersion in the eastern half is relatively high compared to the western half of the galaxy. Using these V and σ maps, we produced a map of the ratio of the LOS velocity to the velocity dispersion (i.e. V/σ) of the galaxy (bottom left). The values of V/σ mostly lie in the range ∼ − 2 to +2; for the bar region it ranges between ∼ − 1 and +1. In the bottom-right panel of Fig. 2, we show the h3 velocity moment of the galaxy. We find that the values of h3 are mostly in the range −0.15 to 0.10, with a slightly lopsided distribution in the central region with respect to the zero velocity line seen in the LOS velocity map. For each kinematic parameter, we note the typical formal error that arises from the pPXF fitting. The error in the estimated LOS velocity ranges between ∼5 and 12 km s−1, whereas the mean error in the velocity dispersion is around 12 km s−1. The error in h3 ranges between ∼0.05 and 0.18, with a median value of ∼0.12. For spaxels belonging to the bar, the error in h3 is relatively small, with a range of ∼0.05 to 0.11 and a median value of ∼0.08. We note here that the formal errors in the derived V, σ, and h3 values in the Cartwheel are slightly higher compared to the nearby systems that have a better sampling on physical scales with MUSE.
5. Results
5.1. Kinematic signatures of the bar
The LOS stellar velocity map of the Cartwheel exhibits a rotating disc in the inner part (Fig. 2, top left). We notice a smooth velocity gradient on both sides of the rotation axis, which signifies that the central disc and the prominent ring structure are kinematically coupled. The kinematic maps derived from the MUSE data in this study show promising signs of an existing bar. Using simulations, Bureau & Athanassoula (2005) discussed multiple kinematic features of a bar in an edge-on disc galaxy. As the disc of the Cartwheel is moderately inclined (i ∼ 50°; Amram et al. 1998), we examined such features for the Cartwheel in our study. We used the measured bar semi-major and semi-minor axes and the position angle from Barway et al. (2020; as discussed in Sect. 2) and show the bar in Fig. 2 (top left) along with the pseudo-bulge. Considering a rectangular pseudo-slit (as shown on the intensity map in Fig. 3), we derived profiles for the intensity, LOS velocity, and velocity dispersion along the slit length. The width of the pseudo-slit is taken as 2b ∼18 pixels (i.e. two times the size of the bar’s minor axis), and the length is fixed up to the extent of the inner disc. We used a step size of 2 pixels along the slit to define multiple rectangular apertures, as shown in the figure. Each rectangular aperture has a size of 2 × 18 pixels. We estimated the average value of intensity, LOS velocity, and velocity dispersion in all these apertures and plot them along the length of the slit in Fig. 3.
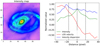 |
Fig. 3. Intensity, LOS velocity, and velocity dispersion profiles of the Cartwheel’s bar. Left: intensity map for the inner region of the Cartwheel. The extent of the bar and bulge are shown by ellipses, as in Fig. 2. Right: intensity, LOS velocity, and velocity dispersion profiles along the grey rectangular pseudo-slit shown in the left panel. The vertical dashed black line at the centre signifies the position of the minor axis, whereas those on either side highlight the bar ends. |
We notice an exponential intensity profile within the bar length and a plateau outside it. The LOS velocity profile shows a sharp rise within the bar region, where intensity increases rapidly. Both these features are described as signatures of a bar in the simulation study by Bureau & Athanassoula (2005). The velocity dispersion profile is flat in the centre with a secondary peak on one side of the bar end. The simulation by Bureau & Athanassoula (2005) shows a central dip in the velocity dispersion profile if there is no bar in the galaxy. A galaxy with a bar shows a broader peak of different natures depending on the strength and viewing angle. The Cartwheel’s flatter profile (with a weak peak) signifies that the galaxy hosts not only a disc but also an additional dynamical structure that gives rise to the observed velocity dispersion profile. This could also signify the presence of a bar. Therefore, the kinematic features combined with the intensity profile presented in our study support the existence of a bar in this collisional ring galaxy. We note here that Iannuzzi & Athanassoula (2015), who utilised an upgraded set of dynamical simulations of idealised disc galaxies with different initial gas fractions, attempted to generate 2D kinematic features in LOS velocity, σ, h3, and h4 of boxy or peanut structures. Their resulting 2D kinematic maps show similar features, as discussed using 1D profiles in Bureau & Athanassoula (2005). This further strengthens our interpretation, based on the 1D simulated profiles reported in Bureau & Athanassoula (2005), that there is a bar in the Cartwheel.
To gather more kinematic evidence in support of the bar’s existence, we used the V/σ and h3 maps shown in Fig. 2 and plot their values for all the constructed bins of the galaxy in Fig. 4. Each point in Fig. 4 corresponds to the measured values of V/σ and h3 for a particular Voronoi bin. Several studies have conveyed that for near-circular stellar orbits in a stable rotating disc, there is an anti-correlation between LOS velocity and h3 moments, whereas there is a correlation between V/σ and h3 for eccentric stellar orbits, which is unlikely for a stable disc (Bender et al. 1994; Bureau & Athanassoula 2005; Gadotti et al. 2015, 2020; Bittner et al. 2019). A clear correlation between V and h3 is reported by Gadotti et al. (2020) for most of the galaxies studied as part of the Time Inference with MUSE in Extragalactic Rings (TIMER) project (Gadotti et al. 2019), though in some cases the correlation is less clear. As each of the TIMER galaxies is known to have a bar, several factors might explain the samples that show a less clear correlation, including the galaxy inclination, dust extinction, or poorer spatial resolution on physical scales (Gadotti et al. 2020). In the case of the Cartwheel, though the V/σ − h3 values do not show a tight correlation or anti-correlation for the entire galaxy, we notice that the bar region alone (red points in Fig. 4) shows a better correlation trend. We estimated the values of the Spearman correlation coefficient for the bar (red points) and the inner region outside the bar (grey points) to be 0.25 and 0.21, respectively, suggesting a weak correlation in both cases. Considering a moderately higher inclination angle and a relatively large distance to the galaxy, the weak correlation seen in the bar region is further evidence for the existence of a stellar bar in the Cartwheel. The nature of correlation for the inner part of the Cartwheel outside the bar region (in Fig. 4) therefore hints at a post-collisional disc with less-ordered stellar orbits. The impact of the collision might have produced this anomaly. Besides showing a weak correlation for the bar region in the Cartwheel, the V/σ values match with the typical value of a bar as reported in Guérou et al. (2016). Hence, our results present more kinematic evidence for the presence of a bar in the Cartwheel, in addition to evidence of Cartwheel hosting a disturbed disc.
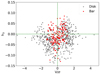 |
Fig. 4. Measured V/σ and h3 of each Voronoi bin for the inner region of the Cartwheel. The grey dots denote the bins that are part of the disc, while the bins belonging to the bar (i.e. those within the dotted ellipse shown in Fig. 2) are shown in red. |
5.2. Nature of ionised gas
Barway et al. (2020) report the detection of an unresolved point source in the NIR Ks-band image of the Cartwheel using the GALFIT (Peng et al. 2002) 2D decomposition code. The presence of an unresolved point source in the NIR Ks band has motivated us to investigate the possible presence of a low-luminosity active galactic nucleus (AGN) in the galaxy. The pipeline GIST uses the Gandalf procedure (Sarzi et al. 2006; Falcón-Barroso et al. 2006) to measure the emission-line fluxes. We used the emission-line flux map derived from the MUSE data cube to plot the log([O III]5007/Hβ) versus log([N II]6583/Hα) Baldwin, Phillips, and Terlevich (BPT) diagram shown in Fig. 5. The ratio of these emission lines is measured for each bin and shown in the left panel of the figure. Using the amplitude-to-noise ratio of each emission line from the GIST output, we also estimated the average uncertainties associated with each of the four different ionisation types and show them in the same figure. The characteristic lines that demarcate different natures of ionisation of the BPT plot shown in Fig. 5 are taken from the studies of Kewley et al. (2001), Kauffmann et al. (2003), and Schawinski et al. (2007). In the right panel of the same figure, we show the corresponding spatial map of the BPT diagram. A similar representation of the galaxy’s BPT map using MUSE data has also been presented by Gadotti et al. (2019) and Lagos et al. (2022). The central spaxels, contained within the size of the MUSE seeing full width at half maximum, are also shown in the BPT diagram. This signifies that the ionisation in the centre of the galaxy is related to star formation and that the presence of an AGN in the system is unlikely. However, Struck et al. (1996), using the HST WFPC2 imaging in the F450W and F814W bands, showed a network of obscuring dust lanes in the central region of the Cartwheel. It is possible that emission from the accretion disc is not directly detected due to the absorption and/or scattering along the observer’s LOS. New observations of the Cartwheel from the NIRCAM and NIRSpec instruments on board the James Webb Space Telescope (JWST) will help us more thoroughly to probe the nature of the central point source and determine whether there is an AGN in the Cartwheel. We plan to carry out a follow-up study of the NIR characteristics of the central region using the higher-resolution JWST observations.
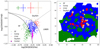 |
Fig. 5. [N II] BPT diagram of the inner region of the Cartwheel. Each point plotted in the left panel corresponds to the MUSE data cube’s single spaxel. Four different colours signify regions of four different ionisation origins of the conventional BPT diagram: green is for star-forming (SF); blue is for composite; red is for low-ionization nuclear emission-line regions (LINER); and grey is for Seyfert. The magenta points represent spaxels inside the small white circle shown in the right panel at the Cartwheel centre. The error bars shown in different colors (left panel) signify the average uncertainty associated with the measurements of each respective ionisation type. The values and the associated uncertainties for each spaxel encompassed by the central white circle (shown in the right panel) are displayed in magenta. The spatial distribution of these points on the Cartwheel is shown in the same corresponding colour in the right panel. The characteristic lines of the BPT diagram shown on the left are taken from Kauffmann et al. (2003, solid), Kewley et al. (2001, dashed), and Schawinski et al. (2007, dotted). We also show the extent of the bar and bulge in the right panel, as in Fig. 2. |
5.3. Star formation history
The stellar bar and the pseudo-bulge that survived a drop-through collision most likely belonged to the pre-collisional progenitor of the Cartwheel. A detailed investigation of the stellar population age can give us more insight into the inner region of the Cartwheel. Using the SFH module of GIST, we extracted the mass-weighted age map of the galaxy and show it in Fig. 6. The SFH module applies the regularised pPXF technique (Cappellari & Copin 2003) to fit the observed emission-line-subtracted continuum with the model templates. We fixed the input parameter REGUL_ERR to 0.15 (where regularisation = 1/REGUL_ERR), as suggested in Bittner et al. (2020) and de Sá-Freitas et al. (2023), to constrain the strength of the regularisation. For the fitting, we limited the wavelength range to between 4800 and 6800 Å. Several emission lines were masked using the default list supplied in GIST during the fitting (Bittner et al. 2019). We also incorporated an eighth-order multiplicative Legendre polynomial to compensate for the deviation of the continuum between observed and model spectra. The mass-weighted age map shown in Fig. 6 highlights that the stellar populations in the central region are older (with ages of ∼12 Gyr) than those around them. We placed a pseudo-slit (same as Fig. 3) on the age map and derived the average mass-weighted age profile along the slit length. The older age of the stellar population in the inner region, particularly within the bar, confirms the pre-collisional origin of the structure and that it survived the collision. As the stellar population age derived using GIST’s SFH module is sensitive to the choice of REGUL_ERR parameter (Bittner et al. 2019; de Sá-Freitas et al. 2023), we generated the age map for another three values of regularisation (i.e. REGUL_ERR = 0.45, 1.0, and 5.0). We calculated the mean variation of the age values in the age profile and show it in Fig. 6. The mean age difference calculated for the entire age profile is found to be ∼1.5 Gyr. The mass-weighted age of the stellar populations in the bar is constrained to within ∼9−13 Gyr, which signifies a pre-collisional origin for the bar in the Cartwheel.
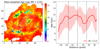 |
Fig. 6. Spatial mass-weighted age map for the inner region of the Cartwheel. The age map is derived from the binned MUSE cube for REGUL_ERR (RE) = 0.15. The extent of the bar is shown with a black ellipse. Right: age profile plotted along the rectangular slit (dotted white lines) shown in the left panel. The vertical dashed black line at the centre signifies the position of the minor axis, whereas those on either side highlight the bar ends. The red shaded region shows the mean difference of the derived age values as estimated from four different regularisations (i.e. RE = 0.15, 0.45, 1.0, and 5.0). The value of the mean age difference for the entire profile is ∼1.5 Gyr. The age of the stellar populations in the bar is constrained to within ∼9−13 Gyr. |
We further explored the gas-phase metallicity in the inner region of the Cartwheel. Pettini & Pagel (2004) modelled an empirical relation to estimate the oxygen abundance from the measured value of the [N II]6583/Hα emission-line ratio for distant galaxies. To understand the gas-phase metallicity, we used the [N II]6583/Hα measurements from MUSE data and estimated the 12 + log(O/H) value for each spaxel using Eq. (1) of Pettini & Pagel (2004). We find that the gas in the central region of the Cartwheel is relatively metal-rich, with 12 + log(O/H) values higher than 9.0. Wolter et al. (2019) also report a super-solar metallicity for the inner region of the Cartwheel. The presence of metal-rich gas in the central region of the galaxy signifies an early enrichment scenario that must have started before the collision.
6. Summary
In this work we have used the MUSE IFU data to study stellar kinematics, the SFH, and the nature of ionised gas in the inner region of the Cartwheel, which is an ideal laboratory for testing the pre- and post-collisional structure. Using the GIST pipeline, we produced stellar LOS velocity, velocity dispersion, h3 velocity moment, mass-weighted age, and emission-line maps for the inner region of the Cartwheel. The main results of the study are as follows:
-
The intensity, LOS velocity, and velocity dispersion profiles of the Cartwheel individually show characteristic signatures of a bar, as reported in the simulation study by Bureau & Athanassoula (2005);
-
We find a trend of weak correlations between V/σ and h3 for the bar region, which further supports the presence of a bar in the galaxy. The kinematic signature of the bar signifies that the past encounter of the Cartwheel, which resulted in the formation of a ring structure in the system, has not affected the stellar bar to the extent of destroying it;
-
For the inner part of the Cartwheel outside the bar region, we noticed no specific trend of anti-correlation between V/σ and h3. This indicates that the collision has affected the stable ordered motion of stars in the inner disc of the galaxy;
-
We produced a BPT map and show that the ionisation in the galaxy’s central region is possibly due to star formation and that the presence of an AGN is unlikely. However, given the dust in the inner region, the higher-resolution JWST NIR observations are better suited to probe the nature of the central source, which we plan to do in the future;
-
The stellar populations within the bar are found to be older, with the mass-weighted age constrained between ∼9 and 13 Gyr. Such older populations in the bar lend support to its pre-collisional existence, which signifies that the bar was already in place when the Cartwheel underwent the collision.
In this work, we have addressed whether the bar in the Cartwheel was pre-existing or formed after the collision by studying the stellar populations in the bar region, using integral field spectroscopy data from MUSE. Our finding suggests that the central structures existed before the collision, impetus to include inner regions, such as bars, in future numerical and theoretical studies of collisional ring galaxies. Given the amount of dusty structure, the JWST in the NIR wavelengths would be ideal for studying the inner region. Thus, collisional ring galaxies provide opportunities to learn about a new, less explored aspect of the evolution of the inner region, both observationally and theoretically, which survived the collision and remained unaffected by the impact.
Acknowledgments
We thank the anonymous referee for valuable suggestions. This paper has used the observations collected at the European Southern Observatory under ESO program 60.A-9333. This research has made use of the NASA/IPAC Extragalactic Database (NED), which is operated by the Jet Propulsion Laboratory, California Institute of Technology (Caltech), under contract with NASA. We are grateful to Adrian Bittner for his numerous suggestions which helped us to understand the GIST pipeline used in this work. This research made use of Matplotlib (Hunter 2007), Astropy (Astropy Collaboration 2013, 2018), community-developed core Python packages for Astronomy, and SAOImageDS9 (Joye & Mandel 2003).
References
- Aguerri, J. A. L., Méndez-Abreu, J., & Corsini, E. M. 2009, A&A, 495, 491 [NASA ADS] [CrossRef] [EDP Sciences] [Google Scholar]
- Amram, P., Mendes de Oliveira, C., Boulesteix, J., & Balkowski, C. 1998, A&A, 330, 881 [NASA ADS] [Google Scholar]
- Appleton, P. N., & Marston, A. P. 1997, AJ, 113, 201 [NASA ADS] [CrossRef] [Google Scholar]
- Astropy Collaboration (Robitaille, T. P., et al.) 2013, A&A, 558, A33 [NASA ADS] [CrossRef] [EDP Sciences] [Google Scholar]
- Astropy Collaboration (Price-Whelan, A. M., et al.) 2018, AJ, 156, 123 [Google Scholar]
- Athanassoula, E., Puerari, I., & Bosma, A. 1997, MNRAS, 286, 284 [NASA ADS] [CrossRef] [Google Scholar]
- Athanassoula, E., Lambert, J. C., & Dehnen, W. 2005, MNRAS, 363, 496 [Google Scholar]
- Bacon, R., Accardo, M., Adjali, L., et al. 2010, in Ground-based and Airborne Instrumentation for Astronomy III, eds. I. S. McLean, S. K. Ramsay, & H. Takami, SPIE Conf. Ser., 7735, 773508 [Google Scholar]
- Barway, S., & Saha, K. 2020, MNRAS, 495, 4548 [NASA ADS] [CrossRef] [Google Scholar]
- Barway, S., Wadadekar, Y., & Kembhavi, A. K. 2011, MNRAS, 410, L18 [NASA ADS] [CrossRef] [Google Scholar]
- Barway, S., Mayya, Y. D., & Robleto-Orús, A. 2020, MNRAS, 497, 44 [NASA ADS] [CrossRef] [Google Scholar]
- Bender, R., Saglia, R. P., & Gerhard, O. E. 1994, MNRAS, 269, 785 [Google Scholar]
- Bittner, A., Falcón-Barroso, J., Nedelchev, B., et al. 2019, A&A, 628, A117 [NASA ADS] [CrossRef] [EDP Sciences] [Google Scholar]
- Bittner, A., Sánchez-Blázquez, P., Gadotti, D. A., et al. 2020, A&A, 643, A65 [NASA ADS] [CrossRef] [EDP Sciences] [Google Scholar]
- Bittner, A., de Lorenzo-Cáceres, A., Gadotti, D. A., et al. 2021, A&A, 646, A42 [NASA ADS] [CrossRef] [EDP Sciences] [Google Scholar]
- Bournaud, F., & Combes, F. 2002, A&A, 392, 83 [NASA ADS] [CrossRef] [EDP Sciences] [Google Scholar]
- Bureau, M., & Athanassoula, E. 2005, ApJ, 626, 159 [Google Scholar]
- Cappellari, M. 2017, MNRAS, 466, 798 [Google Scholar]
- Cappellari, M., & Copin, Y. 2003, MNRAS, 342, 345 [Google Scholar]
- Cappellari, M., & Emsellem, E. 2004, PASP, 116, 138 [Google Scholar]
- Cardelli, J. A., Clayton, G. C., & Mathis, J. S. 1989, ApJ, 345, 245 [Google Scholar]
- Charmandaris, V., & Mirabel, F. 1997, in Joint European and National Astronomical Meeting, eds. J. D. Hadjidemetrioy, & J. H. Seiradakis, 185 [Google Scholar]
- de Sá-Freitas, C., Fragkoudi, F., Gadotti, D. A., et al. 2023, A&A, 671, A8 [NASA ADS] [CrossRef] [EDP Sciences] [Google Scholar]
- Donohoe-Keyes, C. E., Martig, M., James, P. A., & Kraljic, K. 2019, MNRAS, 489, 4992 [Google Scholar]
- Eisenhauer, F., Abuter, R., Bickert, K., et al. 2003, in Instrument Design and Performance for Optical/Infrared Ground-based Telescopes, eds. M. Iye, & A. F. M. Moorwood, SPIE Conf. Ser., 4841, 1548 [Google Scholar]
- Ellison, S. L., Nair, P., Patton, D. R., et al. 2011, MNRAS, 416, 2182 [NASA ADS] [CrossRef] [Google Scholar]
- Eskridge, P. B., Frogel, J. A., Pogge, R. W., et al. 2000, AJ, 119, 536 [NASA ADS] [CrossRef] [Google Scholar]
- Falcón-Barroso, J., Bacon, R., Bureau, M., et al. 2006, MNRAS, 369, 529 [Google Scholar]
- Gadotti, D. A., Seidel, M. K., Sánchez-Blázquez, P., et al. 2015, A&A, 584, A90 [NASA ADS] [CrossRef] [EDP Sciences] [Google Scholar]
- Gadotti, D. A., Sánchez-Blázquez, P., Falcón-Barroso, J., et al. 2019, MNRAS, 482, 506 [Google Scholar]
- Gadotti, D. A., Bittner, A., Falcón-Barroso, J., et al. 2020, A&A, 643, A14 [NASA ADS] [CrossRef] [EDP Sciences] [Google Scholar]
- Guérou, A., Emsellem, E., Krajnović, D., et al. 2016, A&A, 591, A143 [NASA ADS] [CrossRef] [EDP Sciences] [Google Scholar]
- Higdon, J. L. 1996, ApJ, 467, 241 [NASA ADS] [CrossRef] [Google Scholar]
- Higdon, J. L., Higdon, S. J. U., Martín Ruiz, S., & Rand, R. J. 2015, ApJ, 814, L1 [NASA ADS] [CrossRef] [Google Scholar]
- Hunter, J. D. 2007, Comput. Sci. Eng., 9, 90 [NASA ADS] [CrossRef] [Google Scholar]
- Iannuzzi, F., & Athanassoula, E. 2015, MNRAS, 450, 2514 [Google Scholar]
- Joye, W. A., & Mandel, E. 2003, in Astronomical Data Analysis Software and Systems XII, eds. H. E. Payne, R. I. Jedrzejewski, & R. N. Hook, ASP Conf. Ser., 295, 489 [NASA ADS] [Google Scholar]
- Kauffmann, G., Heckman, T. M., Tremonti, C., et al. 2003, MNRAS, 346, 1055 [Google Scholar]
- Kewley, L. J., Dopita, M. A., Sutherland, R. S., Heisler, C. A., & Trevena, J. 2001, ApJ, 556, 121 [Google Scholar]
- Kim, T., Gadotti, D. A., Athanassoula, E., et al. 2016, MNRAS, 462, 3430 [Google Scholar]
- Kormendy, J., & Kennicutt, R. C. Jr. 2004, ARA&A, 42, 603 [NASA ADS] [CrossRef] [Google Scholar]
- Kraljic, K., Bournaud, F., & Martig, M. 2012, ApJ, 757, 60 [Google Scholar]
- Kruk, S. J., Lintott, C. J., Bamford, S. P., et al. 2018, MNRAS, 473, 4731 [Google Scholar]
- Lagos, P., Loubser, S. I., Scott, T. C., et al. 2022, MNRAS, 516, 5487 [NASA ADS] [CrossRef] [Google Scholar]
- Lynds, R., & Toomre, A. 1976, ApJ, 209, 382 [NASA ADS] [CrossRef] [Google Scholar]
- Marcum, P. M., Appleton, P. N., & Higdon, J. L. 1992, ApJ, 399, 57 [NASA ADS] [CrossRef] [Google Scholar]
- Marinova, I., & Jogee, S. 2007, ApJ, 659, 1176 [Google Scholar]
- Marston, A. P., & Appleton, P. N. 1995, AJ, 109, 1002 [NASA ADS] [CrossRef] [Google Scholar]
- Mayya, Y. D., Plat, A., Gómez-González, V. M. A., et al. 2023, MNRAS, 519, 5492 [NASA ADS] [CrossRef] [Google Scholar]
- Menéndez-Delmestre, K., Sheth, K., Schinnerer, E., Jarrett, T. H., & Scoville, N. Z. 2007, ApJ, 657, 790 [Google Scholar]
- Neumann, J., Fragkoudi, F., Pérez, I., et al. 2020, A&A, 637, A56 [NASA ADS] [CrossRef] [EDP Sciences] [Google Scholar]
- Peng, C. Y., Ho, L. C., Impey, C. D., & Rix, H.-W. 2002, AJ, 124, 266 [Google Scholar]
- Pettini, M., & Pagel, B. E. J. 2004, MNRAS, 348, L59 [NASA ADS] [CrossRef] [Google Scholar]
- Renaud, F., Athanassoula, E., Amram, P., et al. 2018, MNRAS, 473, 585 [NASA ADS] [CrossRef] [Google Scholar]
- Riad, I. F., Kraan-Korteweg, R. C., & Woudt, P. A. 2010, MNRAS, 401, 924 [NASA ADS] [CrossRef] [Google Scholar]
- Sakamoto, K., Okumura, S. K., Ishizuki, S., & Scoville, N. Z. 1999, ApJ, 525, 691 [NASA ADS] [CrossRef] [Google Scholar]
- Sarzi, M., Falcón-Barroso, J., Davies, R. L., et al. 2006, MNRAS, 366, 1151 [Google Scholar]
- Schawinski, K., Thomas, D., Sarzi, M., et al. 2007, MNRAS, 382, 1415 [Google Scholar]
- Struck, C., Appleton, P. N., Borne, K. D., & Lucas, R. A. 1996, AJ, 112, 1868 [Google Scholar]
- Vazdekis, A., Sánchez-Blázquez, P., Falcón-Barroso, J., et al. 2010, MNRAS, 404, 1639 [NASA ADS] [Google Scholar]
- Wolter, A., Consolandi, G., Longhetti, M., Landoni, M., & Bianco, A. 2019, IAU Symp., 346, 297 [NASA ADS] [Google Scholar]
- Yadav, J., Das, M., Barway, S., & Combes, F. 2021, A&A, 651, L9 [NASA ADS] [CrossRef] [EDP Sciences] [Google Scholar]
- Zaragoza-Cardiel, J., Gómez-González, V. M. A., Mayya, D., & Ramos-Larios, G. 2022, MNRAS, 514, 1689 [NASA ADS] [CrossRef] [Google Scholar]
All Figures
|
Fig. 1. MUSE image of the Cartwheel galaxy. Left: optical image of the Cartwheel ring galaxy extracted from the MUSE deep data cube for the wavelength range 4800−5800 Å. Right: zoomed-in view of the Cartwheel’s inner region (i.e. the part studied in this work), shown in the blue box of size 20″ × 20″ in the left panel. North is up, and east is to the left. |
| In the text | |
|
Fig. 2. Stellar kinematic maps of the Cartwheel. Top left: stellar LOS velocity (V) distribution for the inner region (shown by the blue rectangle in Fig. 1) of the Cartwheel produced using the GIST pipeline on the MUSE data cube. Ellipses shown in dashed and solid black lines indicate the bar and bulge of the galaxy, respectively, as reported in Barway et al. (2020). North is up, and east is to the left. The stellar velocity dispersion (σ; top right), V/σ (bottom left), and h3 velocity moment (bottom right) maps are also shown for the same part of the galaxy. |
| In the text | |
|
Fig. 3. Intensity, LOS velocity, and velocity dispersion profiles of the Cartwheel’s bar. Left: intensity map for the inner region of the Cartwheel. The extent of the bar and bulge are shown by ellipses, as in Fig. 2. Right: intensity, LOS velocity, and velocity dispersion profiles along the grey rectangular pseudo-slit shown in the left panel. The vertical dashed black line at the centre signifies the position of the minor axis, whereas those on either side highlight the bar ends. |
| In the text | |
|
Fig. 4. Measured V/σ and h3 of each Voronoi bin for the inner region of the Cartwheel. The grey dots denote the bins that are part of the disc, while the bins belonging to the bar (i.e. those within the dotted ellipse shown in Fig. 2) are shown in red. |
| In the text | |
|
Fig. 5. [N II] BPT diagram of the inner region of the Cartwheel. Each point plotted in the left panel corresponds to the MUSE data cube’s single spaxel. Four different colours signify regions of four different ionisation origins of the conventional BPT diagram: green is for star-forming (SF); blue is for composite; red is for low-ionization nuclear emission-line regions (LINER); and grey is for Seyfert. The magenta points represent spaxels inside the small white circle shown in the right panel at the Cartwheel centre. The error bars shown in different colors (left panel) signify the average uncertainty associated with the measurements of each respective ionisation type. The values and the associated uncertainties for each spaxel encompassed by the central white circle (shown in the right panel) are displayed in magenta. The spatial distribution of these points on the Cartwheel is shown in the same corresponding colour in the right panel. The characteristic lines of the BPT diagram shown on the left are taken from Kauffmann et al. (2003, solid), Kewley et al. (2001, dashed), and Schawinski et al. (2007, dotted). We also show the extent of the bar and bulge in the right panel, as in Fig. 2. |
| In the text | |
|
Fig. 6. Spatial mass-weighted age map for the inner region of the Cartwheel. The age map is derived from the binned MUSE cube for REGUL_ERR (RE) = 0.15. The extent of the bar is shown with a black ellipse. Right: age profile plotted along the rectangular slit (dotted white lines) shown in the left panel. The vertical dashed black line at the centre signifies the position of the minor axis, whereas those on either side highlight the bar ends. The red shaded region shows the mean difference of the derived age values as estimated from four different regularisations (i.e. RE = 0.15, 0.45, 1.0, and 5.0). The value of the mean age difference for the entire profile is ∼1.5 Gyr. The age of the stellar populations in the bar is constrained to within ∼9−13 Gyr. |
| In the text | |
Current usage metrics show cumulative count of Article Views (full-text article views including HTML views, PDF and ePub downloads, according to the available data) and Abstracts Views on Vision4Press platform.
Data correspond to usage on the plateform after 2015. The current usage metrics is available 48-96 hours after online publication and is updated daily on week days.
Initial download of the metrics may take a while.