| Issue |
A&A
Volume 695, March 2025
|
|
|---|---|---|
| Article Number | A39 | |
| Number of page(s) | 15 | |
| Section | Extragalactic astronomy | |
| DOI | https://doi.org/10.1051/0004-6361/202451373 | |
| Published online | 03 March 2025 | |
Unveiling the kinematics of a central region in the triple-AGN host NGC 7733-7734 interacting group
1
Indian Institute of Astrophysics, Kormangala II Block, Bengaluru 560034, India
2
Department of Physics, Pondicherry University, R.V. Nagar, Kalapet, 605014 Puducherry, India
3
Observatoire de Paris, LERMA, Collège de France, CNRS, PSL University, Sorbonne University, F-75014 Paris, France
⋆ Corresponding author; This email address is being protected from spambots. You need JavaScript enabled to view it.
Received:
4
July
2024
Accepted:
14
January
2025
Abstract
We present a detailed study of the interacting triple active galactic nuclear system, NGC 7733-34, focusing on stellar kinematics, ionised gas characteristics, and star formation within the central region and stellar bars of both galaxies. We performed a comprehensive analysis using archival data from MUSE, HST/ACS, and DECaLS, complemented with observations from UVIT and IRSF. We identified a disc-like bulge in both NGC 7733 and NGC 7734 through a 2D decomposition. A central nuclear structure, with a semi-major axis of ∼1.113 kpc, was detected in NGC 7733 via a photometric and kinematic analysis, confirmed by the strong anti-correlation between V/σ and h3, indicative of circular orbits in the centre. NGC 7734 lacks a distinct nuclear structure. The presence of a disc-like bulge results in an anti-correlation between V/σ and h3, along with diffuse light. However, it does show higher central velocity dispersion, possibly attributed to an interaction with a smaller clump, which is likely a fourth galaxy within the system. Both galaxies demonstrate ongoing star formation, evidenced by FUV and Hα observations. NGC 7734 shows recent star formation along its bar, while NGC 7733 experiences bar quenching. The star formation rate (SFR) analysis of NGC 7734 reveals that the bar region’s SFR dominates the galaxy’s overall SFR. Conversely, in NGC 7733, the lack of star formation along the bar and the presence of a Seyfert 2 active galactic nucleus (AGN) at the galaxy centre suggest the possibility of link among both. However, this would not affect the galaxy’s overall star formation. Our findings provide valuable insights into the stellar and gas kinematics, star formation processes, and AGN feedback mechanisms in interacting galaxies hosting stellar bars.
Key words: galaxies: active / galaxies: bulges / galaxies: interactions / galaxies: individual: NGC 7733 / galaxies: individual: NGC 7734 / galaxies: kinematics and dynamics
© The Authors 2025
 Open Access article, published by EDP Sciences, under the terms of the Creative Commons Attribution License (https://creativecommons.org/licenses/by/4.0), which permits unrestricted use, distribution, and reproduction in any medium, provided the original work is properly cited.
This article is published in open access under the Subscribe to Open model. This email address is being protected from spambots. You need JavaScript enabled to view it. to support open access publication.
1. Introduction
In our nearby Universe, galaxy interactions have been observed to significantly impact galaxy evolution. When galaxies come close to each other, the gravitational force causes distortions and can lead to the exchange of dust and gas. The gravitational forces from these encounters generate tidal forces, which, in turn, trigger the collapse and compression of molecular gas clouds. This process is crucial for forming new stars (Mihos & Hernquist 1996; Barnes & Hernquist 1996). Close interactions, particularly involving galaxies with substantial reserves of cold gas, can lead to increased star formation (SF) and active galactic nucleus (AGN) activity. Such interactions result in enhanced SF compared to isolated galaxies (Kennicutt et al. 2008; Ellison et al. 2008; Scudder et al. 2012). Additionally, the merger of galactic discs can create channels for gas inflows towards central regions, fueling starbursts (Di Matteo et al. 2007; Hopkins et al. 2008). Studies indicate that the star formation rate (SFR) per unit mass in interacting galaxies is approximately ten times higher than that of isolated systems (Young 1993).
Galactic structures such as bulges, bars, discs, and spiral arms can be strongly affected by interactions, which, in turn, affect the distribution of molecular gas and SF, although their effect on star formation efficiency is found to be small (Querejeta et al. 2021). Nearly 70% of disc galaxies in the nearby Universe host bars in their central region, which is evident in near-infrared (NIR) images (de Vaucouleurs 1963; Knapen et al. 2000; Eskridge et al. 2000; Menéndez-Delmestre et al. 2007; Nair & Abraham 2010; Masters et al. 2011), while bars play a vital role in galaxy evolution either by enhancing or suppressing the SF in their host galaxy. There is no uniform picture of where the SF occurs in galactic bars. It can occur in narrow lanes or have a curved morphology, either along one edge or in the middle of the bar (Díaz-García et al. 2020). Bars have statistically been linked to enhanced gas concentration and very clearly linked to enhanced SF in the central kiloparsec (kpc) region (Jogee et al. 2005; Lin et al. 2017). Studies by Elmegreen & Elmegreen (1985) and Menéndez-Delmestre et al. (2007) suggest that the dependence of SFR enhancement on morphological type may be due to the longer and stronger (more elongated) bars. Simulations also indicate that only strong bars are effective at funnelling gas to the inner kpc (Regan & Teuben 2004) and triggering SF. Fraser-McKelvie et al. (2020) have shown the presence of Hα (an indicator of massive SF) along the bar length and at the bar ends in a sample of barred galaxies from SDSS-IV MaNGA. Díaz-García et al. (2020) found SF within bars and concluded that star-forming bars are ubiquitous among late-type gas-rich galaxies. Barway & Saha (2020) found that bars in S0 galaxies appear bluer than those in spiral galaxies, likely due to their environments. In their study, most blue barred S0 galaxies are in intermediate-density regions, where minor mergers and tidal interactions are more frequent. These external effects may trigger SF in these bars, hence, the bars appear bluer. Thus, interacting galaxy systems present an ideal framework for investigating the potential impact of interactions on the various properties of individual galaxies within the system and their evolutionary processes.
NGC 7733-34 is a notable example of a pair of barred interacting galaxies and has been identified as a triple AGN system by Yadav et al. (2021). The system comprises the barred spiral galaxies NGC 7733 and NGC 7734. NGC 7733 is situated at a distance of 152 Mpc and the distance of NGC 7734 is 158 Mpc, with NGC 7734 being approximately 48.3 kpc from NGC 7733. Both galaxies have undergone a recent SF burst in their inner discs and have extended rings and tidal arms. Additionally, NGC 7733 is interacting with a smaller galaxy, NGC 7733N, which appears as an early-type galaxy. Emission line analysis from the central regions of NGC 7733 and NGC 7734 indicates the presence of Seyfert and low-ionisation nuclear emission-line regions (LINER) type AGN activity. NGC 7733N also exhibits Seyfert-like emission characteristics. In a study of southern interacting galaxies, Horellou & Booth (1997) estimated the atomic gas (HI) content of the NGC 7733-34 system to be less than 4.2 × 10⁹ M⊙. In contrast, the molecular gas content, specifically 12CO(1 − 0), was found to be less than 1.54 × 10⁹ M⊙ in NGC 7733 and approximately 1.073 × 10¹⁰ M⊙ in NGC 7734. A photometric study by Jahan-Miri & Khosroshahi (2001), utilising UBVRI photometry, revealed that the stellar population in NGC 7733 is significantly younger than that in NGC 7734.
Yadav et al. (2023) conducted a far-ultraviolet (FUV) and optical study of the star-forming complexes within this interacting galaxy system. They reported the mean FUV and Hα star formation rate surface density (ΣSFR) for NGC 7733 to be 0.008 and 0.194 M⊙ yr−1 kpc−2, respectively, and for NGC 7734 to be 0.014 and 0.200 M⊙ yr−1 kpc−2. In the present study, we investigate the photometric properties of the individual galaxies in the interacting group NGC 7733-34 to understand the structural properties of the central region, including bulge and stellar bar. We also present a kinematic study of this group to shed light on the system’s stellar and ionised gas properties. Our analysis utilises FUV observations from the Ultraviolet Imaging Telescope (UVIT), archival optical data obtained with the Very Large Telescope’s (VLT) Multi-Unit Spectroscopic Explorer (MUSE) integral field spectrograph (IFS), archival optical imaging data from Dark Energy Camera Legacy Survey (DECaLS) and Hubble Space Telescope (HST), and near-infrared (NIR) data from the Infrared Survey Facility (IRSF) telescope.
This paper is organised as follows: Sect. 2 briefly overviews the data, and Sect. 3 presents the analysis performed for this work. Section 4 focuses on the results and discussion and a summary of the results is presented in Sect. 5. An appendix includes SF in different regions of NGC 7734. Throughout this work, we used a flat ΛCDM cosmology with ΩM = 0.3, Ωλ = 0.7, and Hubble constant (H0) = 70 km s−1 Mpc−1.
2. Data
In this study, we have used FUV data obtained from UVIT onboard AstroSat (Agrawal 2006), the imaging optical data from Data Release 10 (DR10) of DECaLS (Dey et al. 2019) and the optical IFU data from MUSE (Bacon et al. 2006). The galaxy group was observed on 2019-09-08, and the programme ID is 0103.A-0637. We have used the science-ready MUSE-DEEP data cube of the galaxy group from the ESO archive science portal1. We have also used recently published high-resolution optical images from the Advanced Camera for Surveys (ACS) onboard HST. It is observed with filter F606W, corresponding to a broad V band. In Fig. 1, we show the colour image of the galaxy group NGC 7733-34 taken from NASA Science2. Three galaxies NGC 7733, NGC 7733N, and NGC 7734 are marked here. The NIR imaging data is observed from the IRSF telescope at the South African Astronomical Observatory (SAAO) (Nagayama et al. 2003). The detailed discussion on multi-wavelength data used for this work can be found in Yadav et al. (2023).
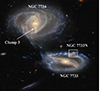 |
Fig. 1. Colour image of the NGC 7733-34 galaxy group taken by NASA’s Hubble Space Telescope. The three galaxies NGC 7733, NGC 7733N, and NGC 7734 are marked in this image. Also, the clump present along the bar of NGC 7734 is marked here and is discussed in Sect. 4.3. |
3. Analysis
In this section, we determine the properties of the structural components (bulge, bar, and disc) of NGC 7733 and NGC 7734. These parameters were obtained from J- and Ks band NIR images of the galaxies. We discuss the presence of nuclear structures obtained using HST/F606W band images. We present a brief discussion on the analysis of the MUSE data cube. Additionally, we will discuss the detection of star-forming clumps (SFCs) using FUV and Hα images of NGC 7733 and NGC 7734.
3.1. Isophotal analysis
Stellar bars in galaxies are mainly characterised by their length, strength, and pattern speed. Besides the bar length and pattern speed, the bar strength is a crucial characteristic. It signifies the bar’s contribution to the overall potential of the galaxy, which is hard to measure. However, there are many proxies to measure bar strength. For example, the maximum ellipticity (Laurikainen & Salo 2002; Erwin 2004) and the boxiness of the bar isophotes (Gadotti 2011) have been used to estimate bar strength. Bar strength can also be estimated by measuring the torque exerted by the bar (Combes & Sanders 1981; Buta & Block 2001; Laurikainen & Salo 2002) or by measuring the amplitude of the m = 2 Fourier mode (Athanassoula 2003). In this work, we are using one of the simplest definitions as given by Abraham & Merrifield (2000) and later used by Aguerri et al. (2009), as it is easy to determine from the ellipse fits. This method requires the measurement of the bar ellipticity (ϵbar) at rbar.
To measure the bar strength, first we need to deproject the galaxies according to the galaxy inclination (i). To estimate i for NGC 7733 and NGC 7734, we performed the isophotal analysis on the J-band image. This choice comes from the fact that the J-band NIR images of NGC 7733 and NGC 7734 have high signal-to-noise ratio (S/N), compared to other NIR images, which is a typical feature of IRSF observations (see Nagayama et al. 2003). The ellipse-fitting began a few arcsec away from the centre and extended to the outermost isophotes of the disc. All parameters, including the centres, were allowed to vary during the fitting. It allowed us to establish the ellipticity (ϵ), position angle (PA), and mean intensity of the best-fit ellipse as a function of the semi-major axis. We estimated the ϵ corresponding to a surface brightness of 21 mag/arcsec2, which is consistent with the surface brightness of 25 mag/arcsec2 in the B band (Jarrett et al. 2003).
We determined i by using cos i = (1 − ϵ). Next, we deproject the J-band NIR image of NGC 7733 into the sky plane using i = 57.23° and PA = 103.9°. Similarly, for NGC 7734, the deprojection has been done using i = 32.14°, PA = 144°. Once we deprojected the galaxy images, we used them for further analysis.
Several methods have been developed to measure the bar’s length. The three most popular methods are the Fourier decomposition, the PA radial profile, and the ellipticity radial profile. To estimate the bar length using Fourier decomposition, the Fourier analysis of azimuthal luminosity profiles is typically used (Ohta et al. 1990; Aguerri et al. 2000a). The other two methods use the isophotal analysis technique of fitting ellipses to photometric isophotes. In the PA radial profile method, the isophotes associated with the bar show nearly constant PA and then it changes to the outer disc orientation at large radii (Wozniak et al. 1995; Aguerri et al. 2000b). The bar length is determined at the radius where the PA changes by ΔPA from the value corresponding to the local maxima of ϵ. The value of ΔPA used in literature is 5° (Aguerri et al. 2015; Guo et al. 2019). The radial ellipticity profile of a barred galaxy exhibits a rise from a central value of zero to a local maximum, where the bar dominates the isophotes. Then, it transitions to the disc-dominated isophotes and decreases to a local minimum, which corresponds to the end of the bar. Thus the local maximum represents the lower limit and the local minimum represents the upper limit of the bar length (Michel-Dansac & Wozniak 2006). In this study, we adopted the radius reaching the local maximum ϵ where the PA of the bar isophotes’ remains constant (Barazza et al. 2008; Aguerri et al. 2009), as the bar length and the corresponding ϵ as bar ellipticity (ϵbar). The bar strength (fbar) was obtained using the bar’s axis ratio (b/a: where a and b are the semi-major and semi-minor axis, respectively). This is in line with the relation outlined in Aguerri et al. (2009) which is derived from the maximum value of the ellipticity profile along the bar, which usually happens at the end of the bar. The value of bar strength ranges from zero for an unbarred galaxy to close to unity for a strong bar (Abraham & Merrifield 2000):
![Mathematical equation: $$ \begin{aligned} f_{\rm bar} = \frac{2}{\pi } \left[\arctan \; \left(1-\epsilon _{\rm bar}\right)^{-1/2} - \arctan \; \left(1-\epsilon _{\rm bar}\right)^{+1/2}\right]. \end{aligned} $$](/articles/aa/full_html/2025/03/aa51373-24/aa51373-24-eq1.gif) (1)
(1)
The ϵbar(ϵbar = 1 − (b/a)bar) represents the maximum value of the ellipticity profile along the bar. Studies (Laurikainen et al. 2002, 2007) have shown that ϵbar correlates quite well with the measurement based on the maximum relative tangential force due to the bar (Buta & Block 2001).
We have determined the bar strength (fbar) to be 0.538 ± 0.007 for NGC 7733 and 0.267 ± 0.005 for NGC 7734. Since NGC 7733 is a highly inclined galaxy with a close companion, the bar ends are being affected due to the ongoing interaction with NGC 7734, as seen in Fig. 1. Hence, the bar ends seem to be distorted and bar length and strength measurements are done as best as possible. The bar length and strength observed in the NGC 7733-34 system are consistent with the characteristics of late-type galaxies reported by Díaz-García et al. (2016), based on 3.6 μm imaging from the Spitzer Survey of Stellar Structure in Galaxies (S4G). Notably, NGC 7733 displays a stronger bar compared to NGC 7734. This observation is particularly intriguing given that Seyfert galaxies generally do not exhibit strong bars (Shlosman et al. 2000). This discrepancy invites further numerical and theoretical investigations to explore the relationship between nuclear activity and stellar bar evolution.
3.2. Photometric decomposition
NIR images are used for two-dimensional decomposition because the emission from the old stellar populations in galaxies dominates the NIR band and dust has less of an impact on NIR emission. Therefore, NIR images are the best for modelling the light distribution in the bulge, bar, and discs of galaxies. We employed the two-dimensional (2D) decomposition code GALFIT (Peng et al. 2002) to obtain measurements of structural components from NIR (J and Ks) images of NGC 7733 and NGC 7734. GALFIT uses the Levenberg-Marquardt algorithm to minimise the χ2 between the observed image and the PSF-convolved model image (the sum of model components). We used two Sersic and one exponential profile to model the bulge, bar, and disc light distribution. Another Sersic profile was used to model the third galaxy, NGC 7733N, and details of the model parameters for this galaxy can be found in Yadav et al. (2021). Here, we present the model parameters for NGC 7733 and NGC 7734. The best-fit model is determined using a χ2 minimisation technique. The estimated errors on the recovered parameters in GALFIT models consider only the random (Poisson) noise due to the source brightness when the model fits the data perfectly. However, in the case of galaxy fitting, the discrepancies between data and model profile include not just Poisson sources but also errors arising from PSF variation in the image, parameter degeneracy, and sky background estimation errors (Peng et al. 2010). The unmodelled spiral arms cause further uncertainty on the retrieved values (Barway et al. 2020). However, Vika et al. (2013, 2014) estimated the associated errors of the fitted parameter based on the uncertainties in estimating the sky flux, which dominates the error budget. In the bulge+disc decomposition, Vika et al. (2014) showed the uncertainties associated with bulge n and Re can vary by up to 25%. Kruk et al. (2018) considered the similar uncertainties in their bulge+bar+disc decomposition.
Since estimating the errors caused by each of these components is non-trivial, we present the best-fit parameters for both NGC 7733 and NGC 7734 without the associated errors in Table 1. The J-band NIR images, the model images, the residual images along with the 1D surface brightness (SB) profiles of NGC 7733 and NGC 7734 are shown in Fig. 2. In the residual image of NGC 7734 (image (c) in the lower panel of Fig. 2), we notice that some stellar contribution is present in the very central region. Also, from the 1D SB profile (image (d) in the lower panel of Fig. 2), we find some missing light (the model SB profile does not match the galaxy SB profile) in the very central 1 arcsec region. However, we cannot model it in our J-band data due to the resolution. We suspect that this missing light can be a contribution from a second bulge, which can be a classical bulge at the very centre of the galaxy. We tried to model the light distribution of NGC 7734 in HST/F606W band data using GALFIT, which did not return a good fit due to the contamination from dust and the structures in the NGC 7734’s central region. We then looked into the central isophotes of NGC 7734 using HST data and found that the central (∼230 pc) isophotes are nearly circular, compared to the outer isophotes (as shown in Fig. 3). Studies on composite bulges (Méndez-Abreu et al. 2014; Erwin et al. 2015) have reported the existence of a central classical bulge embedded in a disc-like bulge with the central isophotes becoming very round, as we have found in the centre of NGC 7734.
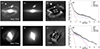 |
Fig. 2. Output of the GALFIT model along with the azimuthally-averaged surface brightness profile of NGC 7733 (top panel) and NGC 7734 (bottom panel) is shown. In both the top and bottom panels, figure (a) is the J-band image of the galaxies; (b) is the model image and (c) represents the residual obtained from the GALFIT modelling. The parameters of the models of NGC 7733 and NGC 7734 are tabulated in Table 1. The results of ellipse fitting are presented in figure (d). Azimuthally averaged surface brightness of the best-fitted ellipse plotted as a function of the semi-major axis of the ellipse (solid dots), here the error bars represent the rms error of the intensity measured along each fitted isophote. The surface brightness profile is decomposed into two Sersic and one exponential component (in both the panels), a bulge (red dashed), a bar (magenta dashed) and a disc (blue dashed). The sum of these three components is shown by a black solid line. The clump is marked in the residual image in (c) of the bottom panel. North is up, and east is to the left. |
Properties of three components (bulge, bar and disc) of NGC 7733 and NGC 7734 in J and Ks band images. Re is the effective radius in kpc for the bulge and bar, Rs is the disc scale length in kpc, M is absolute magnitude, n is the Sersic index, fbar is the bar strength as measured from deprojected images, and M* is the stellar mass, estimated for all three component using the Ks band mass-to-light ratio, M/L = 0.6 (McGaugh & Schombert 2014).
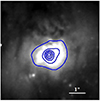 |
Fig. 3. F606W filter image of the central 6 arcsec × 6 arcsec region of NGC 7734. The contour is overlaid in the image to show the presence of central very central circular contours. At the distance of NGC 7734, 1 arcsec = 766 pc. North is up, and east is to the left. |
Based on the best-fitted model effective radius values (Re), we found that the bulge and bar of NGC 7733 are larger than the respective components of NGC 7734. However, when taking into account the error bars (as discussed above), both bulges could be consistent in size. Additionally, the disc of NGC 7733 is approximately twice the size of NGC 7734, as estimated from the disc scale length (Rs). Using the Sersic index (n) value, we found that NGC 7734 hosts a disc-like bulge (1 < n < 2), whereas NGC 7733 hosts a classical bulge (n > 2). Although some studies (Costantin et al. 2018) suggest that the Sersic index alone is not a valid method for identifying the nature of bulges, it is extensively used to classify the bulge type. However, NGC 7733 hosts a disc-like bulge (rather than a classical bulge), with an uncertainty of 25% in n, which makes n < 2. We also determined the mass of individual components in the Ks band using M/L = 0.6 (McGaugh & Schombert 2014). We did not perform a reddening correction due to galactic extinction, since it is negligible in the Ks band. The existence of a disc-like bulge in NGC 7733 and NGC 7734 indicates that it has most likely been formed through secular evolution due to the presence of a bar.
3.3. Structure map
The analysis of fine nuclear structural features in the central region of galaxies involves the use of a variety of image-processing techniques. One such technique, known as a structure map, was introduced by Pogge & Martini (2002). This method can resolve structures as small as an image’s point spread function (PSF) scale. It effectively eliminates the smooth large-scale light distribution and enhances the visibility of narrow dust lanes and emission-line gas in nearby galaxies. We have applied this method to the HST/F606W images of NGC 7733 and NGC 7734. The process involves convolving the image with a PSF for the PC1 camera corresponding to the filter band-pass generated using TINYTIM (Krist et al. 2011). The original image is then divided by the PSF-convolved image, and the resulting ratio is further convolved with the transpose of the model PSF. Mathematically, a structure map S is defined as:
![Mathematical equation: $$ \begin{aligned} S = \left[\frac{I}{I\otimes P}\right] P^{t}, \end{aligned} $$](/articles/aa/full_html/2025/03/aa51373-24/aa51373-24-eq5.gif) (2)
(2)
where I is the original image, P is the model PSF, Pt is the transpose of the PSF, and ⊗ is the convolution operator. This technique is based on the Richardson–Lucy (RL) image restoration algorithm. The structure maps for the central 8 arcsec2 and 6 arcsec2 square region of NGC 7733 and NGC 7734, respectively, are shown in Fig. 4. Dark regions represent the dust-obscured areas, in contrast, bright regions correspond to either the location of heightened stellar light (e.g. star-forming regions) or emission-line regions (the F606W filter reveals several bright emission lines from high surface-brightness regions due to its wide bandwidth). In NGC 7733, we identified a nuclear disc-like structure that appears like a nuclear ring due to presence of dust. The semi-major axis of this nuclear disc is ∼1.116 kpc. Conversely, the central feature in NGC 7734 resembles a disc and spiral arms-like structure in the outer parts as depicted in Fig. 4.
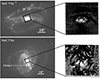 |
Fig. 4. F606W filter images from ACS/HST of NGC 7733 (top) and NGC 7734 (bottom) are shown, along with the structure maps of the central regions for both galaxies. For NGC 7733, the structure map is zoomed in to cover the central 8 × 8 arcsec2, revealing a visible central disc-like structure with a semi-major axis of 1.515 arcsec. At the distance of NGC 7733, 1 arcsec = 737 pc. In contrast, the structure map for NGC 7734 is zoomed in to cover the central 6 × 6 arcsec2, showing a diffuse structure in the centre. The clump present along the bar of NGC 7734 is marked here and has been discussed in Sect. 4.3. At the distance of NGC 7734, 1 arcsec = 766 pc. North is up, and east is to the left. |
3.4. MUSE data cube analysis
We utilised the wide field mode (WFM) of the MUSE IFS, which provides an archival science-ready data cube of the galaxy group NGC 7733-34. The data cube was analysed using the 3.1.0 version of Galaxy IFU Spectroscopy Tool (GIST) (Bittner et al. 2019), a comprehensive scientific analysis framework for fully reduced (integral-field) spectroscopic data. GIST leverages the penalised pixel-fitting code (pPXF) (Cappellari & Emsellem 2004; Cappellari 2017, 2022) to extract the stellar line-of-sight velocity distribution (LOSVD); namely, the stellar kinematics and the Gas and Absorption Line Fitting (GandALF) (Sarzi et al. 2006; Falcón-Barroso et al. 2006) code to determine the emission line fluxes and gaseous kinematics. Voronoi binning (Cappellari & Copin 2003) was used for spatially binning the data within the wavelength range 480 − 580 nm to achieve a S/N of 30. Spaxels with S/N greater than 30 remain unbinned, while those with S/N less than 3 were excluded to eliminate noisy data before binning. Additionally, all spectra were corrected for galactic extinction values in the direction of the target. It is important to keep in mind that the selected wavelength range includes a potentially strong emission line (Hβ). However, in the NGC 7733-34 group, Hβ emission is significantly low; thus, the Voronoi binning will not be substantially affected by the selected wavelength range.
For the analysis of stellar kinematics, pPXF utilises a non-negative linear combination of template spectral libraries convolved with the LOSVD in pixel space. The method employs a least-squares minimisation technique to determine the best fit LOSVD parameters. In the current analysis, to prevent the contamination from the redder wavelength, the fitting of the spectra is carried out between the wavelength range 480–580 nm, as suggested by Bittner et al. (2019, 2021). During the fit, prominent emission lines within this range were masked. An eighth-order multiplicative Legendre polynomial is incorporated into the fit to address any minor differences in the continuum between observed and template spectra. Taking these best-fit values into account, spatial maps of the stellar velocity (V) in the galaxy’s rest frame, velocity dispersion (σ), and higher order Gauss–Hermite moments (h3 and h4) of the galaxies are constructed. In this work, we used the V, σ, and h3 maps for further discussions. The h4 moment is not used because it does not provide relevant information for this work; thus, we have not included a corresponding map of the h4 moment.
3.5. Detection of SFCs and SFR estimation
In the science-ready FUV and narrow band Hα images of NGC 7733 and NGC 7734, the star-forming regions appear as bright clumps. To identify these clumps, we utilised the Source Extractor software (SExtractor) (Bertin & Arnouts 1996). This software takes a threshold value as input to detect the source, with pixels exceeding the threshold count identified as a source. For the FUV image, we set the detection threshold at 1.5σ, and for the Hα image, we set 3σ, where σ represents the global background noise. In the image of NGC 7733, we detected 71 regions in FUV and 53 regions in Hα. Similarly, in the image of NGC 7734, we ascertained 181 regions in FUV and 64 regions in Hα. After correcting for instrumental resolution, we found 41 FUV and 51 Hα regions in the image of NGC 7733, with three of the regions associated with nuclear emission. For the image of NGC 7734, we obtained 73 FUV and 51 Hα regions. Among these, 11 FUV and 4 Hα regions are located along the bar.
In order to conduct aperture photometry on the identified sources, we employed Photutils, which is a Python astropy package3. The star-forming regions represent a group of young, vibrant stars, and the magnitude calculated from these regions is influenced by both galactic and internal extinction. We determined galactic extinction in UV and Hα by utilising the extinction law outlined by Cardelli et al. (1989):
 (3)
(3)
Here, x is the wave number, a(x) and b(x) were evaluated from Cardelli et al. (1989), Rv = 3.1 for the Milky Way and A(V) = 0.073 for NGC 7733 and 0.074 for NGC 7734.
For star-forming disc galaxies, Kennicutt (1998) suggested Hα extinction, AHα = 1.1 mag. To correct for internal extinction, we used AHα = 1.1 mag and AFUV/AHα = 3.6 (Leroy et al. 2008). We derived the SFR in the FUV filter using the following relation (Leroy et al. 2008):
 (4)
(4)
To measure the SFR of the Hα star-forming regions we used the following relation (Calzetti et al. 2007):
 (5)
(5)
The luminosity in both the equations (Eqs. (4) and (5)) is the intrinsic luminosity.
4. Results and discussion
4.1. Stellar kinematics of the bulge
In this section, we examine the signatures present in the kinematic maps obtained from MUSE data, which indicate the existence of various structural components. The higher order h3 moment, which quantifies the skewness of LOSVD, is crucial to characterise the stellar orbital structure.
4.1.1. NGC 7733
In the left panel of Fig. 5, the maps of V, σ, V/σ, and h3 moment of NGC 7733 are displayed. The contours, derived from the intensity maps from MUSE, are equally spaced in steps of 0.2 mag. The stellar velocity map exhibits a regular rotation pattern, with the north-east region of the galaxy showing a red-shifted velocity and the north-west region displaying a blue-shifted velocity. The black circle represents the bulge, with a radius equal to the bulge’s effective radius estimated from GALFIT modelling on the Ks band image (see Table 1). A distinct kinematic component with enhanced velocity is observable in the central region of 2 arcsec radii. Additionally, the northern spiral arm region shows a velocity different from that of NGC 7733, which has already been studied by Yadav et al. (2021). This discrepancy is attributed to the presence of the other galaxy, NGC 7733N, which is moving with a velocity of ∼650 km s−1 with respect to NGC 7733 (Yadav et al. 2021).
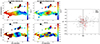 |
Fig. 5. Stellar kinematic maps of NGC 7733. Left panel: stellar velocity (V), velocity dispersion (σ), V/σ, and h3 as indicated. The isophotes, equally spaced in 0.15 mag steps, are derived from MUSE intensity maps. Colour bars beside each map indicate the parameter ranges. The black circle on the velocity map marks the bulge, with a radius equal to the bulge effective radius from photometric decomposition using the Ks band NIR image, as detailed in Table 1. Here, 1 arcsec = 737 pc. North is up, and east is to the left. Right panel: h3 vs. V/σ plot for each Voronoi bin. Red circles denote bins within the bulge effective radius (inside the black circle on the velocity map), while grey points represent bins for the entire galaxy. |
The velocity dispersion map shows an increase in σ within the galaxy’s central region, spanning approximately 10 arcsec. The median of the velocity dispersion within the effective radius of the bulge is 148 ± 14 km s−1. Additionally, a high-velocity dispersion is observed in the knot located in the northern spiral arm, corresponding to the neighbouring galaxy NGC 7733N. By utilising the V and σ maps, we generated a map displaying the ratio of the line-of-sight velocity to the velocity dispersion (V/σ). The V/σ values mainly fall within the range of approximately −3 to 3, but within the bulge effective radius, they are constrained to around −1 to 1. Furthermore, we identified an anti-correlation between the V and h3 moment within the bulge’s effective radius, with h3 values ranging mostly from −0.12 to 0.12. This anti-correlation suggests the presence of near-circular stellar orbits, whereas a correlation between them indicates eccentric stellar orbits. This determination of an anti-correlation between V and h3 may be linked to the nuclear disc identified using the structure map on the Hubble Space Telescope image and it is illustrated in Fig. 5 (Gadotti et al. 2015; Bittner et al. 2019).
To provide additional kinematic evidence supporting the presence of a nuclear disc, we used a V/σ vs. h3 map to graph their values for all the bins, which is displayed in the right panel of Fig. 5. The grey dots represent the values for each bin of the galaxy, while the red dots indicate the values corresponding to the bins inside the bulge effective radius. The V/σ–h3 values do not reveal a strong correlation or anti-correlation for the entire galaxy. However, they show a significant anti-correlation for the bins within the bulge effective radius. The Spearman correlation coefficient for the bulge (red dots) is −0.55, indicating the anti-correlation and providing further evidence for the presence of circular orbits in the central region, thereby supporting the existence of nuclear structure. Previous studies have reported the formation of nuclear structures in the vicinity of inner Lindblad resonances (Knapen et al. 1995; Comerón et al. 2010) through bar-stimulated gas inflow (Combes & Gerin 1985). The existence of nuclear discs can also be supported by stellar kinematics. An anti-correlation between V and h3 is aligned with the circular motion (Gadotti et al. 2015), further confirming the presence of nuclear disc structure. We find that the semi-major axis of the disc is aligned with the major axis of bar.
4.1.2. NGC 7734
The left panel of Fig. 6 shows the V, σ, V/σ, and h3 moment maps of NGC 7734. The contours are equally spaced in steps of 0.15 mag and derived from the MUSE intensity maps. The stellar velocity map displays a regular rotation pattern, with the north-western region of the galaxy having a red-shifted velocity and the south-eastern region having a blue-shifted velocity. The black circle denotes the bulge, and its radius is equal to the radius of the bulge effective radius estimated from GALFIT modelling on the Ks band image. It is given in Table 1. The σ map reveals the enhancement of σ in the galaxy’s central region with a radius of 5 arcsec. The median of velocity dispersion within the bulge effective radius is 179 ± 16 km s−1. The higher σ value means that the stars are generally dynamically hotter, as found in star-forming galaxies (Oh et al. 2022).
We produced the ratio of LOS velocity and velocity dispersion (V/σ) map using the V and σ maps. The V/σ value mostly ranges between ∼ − 3 to 3, whereas it lies between ∼ − 1 to 1 for the bulge effective radius. We found an anti-correlation between V and h3 moment within the effective radius of the bulge. The h3 value mostly has a range between −0.12 and 0.12. Similar to NGC 7733, we used V/σ vs. h3 map to plot their values for all the bins and has been shown in the right panel of Fig. 6. Here, the grey dots present the values for each bin of the galaxy, whereas the red dots represent the value corresponding to the bins inside the bulge effective radius. We found the Spearman correlation coefficient for the bulge (red dots) is −0.38, which suggests a loose anti-correlation and supports the presence of a circular orbit in the central region. However, we notice a disc and spiral arms-like structure in the central region from the structure map on HST image, resulting in slight V/σ − h3 anti-correlation. However, from the photometric decomposition, we found that NGC 7734 hosts a disc-like bulge, a secular-built structure that a stable circular orbit can represent; we also see the presence of stellar light contribution in the very centre of the galaxy, along with the central circular isophotes as discussed in Sect. 3.2. Taking all these factors into account, it can be concluded that NGC 7734 exhibits multiple central structures, including a second bulge. Specifically, the galaxy contains a classical bulge with a radius of approximately ∼230 pc, alongside a disc-like bulge with an effective radius of ∼1.15 kpc in the J-band. Furthermore, the high-velocity dispersion observed in the central region provides additional evidence supporting the existence of a classical bulge at the centre of NGC 7734 (Erwin et al. 2015).
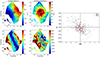 |
Fig. 6. Stellar kinematic maps of NGC 7734. Left panel: stellar velocity (V), velocity dispersion (σ), V/σ, and h3, as labelled. The isophotes are evenly spaced in intervals of 0.15 mag, derived from MUSE intensity maps. Colour bars next to each map indicate the range of values for each parameter. The black circle on the velocity map denotes the bulge, with a radius equal to the bulge effective radius obtained from photometric decomposition using Ks band NIR imaging, detailed in Table 1. Here, 1 arcsec = 766 pc. North is up, and east is to the left. Right panel: h3 vs. V/σ plot for each Voronoi bin. The red circles represent bins within the bulge effective radius (inside the black circle on the velocity map), while grey points denote bins across the entire galaxy. |
4.2. Gas kinematics of bulges
To measure emission line properties such as emission line fluxes, gas kinematics, and emission-free continuum spectra, GIST utilises the GandALF module (Sarzi et al. 2006; Falcón-Barroso et al. 2006). Each user-specified emission line is treated as a Gaussian template additional to the stellar templates. The best-fitting gaseous properties are estimated using a linear combination of these emission line templates with the spectral library template. We have generated gas (Hα) velocity and velocity dispersion maps for NGC 7733 (top) and NGC 7734 (bottom), as shown in Fig. 7.
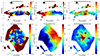 |
Fig. 7. Gas (Hα) intensity & kinematic maps of NGC 7733 (top panel) and NGC 7734 (bottom panel). (a) represents the gas intensity map, (b) shows the gas velocity map, and (c) displays the gas velocity dispersion map for NGC 7733 (top panel) and NGC 7734 (bottom panel). The isophotes are equally spaced in intervals of 0.15 mag and are derived from the MUSE intensity maps. The colour bars beside each map indicate the range of the parameters. The black circle on the intensity map marks the bulge, with its radius equal to the bulge effective radius derived from photometric decomposition using Ks band NIR image, as specified in Table 1. At the distance of NGC 7733, 1 arcsec = 737 pc, whereas, at the distance of NGC 7734, 1 arcsec = 766 pc. North is up, and east is to the left. |
4.2.1. NGC 7733
The gas velocity map (image (a): top left) for NGC 7733 exhibits a similar pattern to the stellar velocity. Specifically, the north-eastern region of the galaxy displays a red-shifted velocity, while the north-western region shows a blue-shifted velocity. Additionally, the central region demonstrates a slightly enhanced gas velocity component compared to the stellar velocity. Moving on to the gas velocity dispersion map (image (b): top right), it reveals a higher velocity dispersion in the central few arcsecs of the galaxy. Within the bulge’s effective radius, the gas velocity dispersion measures 114 ± 10 km s−1. The gas velocity dispersion in the centre is lower compared to the stellar velocity dispersion. The presence of the nuclear disc, a rotationally supported system, contributes to this lower dispersion.
Although NGC 7733 hosts an AGN of Seyfert 2 at its centre, it also exhibits an extended narrow line region (ENLR) towards the north-eastern area (Yadav et al. 2021). Studies indicate that gas velocity dispersion is strongly influenced by the power source of AGN outflows, which heat the gas while maintaining dynamical equilibrium (Oh et al. 2022). However, the case of NGC 7733 presents a conflicting scenario, possibly due to the presence of a rotationally supported system, the nuclear disc, where stellar and gas velocity dispersion lowers beyond the central few arcsec regions.
This change in stellar and gas velocity dispersion could be an outcome of central SF as discussed by Wozniak et al. (2003). In NGC 7733, we can see the presence of central Hα and FUV emissions (see the FUV and Hα image in the upper panel of Fig. 1. of Yadav et al. 2021), which is associated to the nuclear disc.
4.2.2. NGC 7734
The gas velocity map (image (a): bottom left) of NGC 7734 exhibits a similar pattern to the stellar velocity. In the north-western region of the galaxy, there is a red-shifted velocity, while the south-eastern region shows a blue-shifted velocity. The gas velocity in the centre is slightly higher than the stellar velocity. Furthermore, the gas velocity dispersion (image (b): bottom right) in the central few arcsec of the galaxy is notably high. The dispersion measures 224 ± 22 km s−1 within the bulge’s effective radius. Notably, the gas velocity at the centre surpasses the stellar velocity dispersion. The presence of high gas velocity dispersion is interesting to notice. NGC 7734 hosts LINER nuclei, and the majority of local AGN exhibit spectra dominated by low-ionisation emissions such as [O I], [N II], and [S II] and are classified as LINERs (Heckman 1980; Cid Fernandes et al. 2010). The prevailing view is that these LINERs are predominantly powered by hot, evolved stars (Belfiore et al. 2015). It suggests both evolved stars and AGN activity may collaboratively contribute to the enhanced gas velocity dispersion observed in the centre of NGC 7734. It implies that the increased gas velocity dispersion at the galaxy’s core can be attributed to AGN activity. Oh et al. (2022) found that AGN and LINER regions, especially those concentrated in the central parts of galaxies, tend to produce dynamically hotter gas kinematics, characterised by large velocity dispersion, compared to regions dominated by active SF. Furthermore, studies have identified a positive correlation between gas velocity dispersion and the diagnostic emission line ratios on the BPT diagram (Monreal-Ibero et al. 2006). This correlation is indicative of shock-driven ionisation processes. Additionally, the existence of tidally induced large-scale gas flows, often a result of galaxy mergers or interactions, can be the source of these shocks (Monreal-Ibero et al. 2006, 2010). For NGC 7733-34, which is a closely interacting galaxy system, the observation of several small galaxies within the field suggests that this group may have experienced numerous minor mergers or fly-by interactions. The presence of NGC 7733N in the northern arm of NGC 7733 further corroborates this hypothesis (Yadav et al. 2021).
4.3. Star formation along the bar of NGC 7734
In our investigation, we have conducted a multi-wavelength analysis to examine the occurrence of Hα and FUV emission along the bar of the barred spiral galaxy NGC 7734 in the triple AGN group NGC 7733-34. A recent study by Yadav et al. (2023) examined the SF in NGC 7733 and NGC 7734 using FUV data from UVIT and Hα data from MUSE. Our measured mean ΣSFR aligns with their estimated values for both galaxies. Additionally, they documented the presence of Hα emission along the bar of NGC 7734.
We conducted a similar analysis based on both the FUV and Hα images of NGC 7734. Remarkably, we observed the presence of FUV emission along with Hα in the bar region of NGC 7734. We identified and characterised all the SFCs in the FUV and Hα images and calculated their ΣSFR. We categorised the SFCS into three regions: (1) a central region, which encompasses the central part of the galaxy, including the bar and bar ends; (2) an nner ring; and (3) an outer ring. The detailed discussion on the SF in NGC 7734 is given is Appendix A. The number of detected clumps along with the median value of log ΣSFR for the three regions as described above are presented in Table A.1.
In previous research, the impact of the bar on central SF has been documented (Combes & Gerin 1985). Understanding SF along the bar is crucial for gaining insights into the role of the bar in galaxy evolution. In a recent study, Fraser-McKelvie et al. (2020) identified the presence of Hα emissions along the bar and at the bar ends in a sample of MaNGA galaxies, particularly those in low-density environments. Their findings indicate that the Hα bar leads the stellar bar, as evidenced by measuring the respective Hα and stellar bar position angles.
In Fig. 8, we present the UVIT FUV image (left panel) and MUSE Hα image (right panel) of NGC 7734. We have overlaid the J band bar PA on both the FUV and Hα images passing through the galaxies’ photometric centre, which we determined from the isophotal analysis. The PA of the bar is measured from the isophotal analysis based on the J-band image, as discussed in Sect. 3.1. The estimated bar PA of NGC 7734 is 22.48° ± 0.79°. We found that there is an observable difference in the position angle between the stellar bar and Hα along the stellar bar, whereas the FUV bar is primarily aligned with the stellar bar. The presence of Hα emission along the bar is intriguing as it suggests recent SF (around 10 million years ago). Additionally, the coexistence of FUV and Hα emissions along the bar indicates the presence of young stars in this region (approximately 100 million years old). It is well known that bar-induced gas inflow triggers SF in the central regions of galaxies. It has also been observed that barred galaxies tend to have higher gas concentrations than their unbarred counterparts, which is correlated with increased rates of central SF (see Sakamoto et al. 1999; Jogee et al. 2005).
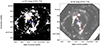 |
Fig. 8. FUV, Hα and NIR bar PA comparison. Left panel: FUV image of NGC 7734 from UVIT. Right panel: Hα narrow-band image of NGC 7734 from MUSE. The red dashed line in each image is the bar PA, as estimated from isophotal analysis based on the J-band image and the blue solid circle of a radius of 1 arcsec represents the photometric centre of the galaxy. Each image frame covers an area of 70 × 70 arcsec2. North is up, and east is to the left. |
Additionally, the g − r colour image of NGC 7734 bar is displayed in the left panel of Fig. 9, with contours taken from the g-band image. A detailed examination of the bar reveals clumpy stellar light within the optical contour, which we have marked as (1, 2, 3, and 4, respectively). Clumps 1 and 4 are located at the northern and southern ends of the bar respectively, while clump 2 represents the central region, identified as a disc-like bulge based on the Sersic index. Clump 3 is the clump present along the bar on the southern side of the bulge, it has also been marked in Fig. 1 and bottom panel of Fig. 4. The presence of a clumpy structure, particularly clump 3, along the bar in the optical image, is noteworthy. We observe FUV emission around the clumpy region in the left panel of Fig. 8, while the Hα gas is not present there, having instead moved eastward.
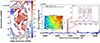 |
Fig. 9. Properties of clump present along the bar of NGC 7734. Left panel: g − r colour image of NGC 7734 bar with g-band contours overlaid. The clumpy nature of the bar in the optical image is marked here. Clump 2 represents the centre of NGC 7734, whereas the red clump present along the bar is highlighted as clump 3. The other two clumps (clumps 1 ⩕ 4) are present at the bar ends. The blank spaces in the g − r colour image are due to less S/N in those regions. Right panel: Spectra corresponding to the bulge (black) and clump 3 (blue) as shown in left panel are presented here. The spectra around [N II] and Hα line are enhanced and are shown at the right corner. All the lines are modelled using Gaussian profiles and the observed wavelength of each line is mentioned. These lines are used to estimate the redshift of the clump present along the bar. The LOS stellar velocity map of clump 3 is also shown in the right panel. We derived the LOS velocity using the GIST Pipeline as discussed in Sect. 3.4. |
We suspect that clump 3 can be a compact galaxy projected in a way that it appears to be part of the bar. To confirm this, we extracted the spectra from the MUSE cube by taking a circular aperture with a radius of 2.26 arcsec around the clump as well as around the centre of NGC 7734. The continuum-subtracted observed spectra for bulge and clump 3 are shown by black and blue lines, respectively, in the right panel of Fig. 9. We zoomed in the spectrum around the Hα and [N II] doublet emission lines. We fit the Gaussian profiles to all the three spectral lines, and the fitted spectra are shown in red. We also plotted the peaks of the emission lines along with their respective observed wavelength. We estimated the red-shift using Hα and [N II] lines from the MUSE data cube and found it to be 0.03508 ± 0.00003, which is similar to the red-shift of the host galaxy (z = 0.03527 ± 0.00006) (Yadav et al. 2021). Thus, the clump is moving with a velocity of 57 km s−1 with respect to the galaxy NGC 7734. So, the redshift measurement does not support our assumption. We were unable to detect any velocity gradient surrounding the clump in our stellar velocity map (see Fig. 6), similar to the discovery of NGC 7733N by Yadav et al. (2021).
However, the size and prominence of clump 3 in the optical images enforces us to estimate its mass. We measured its mass using the g − r colour following the relation of Bell et al. (2003). By visually inspecting a circular region with a radius of 2.26 arcsec (approximately 1.73 kpc at the distance of NGC 7734), we determined the galactic extinction corrected colour and, hence, the mass to be (3.37 ± 0.44)×107 M⊙. Additionally, it appears red in the g − r colour map with a colour value of 0.826 ± 0.05, indicating that it is not merely a star-forming clump.
Studies of compact elliptical galaxies (cEs) suggest that they have stellar masses of 108 M⊙ − 1010 M⊙ with sizes in the range of 100–900 pc and thus they have very high stellar density (Faber 1973; Choi et al. 2002). These low mass cEs are preferentially observed near the giant galaxies (e.g. the presence of M32-like compact object in the close proximity of the M31 galaxy) (Nieto & Prugniel 1987). A kinematical study of cEs by Ferré-Mateu et al. (2021) shows that the LOS stellar velocity of these galaxies have a maximum value of around 20–60 km s−1. Utilising the GIST workflow on the MUSE data cube as discussed in Sect. 3.4, we derived the LOS stellar kinematics of clump 3. The stellar velocity map is shown in the right panel of Fig. 9. We estimated the median value of LOS velocity of clump 3 by considering a circular region of radius 2.26 arcsec. The velocity value is 26 ± 4 km s−1. Although the estimated stellar mass of clump 3 is slightly less compared to the CEs, it falls in the regime of ultra-compact dwarf galaxies (UCDs). The UCDs have stellar masses of 106 M⊙ − 108 M⊙ with a projected radius of up to 20 pc, making them the most compact galaxies in the Universe (Drinkwater et al. 2000; Brodie et al. 2011). In our analysis, the stellar mass of clump 3 falls in the regime of UCDs, but it is large in size, indicating that it cannot be an UCD. Thus, based on the mass and size of the clump, we can speculate that it is a compact galaxy. Also, the LOS velocity measurement can be contaminated due to the presence of the bar in NGC 7734, which is along the line of nodes of the galaxy, so the LOS velocity measurement associated with clump 3 is limited. It will represent the upper limit of the velocity of clump 3. Hence, the mass and the LOS velocity measurement of clump 3 follow the classification of cEs. Thus, there is a possibility that clump 3 is a compact elliptical galaxy (cE) and it could be the fourth galaxy in this interacting group. We have named it NGC 7734S.
This interaction seems to be the primary factor driving the continuous formation of stars in the central region. Additionally, the effect of this interaction may affect the kinematics (both stellar and gas) of the galaxy centre (despite the galaxy containing a disc-like bulge). These topics are discussed in Sects. 4.1.2 and 4.2.2.
4.4. Bar quenching in an AGN host galaxy
The interaction between galaxies can result in gas exchange and gas inflow towards the central region, triggering the formation of central stars (Di Matteo et al. 2007; Hopkins et al. 2008). While this interaction can also trigger an AGN, it is not the sole cause of AGN activity (Ellison et al. 2011). Some studies have found evidence of mergers associated with AGN activity (Surace et al. 1998; Smirnova et al. 2006; Combes et al. 2009), while others have claimed that statistically there is no evidence of a merger associated with AGN activity, with a similar percentage found in both active and inactive galaxies (Coldwell & Lambas 2006). Conversely, AGN feedback can lead to the cessation of SF in the central region. Jahan-Miri & Khosroshahi (2001) have shown that the nuclei of both galaxies in the NGC 7733-34 galaxy group are redder compared to the other parts of the galaxies, indicating the absence of nuclear starburst activity in the pair.
In this study, we investigate the SF along the bar in NGC 7734 and bar quenching and/or inside-out quenching resulting from AGN activity in NGC 7733 of this interacting system of galaxies. The feedback from an active AGN depletes gas from the central region, leading to the cessation of SF. Studies by Ellison et al. (2018), Bluck et al. (2020) and Lammers et al. (2022) examined central SF suppression (inside-out quenching) in a large sample of MaNGA galaxies. They concluded that AGN feedback suppresses central (kpc-scale) SF in nearby galaxies, it can also cause SF quenching along the bar, known as bar quenching. Additionally, Lammers et al. (2022) demonstrated that AGN feedback could not drive galaxy-wide quenching in our nearby Universe, instead leaving galaxies in the green valley.
Feedback from the active AGN heats the interstellar medium (ISM), preventing the gas from cooling and ceasing the gas inflow towards the centre, suppressing the SF along the bar. This result provides direct observational evidence of AGN feedback suppressing SF. Our findings indicate the absence of SF in the bar of NGC 7733, which appears redder. Notably, NGC 7733 hosts a Seyfert 2 AGN as identified by Yadav et al. (2021). Ongoing interaction with NGC 7733N and NGC 7734 has led to continued SF in the outer ring and spiral arm of NGC 7733. The SFR is higher towards the northern spiral arm, likely due to the presence of NGC 7733N. The lack of SF along the bar could be attributed to the negative feedback from the active AGN.
Strong bars are evident and long and are more frequently associated with the presence of AGNs than weak bars, which are typically smaller and fainter (Garland et al. 2024). Observations suggest that strong bars are more commonly found in quiescent galaxies, contrasting with the weaker bars, indicating that either the presence of a strong bar contributes to the cessation of star formation or that strong bars more readily form in quiescent environments (Géron et al. 2021). A comparison of bar properties in NGC 7733 and NGC 7734 reveals that the bar in NGC 7733 is both longer and stronger. A comprehensive analysis of a sample of interacting galaxies hosting bars and AGNs is necessary to explore the relationship between bar length and strength, star formation, and AGN activity in barred galaxies undergoing close interaction. Such study then can be compared with isolated barred galaxies (Guo et al. 2019). It has been reported that the gas funnelling by the bar towards the centre increases the central SF as well as increases the gas consumption from the disc, and the galaxy turns into quenched from star-forming (Kormendy & Kennicutt 2004; Masters et al. 2010). Géron et al. (2021) have shown that stronger bars help to quench the host galaxies through secular evolution. The system is interacting and we find that NGC 7733 hosts a strong and large bar with SF in the spiral arm and inside-out quenching or bar quenching. Despite having a strong bar, the Hα and FUV emission along the bar is absent in NGC 7733. Thus, negative feedback from an AGN can be a possible scenario of bar quenching in NGC 7733.
5. Summary
In this study, we utilised the MUSE, HST/ACS and DECaLS archival data in conjunction with observations from the UVIT and IRSF to analyse the stellar kinematics, SF, and ionised gas characteristics in the central region as well as along the stellar bar of the triple AGN and interacting system NGC 7733-34. The key findings of our investigation are as follows.
-
The photometric and kinematic analysis shows that NGC 7733 and NGC 7734 have complex structures. The 2D image decomposition shows that both galaxies contain a disc-like bulge. NGC 7734 also contains a central classical bulge inside a disc-like bulge; thereby indicating the possible presence of a composite bulge.
-
A nuclear disc with a semi-major axis of 1.113 kpc has been detected at the centre of NGC 7733, using both photometry and kinematic analysis. The strong anti-correlation between V/σ and h3 indicates the presence of circular orbits in the centre, confirming the photometric discovery of the nuclear disc.
-
We observed an anti-correlation between V/σ and h3 at the centre of NGC 7734, but found no specific nuclear structure; however, we did detect the presence of diffuse light. Our study has identified another red and massive component along the bar of NGC 7734, designated as NGC 7734S. It is likely to be a smaller galaxy that traversed the centre of NGC 7734, resulting in dynamically hotter stellar and gas kinematics, as evidenced by the high stellar and gas velocity dispersion observed. The higher dispersion also supports the presence of a central classical bulge in the galaxy.
-
We also found that both galaxies show ongoing SF using FUV and Hα. NGC 7734 has experienced some recent SF along the bar, but NGC 7733 shows bar quenching. As discussed earlier, we did not present the total SFR estimation in this work because our estimate is in agreement with that of Yadav et al. (2023). However, when comparing the SFR along the bar with the total SFR, we found that the SFR in the bar region dominates the overall SFR in NGC 7734.
-
In NGC 7733, no SFCs were found along the bar. It hosts a Seyfert 2 AGN, which may suggest that the AGN feedback (inside-out feedback) has impacted the central (kpc scale) SF, leading to the suppression of bar-related SF in the galaxy, while not affecting the overall SF in the galaxy.
The above findings present an interesting case of an interacting system involving two barred spiral galaxies, each hosting an AGN. Notably, one of the galaxies exhibits enhanced SF along its bar, while the other shows an absence of such activity. Although numerous studies have investigated the connection between the stellar bar, SF, and AGN, most of these have been conducted for isolated galaxies. Therefore, studying these interacting systems provides valuable insights into the relationship between SF along the bar and AGN activity and the broader evolutionary processes at play within these systems. It underscores the importance of conducting a comprehensive statistical analysis of a larger galaxy sample to improve our understanding of these complex phenomena.
Data availability
UVIT L1 data can be downloaded from https://astrobrowse.issdc.gov.in/astro_archive/archive/Home.jsp. Optical co-added images can be accessed from https://portal.nersc.gov/cfs/cosmo/data/legacysurvey/dr10/south/coadd/355/3554m660/ Optical IFU data cube can be downloaded from http://archive.eso.org/scienceportal/home NIR data can be shared on request.
Acknowledgments
We thank the anonymous referee for the thoughtful review and valuable suggestion, which improved the impact and clarity of this manuscript. We want to thank the anonymous referee for the valuable comments that improved the quality of this work. MD and SB acknowledge the support of the Science and Engineering Research Board (SERB) Core Research Grant CRG/2022/004531 for this research. SK thanks Prof. Arif Babul for the helpful discussions. This paper has used the observations collected at the European Southern Observatory under ESO program 0103.A-0637. This publication uses data from the Indian Space Research Organisation’s (ISRO) AstroSat mission, housed at the Indian Space Science Data Centre (ISSDC). The UVIT data used was processed at IIA by the Payload Operations Centre. The UVIT was developed in collaboration with IIA, IUCAA, TIFR, ISRO, and CSA. This research has also used NIR data from IRSF at the South African Astronomical Observatory (SAAO). This research has made use of NASA/IPAC Extragalactic Database (NED), which is operated by the Jet Propulsion Laboratory, California Institute of Technology (Caltech) under contract with NASA. This research has made use of data obtained with the Dark Energy Camera (DECam), which was constructed by the Dark Energy Survey (DES) collaboration. This research is based on observations made with the NASA/ESA Hubble Space Telescope obtained from the Space Telescope Science Institute, which is operated by the Association of Universities for Research in Astronomy, Inc., under NASA contract NAS 5–26555. These observations are associated with proposal ID 15446.
References
- Abraham, R. G., & Merrifield, M. R. 2000, AJ, 120, 2835 [NASA ADS] [CrossRef] [Google Scholar]
- Agrawal, P. C. 2006, Adv. Space Res., 38, 2989 [Google Scholar]
- Aguerri, J. A. L., Muñoz-Tuñón, C., Varela, A. M., & Prieto, M. 2000a, A&A, 361, 841 [NASA ADS] [Google Scholar]
- Aguerri, J. A. L., Varela, A. M., Prieto, M., & Muñoz-Tuñón, C. 2000b, AJ, 119, 1638 [NASA ADS] [CrossRef] [Google Scholar]
- Aguerri, J. A. L., Méndez-Abreu, J., & Corsini, E. M. 2009, A&A, 495, 491 [NASA ADS] [CrossRef] [EDP Sciences] [Google Scholar]
- Aguerri, J. A. L., Méndez-Abreu, J., Falcón-Barroso, J., et al. 2015, A&A, 576, A102 [NASA ADS] [CrossRef] [EDP Sciences] [Google Scholar]
- Athanassoula, E. 2003, MNRAS, 341, 1179 [Google Scholar]
- Bacon, R., Bauer, S., Boehm, P., et al. 2006, in Ground-based and Airborne Instrumentation for Astronomy, eds. I. S. McLean,& M. Iye, SPIE Conf. Ser., 6269, 62690J [NASA ADS] [CrossRef] [Google Scholar]
- Barazza, F. D., Jogee, S., & Marinova, I. 2008, ApJ, 675, 1194 [Google Scholar]
- Barnes, J. E., & Hernquist, L. 1996, ApJ, 471, 115 [NASA ADS] [CrossRef] [Google Scholar]
- Barway, S., & Saha, K. 2020, MNRAS, 495, 4548 [NASA ADS] [CrossRef] [Google Scholar]
- Barway, S., Mayya, Y. D., & Robleto-Orús, A. 2020, MNRAS, 497, 44 [NASA ADS] [CrossRef] [Google Scholar]
- Belfiore, F., Maiolino, R., Bundy, K., et al. 2015, MNRAS, 449, 867 [NASA ADS] [CrossRef] [Google Scholar]
- Bell, E. F., McIntosh, D. H., Katz, N., & Weinberg, M. D. 2003, ApJS, 149, 289 [Google Scholar]
- Bertin, E., & Arnouts, S. 1996, A&AS, 117, 393 [NASA ADS] [CrossRef] [EDP Sciences] [Google Scholar]
- Bittner, A., Falcón-Barroso, J., Nedelchev, B., et al. 2019, A&A, 628, A117 [NASA ADS] [CrossRef] [EDP Sciences] [Google Scholar]
- Bittner, A., de Lorenzo-Cáceres, A., Gadotti, D. A., et al. 2021, A&A, 646, A42 [NASA ADS] [CrossRef] [EDP Sciences] [Google Scholar]
- Bluck, A. F. L., Maiolino, R., Piotrowska, J. M., et al. 2020, MNRAS, 499, 230 [NASA ADS] [CrossRef] [Google Scholar]
- Brodie, J. P., Romanowsky, A. J., Strader, J., & Forbes, D. A. 2011, AJ, 142, 199 [NASA ADS] [CrossRef] [Google Scholar]
- Buta, R., & Block, D. L. 2001, ApJ, 550, 243 [Google Scholar]
- Calzetti, D., Kennicutt, R. C., Engelbracht, C. W., et al. 2007, ApJ, 666, 870 [Google Scholar]
- Cappellari, M. 2017, MNRAS, 466, 798 [Google Scholar]
- Cappellari, M. 2022, MNRAS, 526, 3273 [Google Scholar]
- Cappellari, M., & Copin, Y. 2003, MNRAS, 342, 345 [Google Scholar]
- Cappellari, M., & Emsellem, E. 2004, PASP, 116, 138 [Google Scholar]
- Cardelli, J. A., Clayton, G. C., & Mathis, J. S. 1989, ApJ, 345, 245 [Google Scholar]
- Choi, P. I., Guhathakurta, P., & Johnston, K. V. 2002, AJ, 124, 310 [NASA ADS] [CrossRef] [Google Scholar]
- Cid Fernandes, R., Stasińska, G., Schlickmann, M. S., et al. 2010, MNRAS, 403, 1036 [Google Scholar]
- Coldwell, G. V., & Lambas, D. G. 2006, MNRAS, 371, 786 [NASA ADS] [CrossRef] [Google Scholar]
- Combes, F., & Gerin, M. 1985, A&A, 150, 327 [NASA ADS] [Google Scholar]
- Combes, F., & Sanders, R. H. 1981, A&A, 96, 164 [NASA ADS] [Google Scholar]
- Combes, F., Baker, A. J., Schinnerer, E., et al. 2009, A&A, 503, 73 [NASA ADS] [CrossRef] [EDP Sciences] [Google Scholar]
- Comerón, S., Knapen, J. H., Beckman, J. E., et al. 2010, MNRAS, 402, 2462 [Google Scholar]
- Costantin, L., Corsini, E. M., Méndez-Abreu, J., et al. 2018, MNRAS, 481, 3623 [CrossRef] [Google Scholar]
- de Vaucouleurs, G. 1963, ApJ, 138, 934 [NASA ADS] [CrossRef] [Google Scholar]
- Dey, A., Schlegel, D. J., Lang, D., et al. 2019, AJ, 157, 168 [Google Scholar]
- Díaz-García, S., Salo, H., & Laurikainen, E. 2016, A&A, 596, A84 [NASA ADS] [CrossRef] [EDP Sciences] [Google Scholar]
- Díaz-García, S., Moyano, F. D., Comerón, S., et al. 2020, A&A, 644, A38 [NASA ADS] [CrossRef] [EDP Sciences] [Google Scholar]
- Di Matteo, P., Combes, F., Melchior, A. L., & Semelin, B. 2007, A&A, 468, 61 [NASA ADS] [CrossRef] [EDP Sciences] [Google Scholar]
- Drinkwater, M. J., Jones, J. B., Gregg, M. D., & Phillipps, S. 2000, PASA, 17, 227 [Google Scholar]
- Ellison, S. L., Patton, D. R., Simard, L., & McConnachie, A. W. 2008, AJ, 135, 1877 [NASA ADS] [CrossRef] [Google Scholar]
- Ellison, S. L., Patton, D. R., Mendel, J. T., & Scudder, J. M. 2011, MNRAS, 418, 2043 [NASA ADS] [CrossRef] [Google Scholar]
- Ellison, S. L., Sánchez, S. F., Ibarra-Medel, H., et al. 2018, MNRAS, 474, 2039 [Google Scholar]
- Elmegreen, B. G., & Elmegreen, D. M. 1985, ApJ, 288, 438 [Google Scholar]
- Erwin, P. 2004, A&A, 415, 941 [NASA ADS] [CrossRef] [EDP Sciences] [Google Scholar]
- Erwin, P., Saglia, R. P., Fabricius, M., et al. 2015, MNRAS, 446, 4039 [Google Scholar]
- Eskridge, P. B., Frogel, J. A., Pogge, R. W., et al. 2000, AJ, 119, 536 [NASA ADS] [CrossRef] [Google Scholar]
- Faber, S. M. 1973, ApJ, 179, 423 [NASA ADS] [CrossRef] [Google Scholar]
- Falcón-Barroso, J., Bacon, R., Bureau, M., et al. 2006, MNRAS, 369, 529 [Google Scholar]
- Ferré-Mateu, A., Durré, M., Forbes, D. A., et al. 2021, MNRAS, 503, 5455 [CrossRef] [Google Scholar]
- Fraser-McKelvie, A., Aragón-Salamanca, A., Merrifield, M., et al. 2020, MNRAS, 495, 4158 [Google Scholar]
- Gadotti, D. A. 2011, MNRAS, 415, 3308 [Google Scholar]
- Gadotti, D. A., Seidel, M. K., Sánchez-Blázquez, P., et al. 2015, A&A, 584, A90 [NASA ADS] [CrossRef] [EDP Sciences] [Google Scholar]
- Garland, I. L., Walmsley, M., Silcock, M. S., et al. 2024, MNRAS, 532, 2320 [NASA ADS] [CrossRef] [Google Scholar]
- Géron, T., Smethurst, R. J., Lintott, C., et al. 2021, MNRAS, 507, 4389 [CrossRef] [Google Scholar]
- Guo, R., Mao, S., Athanassoula, E., et al. 2019, MNRAS, 482, 1733 [Google Scholar]
- Heckman, T. M. 1980, A&A, 87, 152 [Google Scholar]
- Hopkins, P. F., Hernquist, L., Cox, T. J., & Kereš, D. 2008, ApJS, 175, 356 [Google Scholar]
- Horellou, C., & Booth, R. 1997, A&AS, 126, 3 [NASA ADS] [CrossRef] [EDP Sciences] [Google Scholar]
- Jahan-Miri, M., & Khosroshahi, H. G. 2001, AJ, 122, 792 [Google Scholar]
- Jarrett, T. H., Chester, T., Cutri, R., Schneider, S. E., & Huchra, J. P. 2003, AJ, 125, 525 [Google Scholar]
- Jogee, S., Scoville, N., & Kenney, J. D. P. 2005, ApJ, 630, 837 [NASA ADS] [CrossRef] [Google Scholar]
- Kennicutt, R. C. Jr. 1998, ARA&A, 36, 189 [NASA ADS] [CrossRef] [Google Scholar]
- Kennicutt, R. C. Jr., Lee, J. C., Funes, J. G., et al. 2008, ApJS, 178, 247 [NASA ADS] [CrossRef] [Google Scholar]
- Knapen, J. H., Beckman, J. E., Heller, C. H., Shlosman, I., & de Jong, R. S. 1995, ApJ, 454, 623 [NASA ADS] [CrossRef] [Google Scholar]
- Knapen, J. H., Shlosman, I., & Peletier, R. F. 2000, ApJ, 529, 93 [NASA ADS] [CrossRef] [Google Scholar]
- Kormendy, J., & Kennicutt, R. C. Jr. 2004, ARA&A, 42, 603 [Google Scholar]
- Krist, J. E., Hook, R. N., & Stoehr, F. 2011, in Optical Modeling and Performance Predictions, ed. M. A. Kahan, SPIE Conf. Ser., 8127, 81270J [NASA ADS] [CrossRef] [Google Scholar]
- Kruk, S. J., Lintott, C. J., Bamford, S. P., et al. 2018, MNRAS, 473, 4731 [Google Scholar]
- Lammers, C., Iyer, K. G., Ibarra-Medel, H., et al. 2022, ArXiv e-prints [arXiv:2212.00762] [Google Scholar]
- Laurikainen, E., & Salo, H. 2002, MNRAS, 337, 1118 [Google Scholar]
- Laurikainen, E., Salo, H., & Rautiainen, P. 2002, MNRAS, 331, 880 [CrossRef] [Google Scholar]
- Laurikainen, E., Salo, H., Buta, R., & Knapen, J. H. 2007, MNRAS, 381, 401 [Google Scholar]
- Leroy, A. K., Walter, F., Brinks, E., et al. 2008, AJ, 136, 2782 [Google Scholar]
- Lin, L., Li, C., He, Y., Xiao, T., & Wang, E. 2017, ApJ, 838, 105 [NASA ADS] [CrossRef] [Google Scholar]
- Masters, K. L., Mosleh, M., Romer, A. K., et al. 2010, MNRAS, 405, 783 [NASA ADS] [Google Scholar]
- Masters, K. L., Nichol, R. C., Hoyle, B., et al. 2011, MNRAS, 411, 2026 [Google Scholar]
- McGaugh, S. S., & Schombert, J. M. 2014, AJ, 148, 77 [Google Scholar]
- Méndez-Abreu, J., Debattista, V. P., Corsini, E. M., & Aguerri, J. A. L. 2014, A&A, 572, A25 [NASA ADS] [CrossRef] [EDP Sciences] [Google Scholar]
- Menéndez-Delmestre, K., Sheth, K., Schinnerer, E., Jarrett, T. H., & Scoville, N. Z. 2007, ApJ, 657, 790 [Google Scholar]
- Michel-Dansac, L., & Wozniak, H. 2006, A&A, 452, 97 [NASA ADS] [CrossRef] [EDP Sciences] [Google Scholar]
- Mihos, J. C., & Hernquist, L. 1996, ApJ, 464, 641 [Google Scholar]
- Monreal-Ibero, A., Arribas, S., & Colina, L. 2006, ApJ, 637, 138 [Google Scholar]
- Monreal-Ibero, A., Arribas, S., Colina, L., et al. 2010, A&A, 517, A28 [NASA ADS] [CrossRef] [EDP Sciences] [Google Scholar]
- Nagayama, T., Nagashima, C., Nakajima, Y., et al. 2003, in Instrument Design and Performance for Optical/Infrared Ground-based Telescopes, eds. M. Iye, & A. F. M. Moorwood, SPIE Conf. Ser., 4841, 459 [Google Scholar]
- Nair, P. B., & Abraham, R. G. 2010, ApJS, 186, 427 [Google Scholar]
- Nieto, J. L., & Prugniel, P. 1987, A&A, 186, 30 [NASA ADS] [Google Scholar]
- Oh, S., Colless, M., D’Eugenio, F., et al. 2022, MNRAS, 512, 1765 [NASA ADS] [CrossRef] [Google Scholar]
- Ohta, K., Hamabe, M., & Wakamatsu, K.-I. 1990, ApJ, 357, 71 [Google Scholar]
- Peng, C. Y., Ho, L. C., Impey, C. D., & Rix, H.-W. 2002, AJ, 124, 266 [Google Scholar]
- Peng, C. Y., Ho, L. C., Impey, C. D., & Rix, H.-W. 2010, AJ, 139, 2097 [Google Scholar]
- Pogge, R. W., & Martini, P. 2002, ApJ, 569, 624 [CrossRef] [Google Scholar]
- Querejeta, M., Schinnerer, E., Meidt, S., et al. 2021, A&A, 656, A133 [NASA ADS] [CrossRef] [EDP Sciences] [Google Scholar]
- Regan, M. W., & Teuben, P. J. 2004, ApJ, 600, 595 [NASA ADS] [CrossRef] [Google Scholar]
- Sakamoto, K., Okumura, S. K., Ishizuki, S., & Scoville, N. Z. 1999, ApJ, 525, 691 [NASA ADS] [CrossRef] [Google Scholar]
- Sarzi, M., Falcón-Barroso, J., Davies, R. L., et al. 2006, MNRAS, 366, 1151 [Google Scholar]
- Scudder, J. M., Ellison, S. L., Torrey, P., Patton, D. R., & Mendel, J. T. 2012, MNRAS, 426, 549 [NASA ADS] [CrossRef] [Google Scholar]
- Shlosman, I., Peletier, R. F., & Knapen, J. H. 2000, ApJ, 535, L83 [NASA ADS] [CrossRef] [Google Scholar]
- Smirnova, A. A., Moiseev, A. V., & Afanasiev, V. L. 2006, Astron. Lett., 32, 520 [NASA ADS] [CrossRef] [Google Scholar]
- Surace, J. A., Sanders, D. B., Vacca, W. D., Veilleux, S., & Mazzarella, J. M. 1998, ApJ, 492, 116 [NASA ADS] [CrossRef] [Google Scholar]
- Vika, M., Bamford, S. P., Häußler, B., et al. 2013, MNRAS, 435, 623 [NASA ADS] [CrossRef] [Google Scholar]
- Vika, M., Bamford, S. P., Häußler, B., & Rojas, A. L. 2014, MNRAS, 444, 3603 [NASA ADS] [CrossRef] [Google Scholar]
- Wozniak, H., Friedli, D., Martinet, L., Martin, P., & Bratschi, P. 1995, A&AS, 111, 115 [NASA ADS] [Google Scholar]
- Wozniak, H., Combes, F., Emsellem, E., & Friedli, D. 2003, A&A, 409, 469 [NASA ADS] [CrossRef] [EDP Sciences] [Google Scholar]
- Yadav, J., Das, M., Barway, S., & Combes, F. 2021, A&A, 651, L9 [NASA ADS] [CrossRef] [EDP Sciences] [Google Scholar]
- Yadav, J., Das, M., Barway, S., & Combes, F. 2023, MNRAS, 526, 198 [Google Scholar]
- Young, J. S. 1993, Star Formation, Galaxies and the Interstellar Medium (Cambridge: Cambridge University Press) [Google Scholar]
Appendix A: Star formation in different regions of NGC 7734
As discussed in Sect. 4.1, the SF within the galaxy group NGC 7733-34 has been analysed by Yadav et al. (2023). They have identified SFCs in the FUV and Hα images of NGC 7733 and NGC 7734, estimating the SFR and ΣSFR for these emissions in both galaxies. Notably, no SFCs are observed along the bar of NGC 7733. In contrast, recent SF is detected along the bar of NGC 7734 in both the FUV and Hα images.
The identified SFCs in FUV (left) and Hα (right) image of NGC 7734 are shown in Fig. A.1. We have divided the galaxy into three sub-regions as discussed in Sect. 4.1. Within these regions, we have estimated the extinction-corrected SFR in FUV and Hα using the relations given in Sect. 3.5. We divided each clump’s SFR by its area to get an estimate of ΣSFR. The number of clumps in each region along with the ΣSFR is tabulated in Table A.1. We compared ΣSFR for FUV and Hα emission for the three sub-regional clumps. In Fig. A.2, this comparison is shown.
The left panel of Fig. A.2 presents the histogram plot of log ΣSFR for FUV emission. It illustrates the log ΣSFR distribution for the outer ring, inner ring, and central areas, respectively, from top to bottom. Our analysis indicates a similarity between the distribution of SFCs and the median values of log ΣSFR (refer to Table A.1), despite there being fewer clumps in the central region compared to the inner and outer rings. Moreover, we observed increased FUV emission at the bar end, leading to high SF. Consequently, the inner ring exhibited a slightly elevated ΣSFR compared to the outer ring and central region.
The right panel of Fig. A.2 showcases the histogram plot of log ΣSFR for Hα emission, presenting the log ΣSFR distribution for the outer ring, inner ring, and central region from top to bottom, respectively. It’s noteworthy that the central region has a notably high SF compared to the inner and outer rings. Given that Hα emission traces the SF of around 10 Myr, there is recent SF activity in the central region of NGC 7734, consistent with the presence of FUV emission.
The enhanced SF observed along the bar of NGC 7734 may be attributable to the current interaction with NGC 7733 or a past collision with NGC 7734S. It is well-established that galaxy mergers facilitate gas inflows towards the central regions, thereby initiating starburst activity (Di Matteo et al. 2007; Hopkins et al. 2008). Additionally, the non-axisymmetric gravitational potential of the bar plays a crucial role in channelling gas towards the central region, consequently enabling SF.
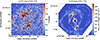 |
Fig. A.1. Identification of SFCs in FUV and Hα image of NGC 7734. Left panel: FUV image of NGC 7734 from UVIT. Right panel: Hα narrow band image of NGC 7734 from MUSE. The regions marked in black are the star-forming regions identified using SExtractor. North is up, and east is to the left. |
SFCs identified in different regions of FUV and Hα image of NGC 7734 and the corresponding median value of log ΣSFR.
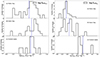 |
Fig. A.2. Histogram plot of SFR density in logarithmic scale (log ΣSFR) of FUV (left) and Hα (right) emission in different regions of NGC 7734. Left panel: (a) log ΣSFR for outer ring, (b) log ΣSFR for inner ring and (c) log ΣSFR for central region/bar for FUV emission. Right panel: (a) log ΣSFR for outer ring, (b) log ΣSFR for the inner ring, and (c) log ΣSFR for the central region and bar for Hα emission. The blue dashed line represents the median value of log ΣSFR in all plots and is tabulated in Table A.1. |
All Tables
Properties of three components (bulge, bar and disc) of NGC 7733 and NGC 7734 in J and Ks band images. Re is the effective radius in kpc for the bulge and bar, Rs is the disc scale length in kpc, M is absolute magnitude, n is the Sersic index, fbar is the bar strength as measured from deprojected images, and M* is the stellar mass, estimated for all three component using the Ks band mass-to-light ratio, M/L = 0.6 (McGaugh & Schombert 2014).
SFCs identified in different regions of FUV and Hα image of NGC 7734 and the corresponding median value of log ΣSFR.
All Figures
|
Fig. 1. Colour image of the NGC 7733-34 galaxy group taken by NASA’s Hubble Space Telescope. The three galaxies NGC 7733, NGC 7733N, and NGC 7734 are marked in this image. Also, the clump present along the bar of NGC 7734 is marked here and is discussed in Sect. 4.3. |
| In the text | |
|
Fig. 2. Output of the GALFIT model along with the azimuthally-averaged surface brightness profile of NGC 7733 (top panel) and NGC 7734 (bottom panel) is shown. In both the top and bottom panels, figure (a) is the J-band image of the galaxies; (b) is the model image and (c) represents the residual obtained from the GALFIT modelling. The parameters of the models of NGC 7733 and NGC 7734 are tabulated in Table 1. The results of ellipse fitting are presented in figure (d). Azimuthally averaged surface brightness of the best-fitted ellipse plotted as a function of the semi-major axis of the ellipse (solid dots), here the error bars represent the rms error of the intensity measured along each fitted isophote. The surface brightness profile is decomposed into two Sersic and one exponential component (in both the panels), a bulge (red dashed), a bar (magenta dashed) and a disc (blue dashed). The sum of these three components is shown by a black solid line. The clump is marked in the residual image in (c) of the bottom panel. North is up, and east is to the left. |
| In the text | |
|
Fig. 3. F606W filter image of the central 6 arcsec × 6 arcsec region of NGC 7734. The contour is overlaid in the image to show the presence of central very central circular contours. At the distance of NGC 7734, 1 arcsec = 766 pc. North is up, and east is to the left. |
| In the text | |
|
Fig. 4. F606W filter images from ACS/HST of NGC 7733 (top) and NGC 7734 (bottom) are shown, along with the structure maps of the central regions for both galaxies. For NGC 7733, the structure map is zoomed in to cover the central 8 × 8 arcsec2, revealing a visible central disc-like structure with a semi-major axis of 1.515 arcsec. At the distance of NGC 7733, 1 arcsec = 737 pc. In contrast, the structure map for NGC 7734 is zoomed in to cover the central 6 × 6 arcsec2, showing a diffuse structure in the centre. The clump present along the bar of NGC 7734 is marked here and has been discussed in Sect. 4.3. At the distance of NGC 7734, 1 arcsec = 766 pc. North is up, and east is to the left. |
| In the text | |
|
Fig. 5. Stellar kinematic maps of NGC 7733. Left panel: stellar velocity (V), velocity dispersion (σ), V/σ, and h3 as indicated. The isophotes, equally spaced in 0.15 mag steps, are derived from MUSE intensity maps. Colour bars beside each map indicate the parameter ranges. The black circle on the velocity map marks the bulge, with a radius equal to the bulge effective radius from photometric decomposition using the Ks band NIR image, as detailed in Table 1. Here, 1 arcsec = 737 pc. North is up, and east is to the left. Right panel: h3 vs. V/σ plot for each Voronoi bin. Red circles denote bins within the bulge effective radius (inside the black circle on the velocity map), while grey points represent bins for the entire galaxy. |
| In the text | |
|
Fig. 6. Stellar kinematic maps of NGC 7734. Left panel: stellar velocity (V), velocity dispersion (σ), V/σ, and h3, as labelled. The isophotes are evenly spaced in intervals of 0.15 mag, derived from MUSE intensity maps. Colour bars next to each map indicate the range of values for each parameter. The black circle on the velocity map denotes the bulge, with a radius equal to the bulge effective radius obtained from photometric decomposition using Ks band NIR imaging, detailed in Table 1. Here, 1 arcsec = 766 pc. North is up, and east is to the left. Right panel: h3 vs. V/σ plot for each Voronoi bin. The red circles represent bins within the bulge effective radius (inside the black circle on the velocity map), while grey points denote bins across the entire galaxy. |
| In the text | |
|
Fig. 7. Gas (Hα) intensity & kinematic maps of NGC 7733 (top panel) and NGC 7734 (bottom panel). (a) represents the gas intensity map, (b) shows the gas velocity map, and (c) displays the gas velocity dispersion map for NGC 7733 (top panel) and NGC 7734 (bottom panel). The isophotes are equally spaced in intervals of 0.15 mag and are derived from the MUSE intensity maps. The colour bars beside each map indicate the range of the parameters. The black circle on the intensity map marks the bulge, with its radius equal to the bulge effective radius derived from photometric decomposition using Ks band NIR image, as specified in Table 1. At the distance of NGC 7733, 1 arcsec = 737 pc, whereas, at the distance of NGC 7734, 1 arcsec = 766 pc. North is up, and east is to the left. |
| In the text | |
|
Fig. 8. FUV, Hα and NIR bar PA comparison. Left panel: FUV image of NGC 7734 from UVIT. Right panel: Hα narrow-band image of NGC 7734 from MUSE. The red dashed line in each image is the bar PA, as estimated from isophotal analysis based on the J-band image and the blue solid circle of a radius of 1 arcsec represents the photometric centre of the galaxy. Each image frame covers an area of 70 × 70 arcsec2. North is up, and east is to the left. |
| In the text | |
|
Fig. 9. Properties of clump present along the bar of NGC 7734. Left panel: g − r colour image of NGC 7734 bar with g-band contours overlaid. The clumpy nature of the bar in the optical image is marked here. Clump 2 represents the centre of NGC 7734, whereas the red clump present along the bar is highlighted as clump 3. The other two clumps (clumps 1 ⩕ 4) are present at the bar ends. The blank spaces in the g − r colour image are due to less S/N in those regions. Right panel: Spectra corresponding to the bulge (black) and clump 3 (blue) as shown in left panel are presented here. The spectra around [N II] and Hα line are enhanced and are shown at the right corner. All the lines are modelled using Gaussian profiles and the observed wavelength of each line is mentioned. These lines are used to estimate the redshift of the clump present along the bar. The LOS stellar velocity map of clump 3 is also shown in the right panel. We derived the LOS velocity using the GIST Pipeline as discussed in Sect. 3.4. |
| In the text | |
|
Fig. A.1. Identification of SFCs in FUV and Hα image of NGC 7734. Left panel: FUV image of NGC 7734 from UVIT. Right panel: Hα narrow band image of NGC 7734 from MUSE. The regions marked in black are the star-forming regions identified using SExtractor. North is up, and east is to the left. |
| In the text | |
|
Fig. A.2. Histogram plot of SFR density in logarithmic scale (log ΣSFR) of FUV (left) and Hα (right) emission in different regions of NGC 7734. Left panel: (a) log ΣSFR for outer ring, (b) log ΣSFR for inner ring and (c) log ΣSFR for central region/bar for FUV emission. Right panel: (a) log ΣSFR for outer ring, (b) log ΣSFR for the inner ring, and (c) log ΣSFR for the central region and bar for Hα emission. The blue dashed line represents the median value of log ΣSFR in all plots and is tabulated in Table A.1. |
| In the text | |
Current usage metrics show cumulative count of Article Views (full-text article views including HTML views, PDF and ePub downloads, according to the available data) and Abstracts Views on Vision4Press platform.
Data correspond to usage on the plateform after 2015. The current usage metrics is available 48-96 hours after online publication and is updated daily on week days.
Initial download of the metrics may take a while.