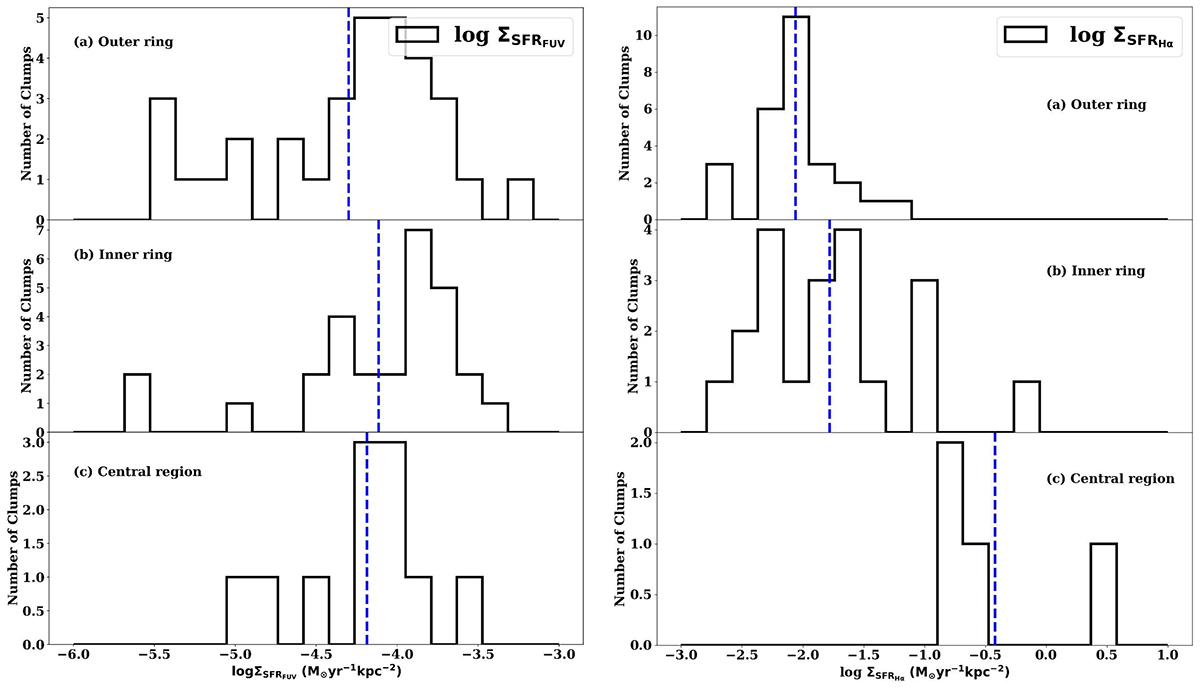
Fig. A.2.
Download original image
Histogram plot of SFR density in logarithmic scale (log ΣSFR) of FUV (left) and Hα (right) emission in different regions of NGC 7734. Left panel: (a) log ΣSFR for outer ring, (b) log ΣSFR for inner ring and (c) log ΣSFR for central region/bar for FUV emission. Right panel: (a) log ΣSFR for outer ring, (b) log ΣSFR for the inner ring, and (c) log ΣSFR for the central region and bar for Hα emission. The blue dashed line represents the median value of log ΣSFR in all plots and is tabulated in Table A.1.
Current usage metrics show cumulative count of Article Views (full-text article views including HTML views, PDF and ePub downloads, according to the available data) and Abstracts Views on Vision4Press platform.
Data correspond to usage on the plateform after 2015. The current usage metrics is available 48-96 hours after online publication and is updated daily on week days.
Initial download of the metrics may take a while.