Fig. 2.
Download original image
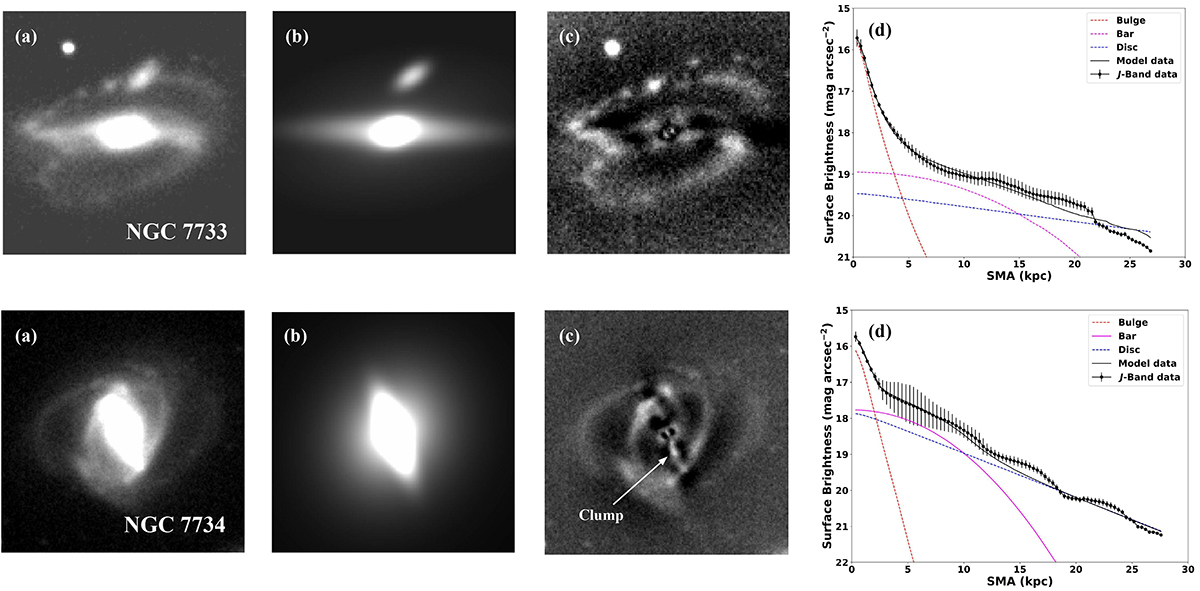
Output of the GALFIT model along with the azimuthally-averaged surface brightness profile of NGC 7733 (top panel) and NGC 7734 (bottom panel) is shown. In both the top and bottom panels, figure (a) is the J-band image of the galaxies; (b) is the model image and (c) represents the residual obtained from the GALFIT modelling. The parameters of the models of NGC 7733 and NGC 7734 are tabulated in Table 1. The results of ellipse fitting are presented in figure (d). Azimuthally averaged surface brightness of the best-fitted ellipse plotted as a function of the semi-major axis of the ellipse (solid dots), here the error bars represent the rms error of the intensity measured along each fitted isophote. The surface brightness profile is decomposed into two Sersic and one exponential component (in both the panels), a bulge (red dashed), a bar (magenta dashed) and a disc (blue dashed). The sum of these three components is shown by a black solid line. The clump is marked in the residual image in (c) of the bottom panel. North is up, and east is to the left.
Current usage metrics show cumulative count of Article Views (full-text article views including HTML views, PDF and ePub downloads, according to the available data) and Abstracts Views on Vision4Press platform.
Data correspond to usage on the plateform after 2015. The current usage metrics is available 48-96 hours after online publication and is updated daily on week days.
Initial download of the metrics may take a while.