Fig. 9.
Download original image
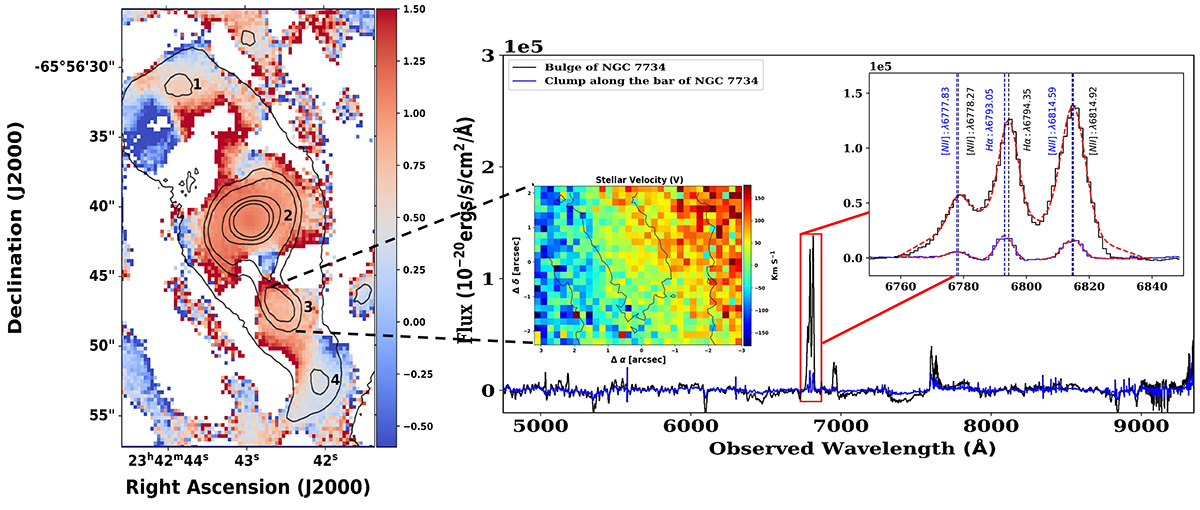
Properties of clump present along the bar of NGC 7734. Left panel: g − r colour image of NGC 7734 bar with g-band contours overlaid. The clumpy nature of the bar in the optical image is marked here. Clump 2 represents the centre of NGC 7734, whereas the red clump present along the bar is highlighted as clump 3. The other two clumps (clumps 1 ⩕ 4) are present at the bar ends. The blank spaces in the g − r colour image are due to less S/N in those regions. Right panel: Spectra corresponding to the bulge (black) and clump 3 (blue) as shown in left panel are presented here. The spectra around [N II] and Hα line are enhanced and are shown at the right corner. All the lines are modelled using Gaussian profiles and the observed wavelength of each line is mentioned. These lines are used to estimate the redshift of the clump present along the bar. The LOS stellar velocity map of clump 3 is also shown in the right panel. We derived the LOS velocity using the GIST Pipeline as discussed in Sect. 3.4.
Current usage metrics show cumulative count of Article Views (full-text article views including HTML views, PDF and ePub downloads, according to the available data) and Abstracts Views on Vision4Press platform.
Data correspond to usage on the plateform after 2015. The current usage metrics is available 48-96 hours after online publication and is updated daily on week days.
Initial download of the metrics may take a while.