Fig. 8.
Download original image
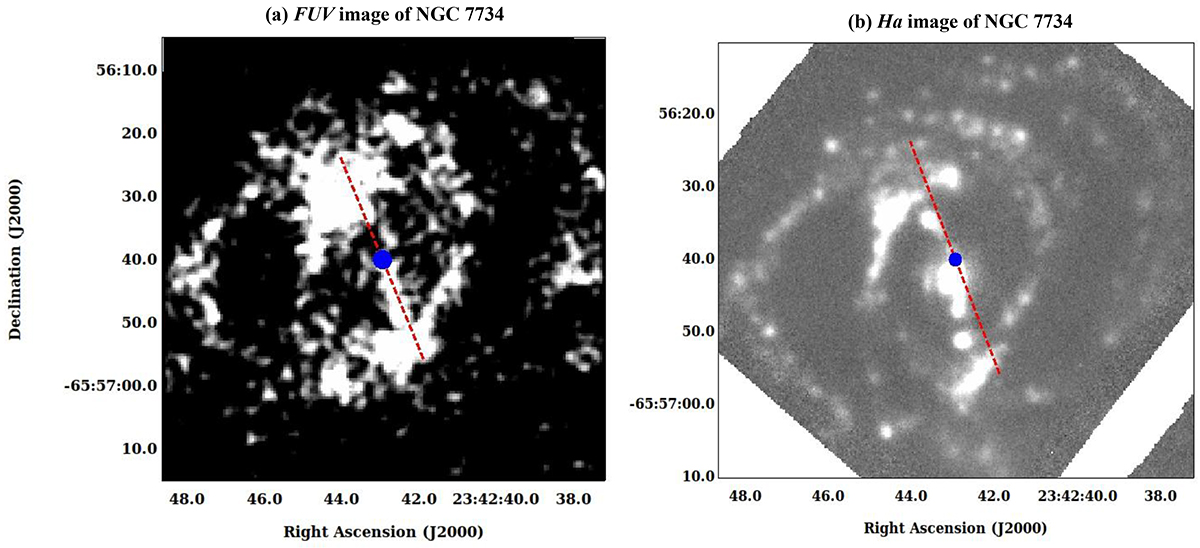
FUV, Hα and NIR bar PA comparison. Left panel: FUV image of NGC 7734 from UVIT. Right panel: Hα narrow-band image of NGC 7734 from MUSE. The red dashed line in each image is the bar PA, as estimated from isophotal analysis based on the J-band image and the blue solid circle of a radius of 1 arcsec represents the photometric centre of the galaxy. Each image frame covers an area of 70 × 70 arcsec2. North is up, and east is to the left.
Current usage metrics show cumulative count of Article Views (full-text article views including HTML views, PDF and ePub downloads, according to the available data) and Abstracts Views on Vision4Press platform.
Data correspond to usage on the plateform after 2015. The current usage metrics is available 48-96 hours after online publication and is updated daily on week days.
Initial download of the metrics may take a while.