Fig. 6.
Download original image
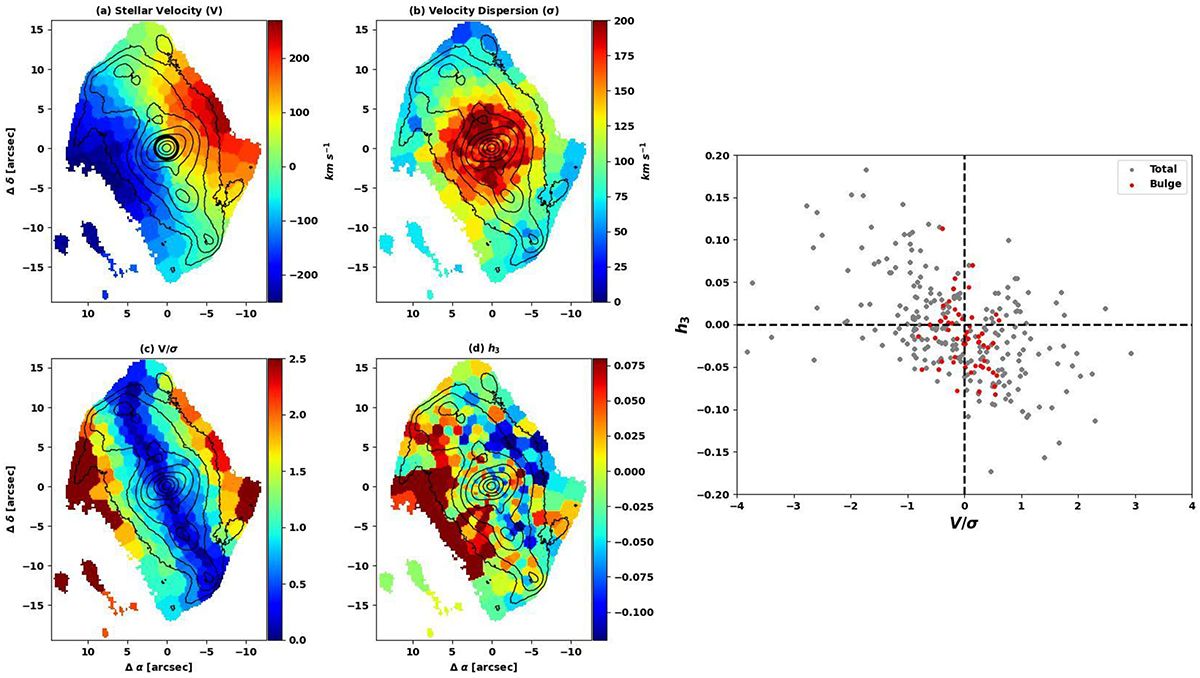
Stellar kinematic maps of NGC 7734. Left panel: stellar velocity (V), velocity dispersion (σ), V/σ, and h3, as labelled. The isophotes are evenly spaced in intervals of 0.15 mag, derived from MUSE intensity maps. Colour bars next to each map indicate the range of values for each parameter. The black circle on the velocity map denotes the bulge, with a radius equal to the bulge effective radius obtained from photometric decomposition using Ks band NIR imaging, detailed in Table 1. Here, 1 arcsec = 766 pc. North is up, and east is to the left. Right panel: h3 vs. V/σ plot for each Voronoi bin. The red circles represent bins within the bulge effective radius (inside the black circle on the velocity map), while grey points denote bins across the entire galaxy.
Current usage metrics show cumulative count of Article Views (full-text article views including HTML views, PDF and ePub downloads, according to the available data) and Abstracts Views on Vision4Press platform.
Data correspond to usage on the plateform after 2015. The current usage metrics is available 48-96 hours after online publication and is updated daily on week days.
Initial download of the metrics may take a while.