Open Access
Fig. 4.
Download original image
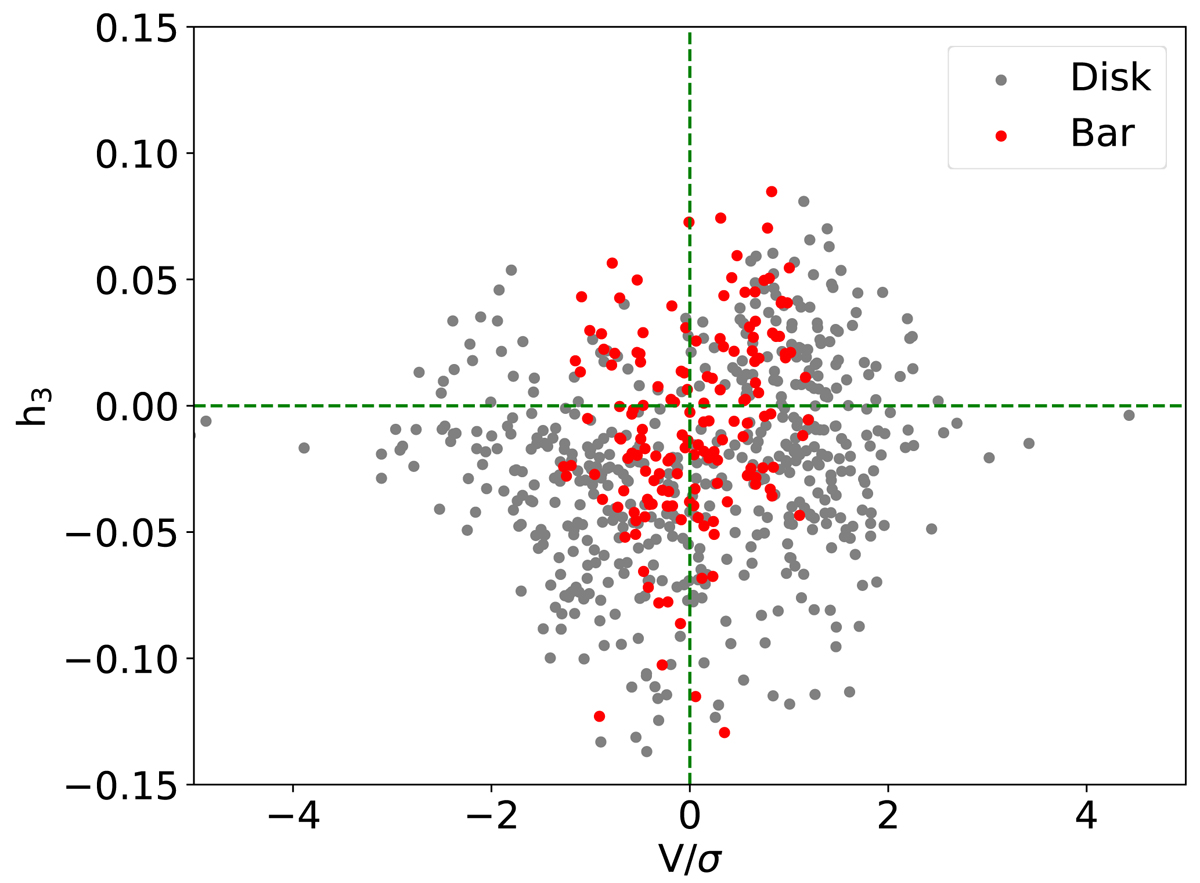
Measured V/σ and h3 of each Voronoi bin for the inner region of the Cartwheel. The grey dots denote the bins that are part of the disc, while the bins belonging to the bar (i.e. those within the dotted ellipse shown in Fig. 2) are shown in red.
Current usage metrics show cumulative count of Article Views (full-text article views including HTML views, PDF and ePub downloads, according to the available data) and Abstracts Views on Vision4Press platform.
Data correspond to usage on the plateform after 2015. The current usage metrics is available 48-96 hours after online publication and is updated daily on week days.
Initial download of the metrics may take a while.