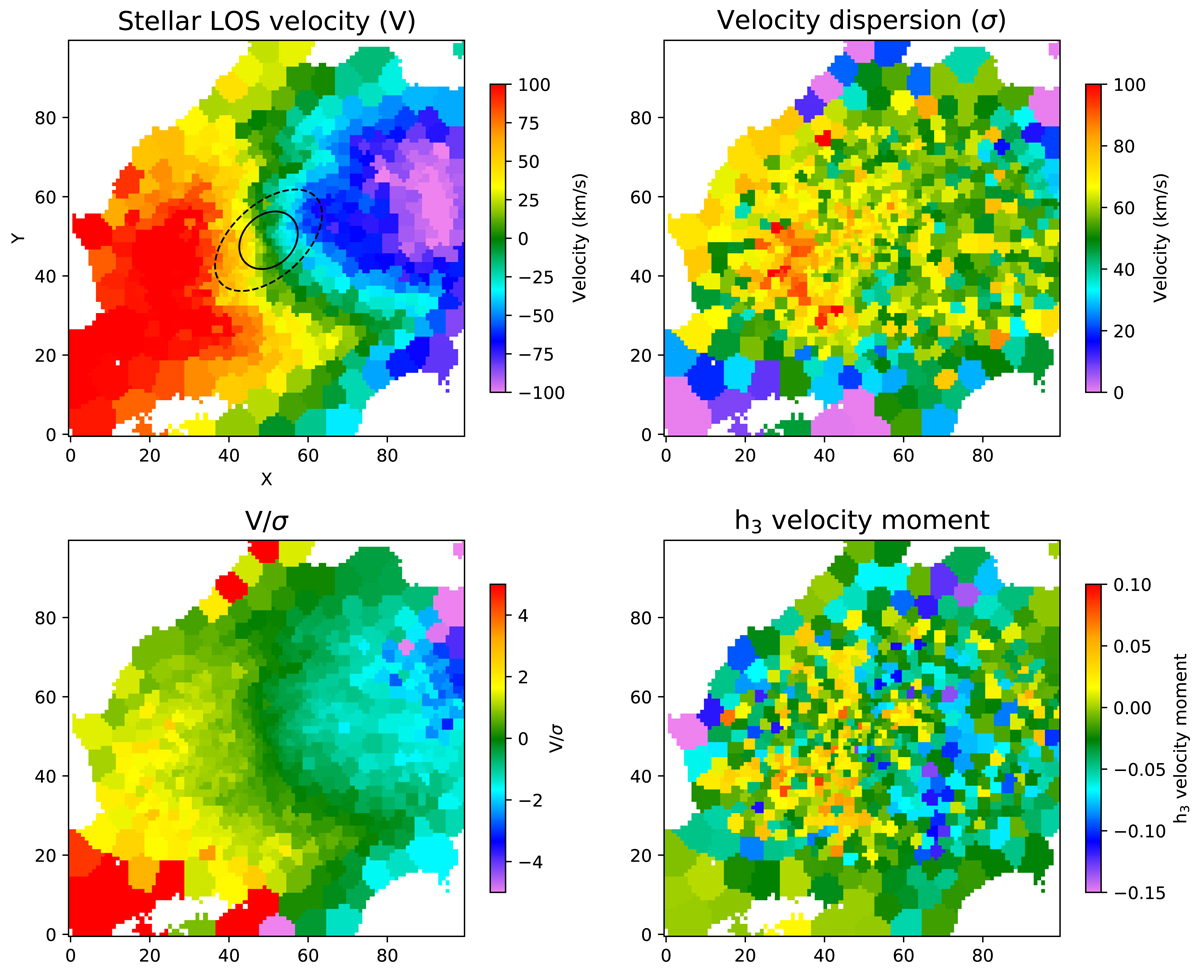
Fig. 2.
Download original image
Stellar kinematic maps of the Cartwheel. Top left: stellar LOS velocity (V) distribution for the inner region (shown by the blue rectangle in Fig. 1) of the Cartwheel produced using the GIST pipeline on the MUSE data cube. Ellipses shown in dashed and solid black lines indicate the bar and bulge of the galaxy, respectively, as reported in Barway et al. (2020). North is up, and east is to the left. The stellar velocity dispersion (σ; top right), V/σ (bottom left), and h3 velocity moment (bottom right) maps are also shown for the same part of the galaxy.
Current usage metrics show cumulative count of Article Views (full-text article views including HTML views, PDF and ePub downloads, according to the available data) and Abstracts Views on Vision4Press platform.
Data correspond to usage on the plateform after 2015. The current usage metrics is available 48-96 hours after online publication and is updated daily on week days.
Initial download of the metrics may take a while.