Fig. 6.
Download original image
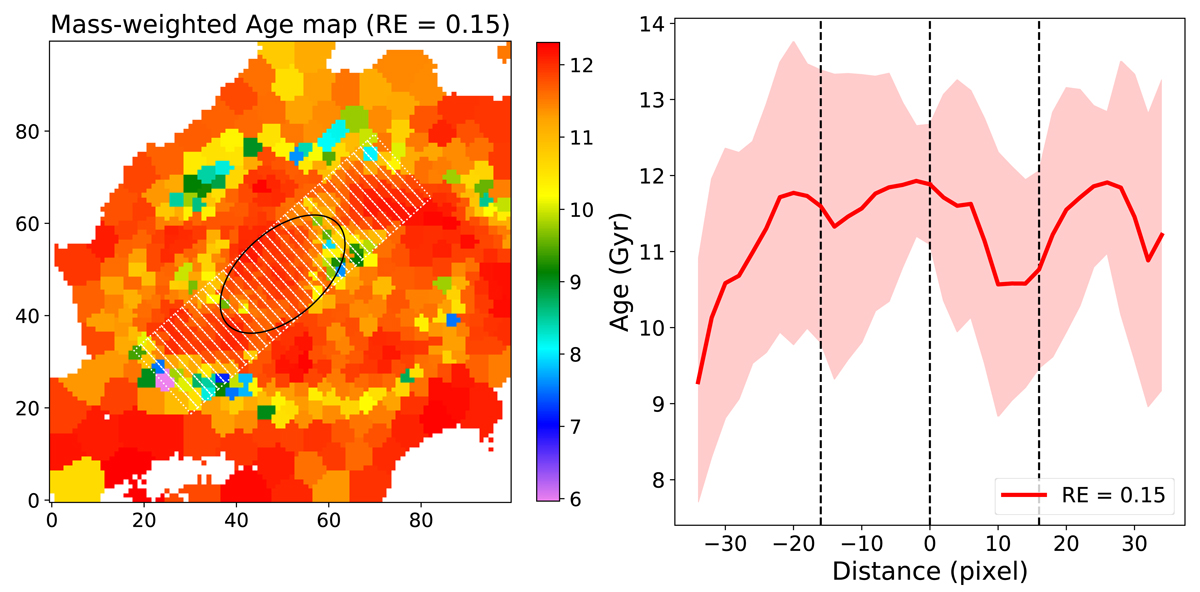
Spatial mass-weighted age map for the inner region of the Cartwheel. The age map is derived from the binned MUSE cube for REGUL_ERR (RE) = 0.15. The extent of the bar is shown with a black ellipse. Right: age profile plotted along the rectangular slit (dotted white lines) shown in the left panel. The vertical dashed black line at the centre signifies the position of the minor axis, whereas those on either side highlight the bar ends. The red shaded region shows the mean difference of the derived age values as estimated from four different regularisations (i.e. RE = 0.15, 0.45, 1.0, and 5.0). The value of the mean age difference for the entire profile is ∼1.5 Gyr. The age of the stellar populations in the bar is constrained to within ∼9−13 Gyr.
Current usage metrics show cumulative count of Article Views (full-text article views including HTML views, PDF and ePub downloads, according to the available data) and Abstracts Views on Vision4Press platform.
Data correspond to usage on the plateform after 2015. The current usage metrics is available 48-96 hours after online publication and is updated daily on week days.
Initial download of the metrics may take a while.