Fig. 3.
Download original image
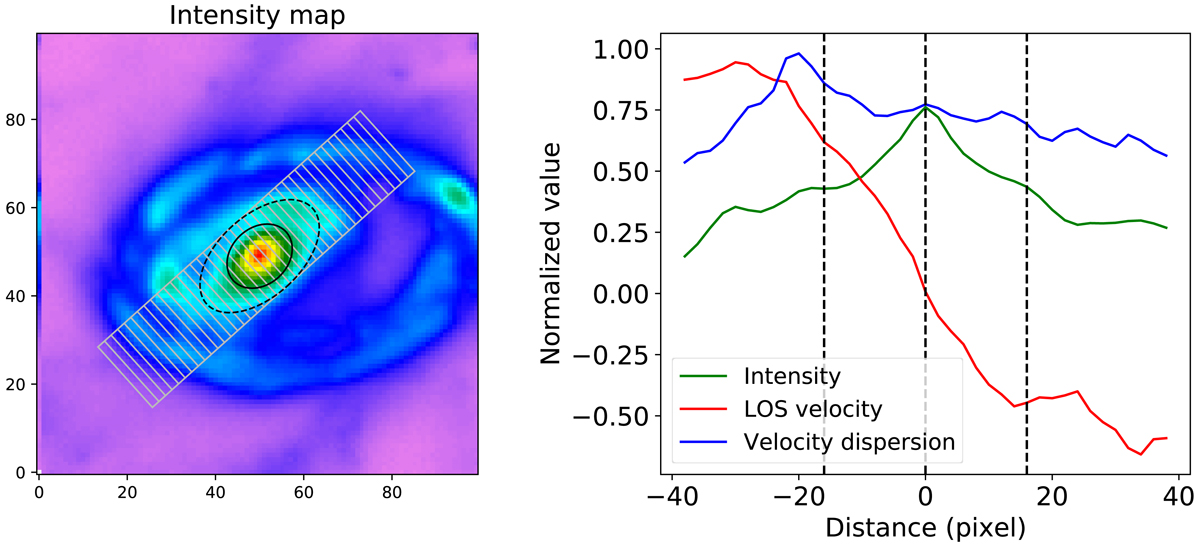
Intensity, LOS velocity, and velocity dispersion profiles of the Cartwheel’s bar. Left: intensity map for the inner region of the Cartwheel. The extent of the bar and bulge are shown by ellipses, as in Fig. 2. Right: intensity, LOS velocity, and velocity dispersion profiles along the grey rectangular pseudo-slit shown in the left panel. The vertical dashed black line at the centre signifies the position of the minor axis, whereas those on either side highlight the bar ends.
Current usage metrics show cumulative count of Article Views (full-text article views including HTML views, PDF and ePub downloads, according to the available data) and Abstracts Views on Vision4Press platform.
Data correspond to usage on the plateform after 2015. The current usage metrics is available 48-96 hours after online publication and is updated daily on week days.
Initial download of the metrics may take a while.