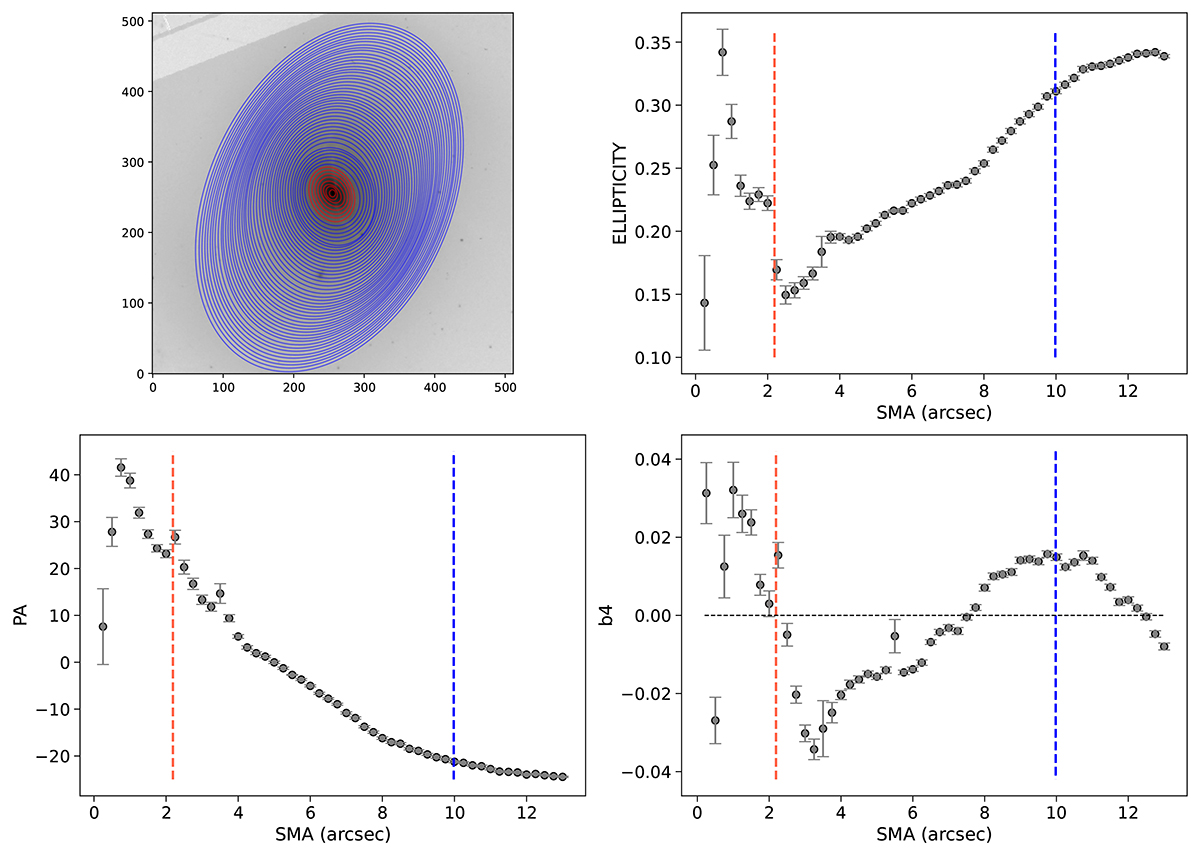
Fig. A.2.
Download original image
Results derived using the IRAF ELLIPSE package on the HST F814W band image of the galaxy. The fit ellipses are shown in blue on the HST F814W band image (top left). The ellipticity, PA, and the Fourier coefficient b4 of the fit ellipses with the length of their semi-major axes are shown in the top right, bottom left, and bottom right panels, respectively. The vertical red and blue dashed lines, shown in these three profiles, mark the extent of the detected inner and outer components, respectively.
Current usage metrics show cumulative count of Article Views (full-text article views including HTML views, PDF and ePub downloads, according to the available data) and Abstracts Views on Vision4Press platform.
Data correspond to usage on the plateform after 2015. The current usage metrics is available 48-96 hours after online publication and is updated daily on week days.
Initial download of the metrics may take a while.