Fig. C.1.
Download original image
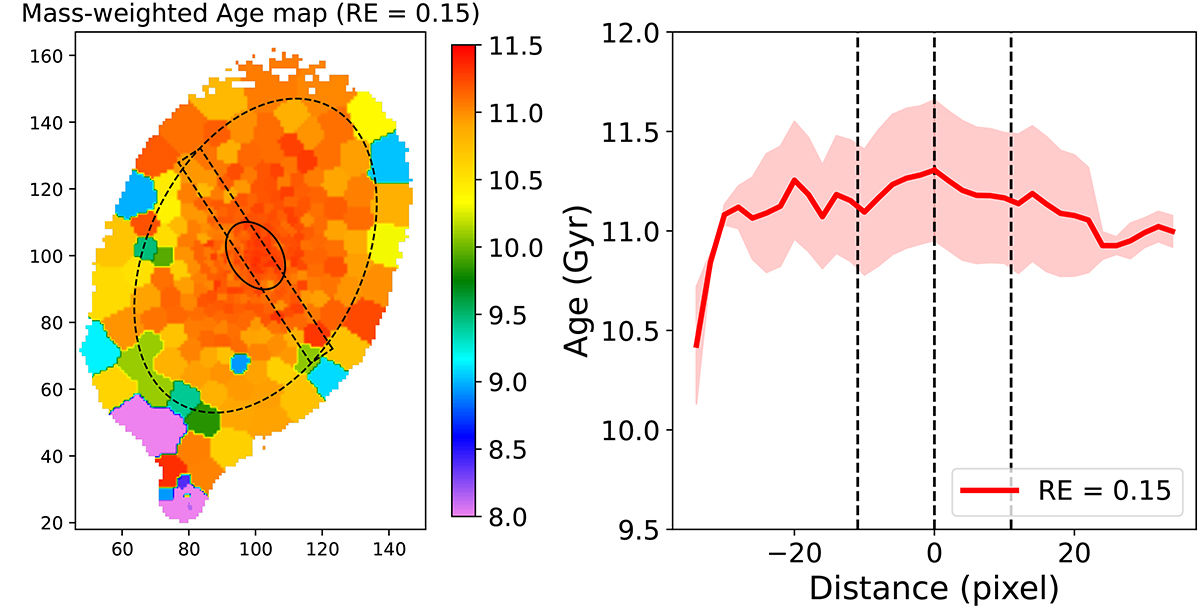
Mass-weighted age map of the stellar populations in AM0644-741 derived from the MUSE data using the GIST pipeline. The left panel shows the age map of the same region as displayed in Figure 3, estimated with a regularization error (RE) of 0.15. The solid red line on the right panel shows the average age values plotted along the pseudo slit as shown on the left panel. The shaded red region around the solid line highlights 1σ deviation on the age values estimated considering four different RE values (i.e., RE = 0.10, 0.15, 0.30, 0.45).
Current usage metrics show cumulative count of Article Views (full-text article views including HTML views, PDF and ePub downloads, according to the available data) and Abstracts Views on Vision4Press platform.
Data correspond to usage on the plateform after 2015. The current usage metrics is available 48-96 hours after online publication and is updated daily on week days.
Initial download of the metrics may take a while.