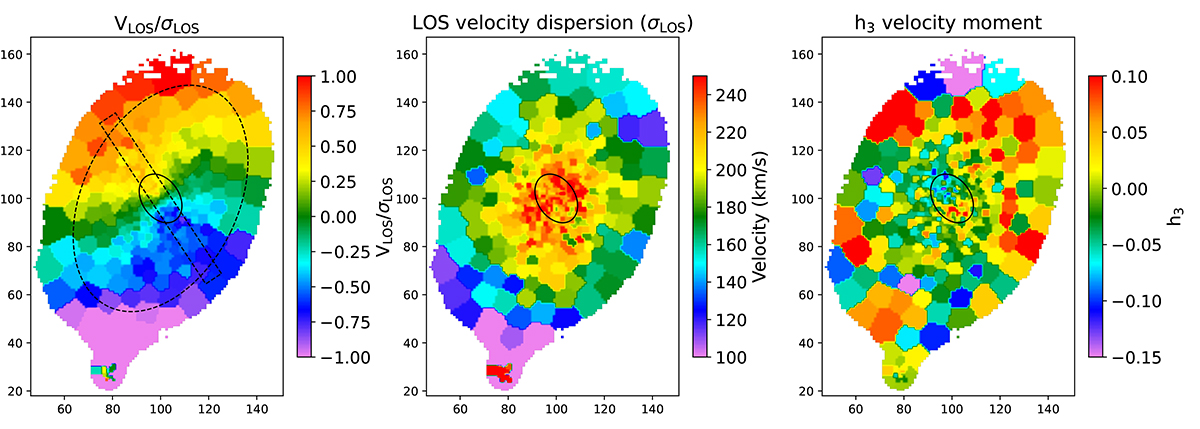
Fig. 3.
Download original image
Stellar kinematic maps of AM0644-741 derived from the MUSE IFU data using the GIST pipeline. The figure shows stellar VLOS/σLOS (left), velocity dispersion (σLOS) (middle), and h3 velocity moment (right) maps of the inner part (i.e., the region within the blue rectangle shown in Figure 1). The ellipses shown in solid and dashed black lines represent the inner and outer Sérsic components identified in the HST optical image (Figure 2). The dashed black rectangle shows the pseudo slit that was used to derive the radial VLOS/σLOS and σLOS profiles (shown in Figure 4) along the major axis of the detected inner component.
Current usage metrics show cumulative count of Article Views (full-text article views including HTML views, PDF and ePub downloads, according to the available data) and Abstracts Views on Vision4Press platform.
Data correspond to usage on the plateform after 2015. The current usage metrics is available 48-96 hours after online publication and is updated daily on week days.
Initial download of the metrics may take a while.