Fig. 4.
Download original image
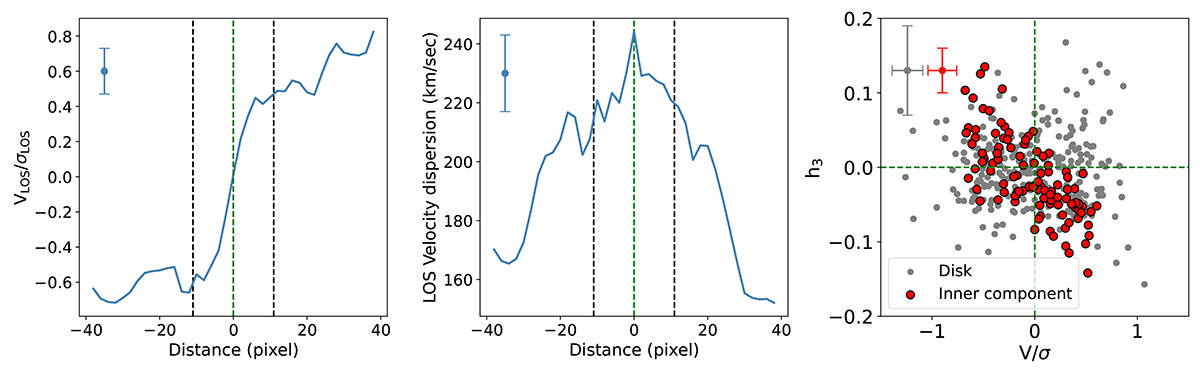
VLOS/σLOS (left) and LOS velocity dispersion (middle) profiles, measured along the pseudo slit shown in Figure 3. The vertical dashed black lines in both panels mark the edge of the identified inner component on either side of the minor axis, which is shown in a dashed green line. The red points on the right panel show the VLOS/σLOS and h3 values of the spaxels enclosed within the extent of the identified inner component (as is shown by the ellipse in solid black line in Figure 3). The gray points represent spaxels located outside the inner component. The error bars shown in each panel represent the typical error values associated with each respective quantity.
Current usage metrics show cumulative count of Article Views (full-text article views including HTML views, PDF and ePub downloads, according to the available data) and Abstracts Views on Vision4Press platform.
Data correspond to usage on the plateform after 2015. The current usage metrics is available 48-96 hours after online publication and is updated daily on week days.
Initial download of the metrics may take a while.