Fig. 2.
Download original image
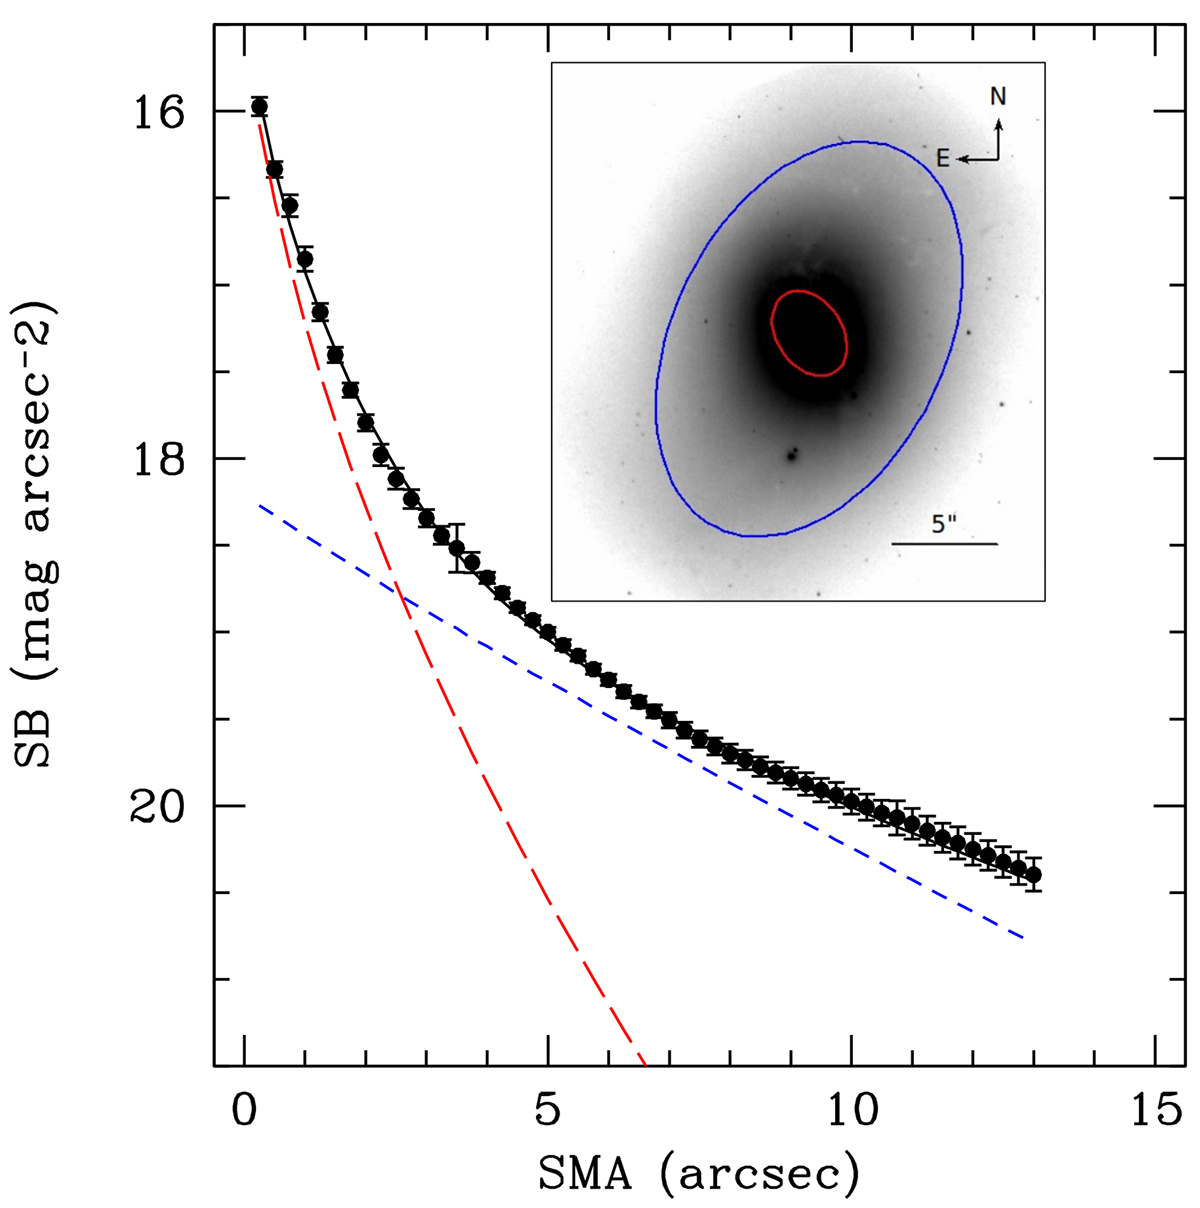
Surface brightness profiles derived using the IRAF ELLIPSE task from the HST F814W band observed and GALFIT model images. The black points denote the values derived from the observed image, whereas the profiles for the inner Sérsic, outer Sérsic, and the combined model are shown in dashed red, dashed blue, and solid black lines, respectively. In the inset, we show the HST image and the extent of both components in respective colors, considering values as specified in Table 1. The errors, shown for the observed surface brightness, were calculated from the root mean square scatter of the isophotal intensity.
Current usage metrics show cumulative count of Article Views (full-text article views including HTML views, PDF and ePub downloads, according to the available data) and Abstracts Views on Vision4Press platform.
Data correspond to usage on the plateform after 2015. The current usage metrics is available 48-96 hours after online publication and is updated daily on week days.
Initial download of the metrics may take a while.