| Issue |
A&A
Volume 696, April 2025
|
|
|---|---|---|
| Article Number | A221 | |
| Number of page(s) | 20 | |
| Section | Galactic structure, stellar clusters and populations | |
| DOI | https://doi.org/10.1051/0004-6361/202553746 | |
| Published online | 25 April 2025 | |
Exploring multiple stellar populations in globular clusters with Euclid: A theoretical overview and insights from NGC 6397
1
Dipartimento di Fisica e Astronomia “Galileo Galilei”, Univ. di Padova,
Vicolo dell’Osservatorio 3,
Padova
35122,
Italy
2
Istituto Nazionale di Astrofisica – Osservatorio Astronomico di Padova,
Vicolo dell’Osservatorio 5,
Padova
35122,
Italy
3
Research School of Astronomy & Astrophysics, Australian National University,
Canberra,
ACT 2611,
Australia
★ Corresponding author; This email address is being protected from spambots. You need JavaScript enabled to view it.
Received:
14
January
2025
Accepted:
11
February
2025
Abstract
We investigate the behavior of multiple stellar populations in globular clusters (GCs) using photometric diagrams constructed with Euclid photometry. By employing synthetic spectra and isochrones that incorporate the chemical differences between first-population (1P) stars (resembling field stars) and second-population (2P) stars (enriched in helium and nitrogen, but depleted in carbon and oxygen) we have identified, from a theoretical perspective, the color-magnitude diagrams and the chromosome maps most effective at distinguishing these populations within GCs. Euclid photometry has proven to be a powerful tool for identifying multiple populations among M-dwarfs, as 1P and 2P stars form distinct sequences in well-chosen photometric diagrams, driven by differences in the strength of oxygen-based molecular features, such as water vapor. To validate our theoretical findings, we analyzed Euclid photometry and astrometry of the GC NGC 6397, complemented by photometric and astrometric data from the Hubble Space Telescopeand James Webb Space Telescope, enabling a comprehensive study of its stellar populations across a wide field of view (FoV). We find that the 1P constitutes ~30% of the M-dwarfs in NGC 6397, with the fraction of 1P stars remaining consistent across different stellar masses and throughout the entire FoV. Next, 2P stars exhibit an [O/Fe] depletion of about 0.3 dex relative to 1P stars and both populations display isotropic proper motions. This study represents the first comprehensive analysis of multiple populations among M-dwarfs across a wide FoV, demonstrating that Euclid photometry is a powerful instrument for investigating multiple populations in GCs.
Key words: stars: Population II / globular clusters: general / globular clusters: individual: NGC 6397
© The Authors 2025
 Open Access article, published by EDP Sciences, under the terms of the Creative Commons Attribution License (https://creativecommons.org/licenses/by/4.0), which permits unrestricted use, distribution, and reproduction in any medium, provided the original work is properly cited.
This article is published in open access under the Subscribe to Open model. This email address is being protected from spambots. You need JavaScript enabled to view it. to support open access publication.
1 Introduction
Despite the fact that Galactic globular clusters (GCs) have been widely held up as examples of simple stellar populations, extensive research carried out in the past decades has shown that the majority of them are actually host to distinct stellar populations with significant chemical variations. These can be grouped into a first population (1P), whose chemical makeup resembles field stars of a similar metallicity, along with one or more second populations (2P), which feature higher abundances of helium, nitrogen, aluminum, and sodium, as well as decreased carbon and oxygen (see e.g., Kraft 1994; Bastian & Lardo 2018; Gratton et al. 2019; Milone & Marino 2022, for reviews).
The existence of multiple, discrete populations in GCs, with their characteristics and variations among clusters, represents a significant challenge to our models of stellar formation and evolution in the early Universe. The contrasting scenarios proposed to explain them paint very different pictures not just of cluster origins, but potentially of Galactic-halo assembly and even Universe reionization (e.g., Renzini 2017). For this reason, they have been the focus of a large-scale observational efforts spanning several decades.
The search for multiple stellar populations in GCs from photometry has primarily been focused on UV filters, which are sensitive to spectral features influenced by molecular bands such as carbon, nitrogen, and oxygen (e.g., Marino et al. 2008; Yong et al. 2008; Milone et al. 2012c; Lee 2022; Mehta et al. 2025). The densely populated central regions of clusters are typically studied using the high-resolution capabilities of the Hubble Space Telescope (HST), while the more extended outskirts are explored with wide-field ground-based facilities (Milone et al. 2012c, 2013, for early studies on multiple populations in GCs based on the synergy of HST and ground-based telescopes).
While effective, this approach is constrained by the limitations of UV detectors in achieving high-precision photometry for faint stars. Consequently, these studies typically focus on giant stars or bright main sequence (MS) stars. Optical and near-infrared filters are poorly sensitive to star-to-star carbon, nitrogen, and oxygen variations contents among bright stars. However, they are effective tools for identifying stellar populations with different oxygen abundances among M-dwarfs. This was demonstrated by Milone et al. (2012a), using the photometry of the GC NGC 2808 in the F110W and F160W bands of the infrared channel of the Wide Field Camera 3 (IR/WFC3) on board HST. The 2P stars, which have lower oxygen content than 1P stars, exhibit spectra that are less absorbed by oxygen-containing molecules. Since the F160W band is particularly sensitive to absorption by these molecules, 2P stars display brighter F160W magnitudes and bluer F110W–F160W colors compared to 1P stars of a similar luminosity (see also Milone et al. 2014, 2017a, 2019, 2023b; Dondoglio et al. 2022; Ziliotto et al. 2023; Cadelano et al. 2023; Scalco et al. 2024b,a; Marino et al. 2024a,b, for studies on multiple populations among low-mass stars based on HST and the James Webb Space Telescope).
A significant limitation in studies conducted with photometric cameras aboard the HST and the James Webb Space Telescope (JWST) is their relatively small field of view (FoV). In contrast, the recently launched Euclid Telescope by the European Space Agency (ESA) addresses this challenge with its considerably wider FoV, enabling the study of larger areas of the sky in a single observation.
In this paper, we explore the potential of Euclid photometry to detect and characterize multiple stellar populations in GCs. Our analysis begins with the use of isochrones tailored to the specific chemical compositions of 1P and 2P stars in Euclid filters. We then examine Euclid photometry of the GC NGC 6397, analyze its stellar populations, and compare the resulting photometric diagrams with those derived from HST and JWST observations.
NGC 6397, the second-nearest GC, has been extensively studied in the context of multiple stellar populations. Observations have revealed two distinct stellar sequences along both the red giant branch (RGB) and the MS, as identified in CMDs constructed using photometry from HST and JWST (Milone et al. 2012b, 2017b; Scalco et al. 2024b). These sequences correspond to chemically distinct populations, exhibiting moderate differences in helium, oxygen, and sodium abundances (Lind et al. 2011; Carretta et al. 2009; Milone et al. 2018; Marino et al. 2019a). The small elemental abundance differences between 1P and 2P stars, combined with the low metallicity of NGC 6397 ([Fe/H] ~ −2.02, based on the 2010 edition of the Harris (1996) catalog), result in only minor flux variations among stars with similar atmospheric parameters. This often makes it challenging to photometrically distinguish between 1P and 2P stars (e.g., Nardiello et al. 2015; Branco et al. 2024; Mehta et al. 2025).
The paper is organized as follows: Section 2 describes the dataset and summarizes the methods used for data reduction. Section 3 focuses on the theoretical modeling of multiple populations. Section 4 presents the observational results for NGC 6397. Finally, Sect. 5 provides a summary of our findings and conclusions.
2 Data and data reduction
To evaluate the potential of Euclid for identifying and characterizing multiple stellar populations in GCs, we analyzed photometry and astrometry of stars within the FoV of NGC 6397. This analysis was complemented with additional data from Gaia DR3 (Gaia Collaboration 2021), JWST, and HST. The footprints of the JWST and HST images, shown in Fig. 1, include six fields: the central field and fields A to E. Most observations are concentrated in the central field and field A.
The central field includes images from WFC/ACS (GO-10755, Sarajedini et al. 2007; Anderson et al. 2008b) and UVIS/WFC3 (GO-13297, Piotto et al. 2015), used to identify 1P and 2P stars along the MS and RGB. Infrared images from WFC3 (IR/WFC3, Correnti et al. 2018) have been used to analyze multiple populations among M-dwarfs, supplemented by UVIS/WFC3 and WFC/ACS data for proper motions.
Field A in Fig. 1 is located about 5 arcmin south-east the cluster center and has been extensively observed with ACS/WFC of HST (GO-10424 and GO-11633; Richer et al. 2006) and NIRCam of JWST (Bedin et al. 2024) to study faint stars in NGC 6397. The remaining fields B, C, D, and E are observed with ACS/WFC only. The key properties of the images utilized in this study are summarized in Table A.1 and are discussed in the following. As an example of the quality of the images collected using different telescopes and filters, the bottom panels of Fig. 1 compare the stacked images obtained with HST, JWST, and Euclid for a 30-square-arcsecond region within field A.
2.1 Euclid
The primary dataset comprises stellar magnitudes and positions obtained by Libralato et al. (2024) from Euclid, a space observatory launched in 2023 and designed for surveys. Light is collected by a 1.2 m Korsh telescope, and directed by a dichroic mirror to two onboard instruments: The VISible Instrument (VIS) and the Near-Infrared Spectrometer and Photometer (NISP). VIS consists of a square array of 36 CCDs, each equipped with a matrix of 4K × 4K 12 μm pixels, for a total FoV of 0.54 deg2 and a scale of 100 mas pixel−1. As the name suggests, it is meant for photometry in the visible range and features a single broadband filter (IE) with a wavelength range from 550 to 900 nm. NISP, meanwhile, features both a spectroscopic channel (not used in this work) and a photometric one. It is composed by a 4×4 array of TIS detectors featuring 2K × 2K 18 μm pixels each, for a total FoV of 0.57 deg2 and a pixel scale of 300 mas pixel−1. Three NIR filters (YE, JE and HE) cover the wavelength ranges of 920–1146 nm, 1146–1372 nm and 1372–2000 nm, respectively, allowing for multiband photometry (Schirmer et al. 2022). A detailed description of VIS and NISP can be found in the Euclid collaboration papers by Euclid Collaboration: Cropper et al. (2025) and Euclid Collaboration: Jahnke et al. (2025). As put forward by Massari et al. (2025) and Libralato et al. (2024) Euclid’s high resolving power (comparable with that of HST in their overlapping wavelength range) and wide FoV give it a high potential for the study of extended, crowded objects such as GCs.
The Euclid NGC 6397 dataset used in this work is based on the Reference Observation Sequence (ROS, Scaramella et al. 2022) carried out by Euclid on September 22nd, 2023 as part of the Euclid Early Release Observations (ERO) program. The ROS, centered on the cluster, consists in four dithered observations, each including three 87.2 s exposures in the YE, JE and HE filters, a spectral exposure (not featured in this study) and a 560 s long exposure in the IE broadband filter. Each individual, non-stacked exposure was reduced by Libralato et al. (2024). As a first step, the raw images were corrected according to the standard ERO pipeline detailed in Cuillandre et al. (2025), but without correcting the VIS data for the effects of cosmic rays. Then, each image was reduced by means of effective-PSF photometry using euclid1pass, a version of the hst1pass software developed by Anderson (2022) and adapted to Euclid specifications. The results were then corrected for geometric distortion following the procedures for wide-field images described in Libralato et al. (2015) using star positions from Gaia DR3 as a reference, calibrated and aligned to the same reference frame. This yielded increased astrometric and photometric precision when compared to the official ERO catalog.
2.2 HST and JWST
The photometry and astrometry of stars in the HST and JWST fields were performed using computer programs designed and developed by Jay Anderson (e.g., Anderson & King 2000; Anderson et al. 2008b; Anderson 2022). Specifically, we utilized the KS2 program, an evolution of the kitchen_sync program (Anderson et al. 2008a), which was originally developed to extract high-precision stellar fluxes and positions from images obtained with the Wide-Field Channel of the Advanced Camera for Surveys (WFC/ACS) aboard HST.
KS2 is a versatile program for deriving precise stellar magnitudes and positions, utilizing three methods tailored to stars with varying brightness and in diverse stellar environments:
Method I targets bright stars, identifying those with prominent peaks within a 5×5-pixel area after subtracting nearby sources. Fluxes and positions are calculated in each image using a PSF model specific to the star’s location, while the sky level is determined from the surrounding region (4–8 pixels from the center). Measurements across all exposures are averaged to ensure high precision.
Method II is designed for fainter stars, performing weighted aperture photometry within a 5×5 grid. Pixels influenced by neighboring stars are down-weighted, and the sky level is measured similarly to Method I.
Method III suits faint stars in crowded fields with many exposures. Photometry is performed within a smaller 0.75-pixel-radius aperture, and the sky is calculated closer to the star (2–4 pixel annulus).
All methods involve independent measurements from individual exposures, which are averaged for the most accurate results. KS2 also includes diagnostics to ensure only isolated stars with high-quality fits are used for final analyses (see Milone et al. 2023a, for details on the selection procedures).
The stellar coordinates were corrected for geometric distortion using the solutions from Anderson & King (2006); Bellini & Bedin (2009); Bellini et al. (2011); Anderson (2022) and Milone et al. (2023b). The photometric calibration to the Vega magnitude system followed Milone et al. (2023a), utilizing the latest zero points available on the STScI website. Moreover, we used the KS2 program artificial-star tests to evaluate the photometric uncertainties on stellar magnitudes (see Anderson et al. 2008b; Milone et al. 2023a, for details).
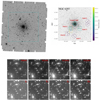 |
Fig. 1 Stacked image of the Euclid images in the HE band (Libralato et al. 2024). The right panel shows a zoom of the studied FoV, together with the footprints of the HST and JWST images used in this paper. The color scale is associated with the epoch as indicated by the color-bar on the right. The bottom panels compare the observations of a 30 square arcsec region obtained in the F606W and F814W bands of WFC/ACS, the F150W2 and F322W2 filters of NIRCam and the Euclid filters. |
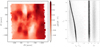 |
Fig. 2 Map of differential reddening toward NGC 6397. The color levels in the map correspond to the relative variation in E(B–V), with the scale indicated on the right (left panel). The middle panel presents the IE vs. IE − YE CMD corrected for differential reddening. The right panel shows IE plotted against the displacement (in Euclid VIS pixel units) relative to the average motion of NGC 6397. Probable cluster members are highlighted in black, while field stars are depicted in gray. |
2.3 Proper motions
To measure relative proper motions, we followed a procedure outlined in several studies (e.g., Anderson & King 2003; Piotto et al. 2012; Libralato et al. 2022; Milone et al. 2023a), which relies on comparing stellar positions across images taken at different epochs.
Initially, we identified distinct photometric and astrometric catalogs created from images captured in various filters over multiple epochs. The reference frame for our analysis was anchored to the first-epoch images taken in the reddest filter, which served as the master frame. We adopted a specific orientation for the reference frame, with the X-axis aligned toward the west and the Y-axis pointing north.
Star coordinates from each catalog were transformed into this master frame using six-parameter linear transformations. To further refine the alignment and reduce the impact of small residual distortions, we applied local transformations based on the nearest 75 reference stars. The target stars themselves were excluded from contributing to the transformations used to correct their positions.
The abscissa and ordinate of each star were plotted as functions of the observation epoch and fitted using a weighted least-squares straight line. The slope and the corresponding uncertainty of this line provide the best estimate of the star’s proper motion.
The transformations rely on bright, unsaturated cluster stars that meet the selection criteria outlined in Sect. 2.2 and Milone et al. (2023a). These stars were selected through a two-step process. First, we identified probable members of NGC 6397 based solely on their position in the CMD and used them to derive preliminary proper motions. In the second step, we refined the selection by considering each star’s location in both the CMD and the proper motion diagram, allowing for a more accurate determination of cluster membership. These refined members were then used to compute improved proper motions. To minimize uncertainties in proper-motion measurements, we corrected the stellar coordinates at each epoch by subtracting the displacements caused by proper motions. These adjusted coordinates were then used to compute improved transformations, further refining the proper-motion estimates.
The limited availability of archival HST and JWST first-epoch images restricts the possibility to disentangle field stars from cluster members to a relatively small area. To expand the FoV, we utilized the photometric catalog of NGC 6397 compiled by Peter Stetson (Stetson 2000; Stetson et al. 2019), previously employed in studies of multiple populations in this cluster by Monelli et al. (2013).
Specifically, we computed the displacements, DX and DY, of stellar coordinates in Stetson’s and Libralato’s catalogs relative to NGC 6397 stars, using six-parameter linear transformations. It is important to note that the stellar astrometry in the catalogs compiled by Monelli et al. (2013) and Stetson et al. (2019) is based on images collected from various telescopes over different epochs and has not been rigorously corrected for geometric distortion. As a result, the derived stellar displacements are unsuitable for investigating the internal kinematics of cluster stars.
However, the significant proper motion of NGC 6397 relative to field stars enables a clear distinction between the two populations based on stellar displacements. This is demonstrated in Fig. 2, where the CMD of stars from Euclid photometry is shown (middle panel), along with IE plotted against the displacement ![Mathematical equation: $\[\delta \mathrm{R}=\sqrt{D X^{2}+D Y^{2}}\]$](/articles/aa/full_html/2025/04/aa53746-25/aa53746-25-eq1.png) (right panel). We classified stars with δR<1.5 as probable cluster members, while those with larger displacements were identified as field stars. In the middle and right panels of Fig. 2, cluster members are shown in black, and field stars are depicted in gray.
(right panel). We classified stars with δR<1.5 as probable cluster members, while those with larger displacements were identified as field stars. In the middle and right panels of Fig. 2, cluster members are shown in black, and field stars are depicted in gray.
Relative extinction, A/E(B–V), for Euclid bandpasses.
2.4 Differential reddening
The photometry has been corrected for differential reddening using a procedure similar to that introduced by Milone et al. (2012c), which has been widely adopted in various studies on reddening by our team (Jang et al. 2022; Milone et al. 2023a; Legnardi et al. 2023).
To analyze differential reddening from Euclid photometry, we constructed HE versus X–HE diagrams, where X = IE, YE, and JE. Each of these diagrams was utilized to extract reddening information from a carefully chosen set of reference cluster members. These reference stars were selected from regions of the CMD where the reddening vector forms a significant angle with the cluster’s fiducial line. This selection ensures that the effects of differential reddening on stellar colors and magnitudes can be distinguished clearly from shifts caused by photometric uncertainties.
We transformed each CMD into a new reference frame by rotating the original diagram such that the axes align with the reddening vector. In this new frame, the abscissa runs parallel to the reddening direction, while the ordinate is orthogonal to it. The adopted absorption coefficients for the Euclid filters are listed in Table 1 and obtained as in Legnardi et al. (2023), by assuming a standard reddening law with RV=3.1 and E(B–V)=0.18 mag (2010 version of the Harris 1996, catalog).
We determined the abscissa difference, Δ(X − HE), between each reference star and the main-sequence (MS) fiducial line in each rotated CMD. The measured Δ(X − HE) values were compared to those predicted for reddening variations ranging from ΔE(B − V) = −0.1 to 0.1 mag, sampled in increments of 0.001 mag. The reddening variation, ΔE(B − V), which minimizes the χ2 value was taken as the optimal differential-reddening estimate for the corresponding reference star. The most reliable differential reddening value was derived as the median of the ΔE(B − V) values of the 75 spatially nearby reference stars. We adopted the same procedure discussed above to correct the effects of differential reddening from ACS/WFC, UVIS/WFC3, and NIRCam photometry.
2.5 Results
The resulting differential-reddening map derived from Euclid photomery is plotted in the left panel of Fig. 2. The middle panel of Fig. 2 shows the differential-reddening corrected IE versus IE − YE CMD, whereas the displacements between the stellar positions in the Libralato’s and Stetson’s catalogs are plotted in the right panel against IE. This diagram has been used to separate the bulk of field stars (gray points) from the cluster members that we will use to study multiple populations over a wide field a view (black points).
The proper motions of stars in Field A are displayed in the left panel of Fig. 3. As extensively discussed in previous studies on the kinematics of stars in the direction of NGC 6397 (e.g., Milone et al. 2006; Kalirai et al. 2007), this diagram reveals that cluster members, clustered around (μα cos δ, μδ) ~ (3.4, −17.6) mas yr−1, are well-separated from field stars, enabling robust identification of NGC 6397 members. Additionally, the diagram highlights a broad overdensity of stars centered around (μα cos δ, μδ) ~ (−2.5, −6.0) mas yr−1, corresponding to stars from the Galactic bulge. A distinct cluster of sources near the origin of the reference frame is also apparent, consisting of background galaxies.
The proper motion diagrams derived from astrometry using Euclid, HST, and JWST data have been instrumental in disentangling field stars from cluster members and analyzing the internal kinematics of stellar populations. For instance, the right panel of Fig. 3 presents the mF322W2 versus mF150W2 − mF322W2 CMD from NIRCam photometry, where proper-motion-selected cluster members are marked as black points, while field stars are shown as light-red points.
Figure 4 presents additional CMDs for proper-motion-selected cluster members. The left panel showcases the mF606W versus mF606W − mF814W CMD for stars located in both the central field and Field A. This CMD covers a wide magnitude range of approximately 19 magnitudes and includes stars at various evolutionary stages. Specifically, it features the entire MS, extending from the turn-off point to the hydrogen-burning limit, as well as the sub-giant branch, the RGB, and the complete white-dwarf cooling sequence. This comprehensive CMD serves as a valuable tool for studying the proper motion distributions of stars across different evolutionary phases and different masses.
The right panel of Fig. 4 illustrates the mF814W versus mF814W − mF322W2 CMD for proper-motion-selected faint stars of NGC 6397 in Field A. The stellar sequence with colors exceeding ~1.4 represents the faintest part of the MS, extending down to the hydrogen-burning limit at mF814W ~ 27 mag, and includes the brightest brown dwarfs visible mF814W ≳ 27 mag. On the left, the white dwarf cooling sequence is prominently visible, showcasing notable slope changes around mF814W ~ 26.5 and 27.5 mag. These CMDs, along with the one shown in Fig. 3, will be instrumental in identifying multiple populations among M-dwarfs and analyzing their internal proper motions. For earlier studies of the faintest stars in NGC 6397 based on similar data, we refer readers to Richer et al. (2006), Bedin et al. (2024), Gerasimov et al. (2024), and references therein.
3 Multiple populations with Euclid: a theoretical approach
The distinct chemical compositions of 2P stars in GCs, characterized by enhanced helium and nitrogen alongside reduced carbon and oxygen compared to 1P stars, drive the appearance of multiple stellar sequences in CMDs despite similar atmospheric parameters.
Here, we explore how variations in He, C, N, and O affect CMDs constructed with Euclid filters, applying methods previously used for other telescopes and filter sets (Sbordone et al. 2011; Dotter et al. 2015; Milone et al. 2018, 2023a; Salaris et al. 2019; Li et al. 2022).
We began by examining stellar populations characteristic of a GC with an intermediate metallicity of [Fe/H] = −1.5, extending our analysis to a metal-poor GC with [Fe/H] = −1.9 and a metal-rich GC with [Fe/H] = −0.75. For consistency, we used the same isochrones and synthetic spectra applied in previous studies of NIRCam photometry for M92 and 47 Tucanae (Ziliotto et al. 2023; Milone et al. 2023a).
Specifically, we selected helium-poor (Y = 0.246) and helium-rich (Y = 0.33) isochrones from the Dartmouth database (Dotter et al. 2008), both with an age of 13 Gyr and an α-enhancement of [α/Fe] = 0.4. At fifteen points along each isochrone, we extracted effective temperatures and surface gravities to model synthetic spectra representative of 1P and 2P stars. The 1P reference spectra, associated with Y = 0.246, assume solar carbon and nitrogen abundances with [O/Fe] = 0.4. In contrast, 2P spectra incorporate elemental variations with [C/Fe] = −0.5, [N/Fe] = 1.2, and [O/Fe] = −0.1. In addition, we simulated spectra for stars with 2P-like C, N, and O abundances but Y=0.246, which allow us to visualize the effects of these light elements alone on stellar spectra, and spectra with Y=0.33 but 1P-like content of C, N, and O to explore the effects of helium changes alone on the spectra.
The model atmospheres are developed by Milone et al. (2023a) and Ziliotto et al. (2023) by using the ATLAS12 program (Kurucz 1970, 1993; Sbordone et al. 2004), which leverages opacity-sampling and assumes a plane-parallel geometry in local thermodynamic equilibrium (LTE). These models span a range of temperatures (3500–6500 K) and surface gravities (log(g) = 2–5) with a fixed microturbulent velocity of 2 km/s. Molecular line data for species like C2, CN, CO, H2O, MgH, OH, SiH, TiO, VO, and ZrO, along with the latest atomic line lists, were included. Synthetic spectra were produced using SYNTHE (Kurucz & Avrett 1981), covering wavelengths from 1000 to 51 000 Å at high resolution. Magnitudes were calculated by integrating these spectra over the HST, JWST and Euclid bandpasses, and 2P magnitudes were derived by applying differential offsets to the 1P isochrone values.
The left panels of Fig. 5 illustrate the relative fluxes of simulated spectra for an M-dwarf (bottom), a K-dwarf (middle), and an RGB star (top), compared to the 1P spectrum with the same F115W magnitude. Unlike Milone et al. (2023a), which explored multiple populations’ effects on NIRCam photometry, this study focuses on the wavelength range observed by Euclid.
As noted in earlier studies, variations in C, N, and O have minimal impact on RGB and MS stars brighter than the MS knee (e.g., Milone et al. 2012a). Helium variations mostly affect stellar structure and have negligible effect on stellar atmospheres. Helium-rich stars, being hotter than their helium-normal counterparts with the same F115W luminosity, display brighter optical magnitudes, as shown in the top and middle panels (D’Antona et al. 2002; Norris 2004; Sbordone et al. 2011).
The bottom panel highlights a distinct feature of M-dwarfs: beyond ~13 000 Å O-rich stars exhibit stronger absorption than O-poor stars due to oxygen-based molecules like water vapor. These absorption features overlap with the spectral regions covered by Euclid’s JE and HE filters as shown in the top-right panel of Fig. 5, where we compare the filter throughputs with the flux ratio of 2P to 1P stars. This figure also reveals that in the optical, molecular absorption compensates the helium effects, resulting in similar spectra below ~7500 Å.
A visual comparison of flux ratio plots between 1P and 2P stars with identical F115W magnitudes, as a function of wavelength, reveals that stellar populations with [Fe/H]=−0.75 and [Fe/H]=−2.3 display comparable qualitative trends (Milone et al. 2023a; Ziliotto et al. 2023). However, a notable exception arises from the strong molecular absorption features affecting optical wavelengths in the spectra of M-dwarfs with [Fe/H]=−0.75.
Figure 6 quantifies these behaviors by showing the magnitude differences, δm (where m = IE, YE, JE, and HE), for the pairs of RGB, K-dwarfs, and M-dwarfs analyzed in Fig. 5 and earlier works (Milone et al. 2023a; Ziliotto et al. 2023). Each pair consists of stars with identical F115W magnitudes but differing helium and C, N, O abundances. Notably, these are the same simulated spectra pairs previously used by Milone et al. (2023a) and Ziliotto et al. (2023) to evaluate magnitude differences in UVIS/WFC3, IR/WFC3, and NIRCam data, thus allowing direct comparison of the results from Euclid, HST, and JWST photometry.
The simulated spectra were used to calculate the colors and magnitudes of the isochrones depicted in Fig. 7. For [Fe/H] = −1.5, helium-rich isochrones display bluer IE − JE colors compared to the aqua and light-red isochrones (Y = 0.246) that share the same C, N, and O abundances as the blue and black isochrones, respectively (top-left panel of Fig. 7). A notable exception occurs in the SGB region, where isochrones with different helium content become intertwined. Above the MS knee, the aqua isochrones, which mimic 1P stars and are taken as references, and light-red isochrones are nearly indistinguishable. However, below the MS knee, they diverge, with O-poor isochrones appearing bluer than those with [O/Fe] = 0.4. Similarly, the blue and black isochrones, both helium-enhanced (Y = 0.33) but with different C, N, and O abundances, exhibit comparable trends. Interestingly, in the IE versus IE − JE CMD, helium enhancement and oxygen depletion have opposing effects on stellar colors.
Above the MS knee, the isochrones with [Fe/H] = −1.5 and different He, C, N, and O abundances exhibit comparable trends in both the IE versus IE − JE and YE versus YE − HE CMDs. Below the MS knee, however, the pairs of isochrones with identical C, N, and O abundances but different helium content overlap almost entirely in the YE versus YE − HE, while oxygen-poor isochrones become distinctly redder than those with [O/Fe] = 0.4, due to the increasing influence of molecular absorption bands in the cooler atmospheres of M-dwarfs.
The MS of isochrones with different C, N, and O abundances but identical helium content is nearly indistinguishable in the IE versus IE − YE CMD (left panel of Fig. 7). This scarce sensitivity to abundance variations in clusters with [Fe/H]=−1.5 and moderate helium differences makes this diagram particularly effective for identifying binaries composed of MS stars throughout the entire MS. Moreover, it enables precise determination of the MS knee position, which is crucial for accurate age estimates based on the relative locations of the MS knee and the MS turn-off.
The isochrones with [Fe/H]=−2.30 exhibit qualitatively similar behavior to those with [Fe/H]=−1.50 in the CMDs shown in Fig. 7, albeit with smaller color separations. In contrast, metal-rich isochrones ([Fe/H]=−0.75) display notable differences compared to those with [Fe/H]=−1.50 or −2.30, particularly below the MS knee. These discrepancies arise primarily from the stronger molecular band absorption in the optical region of M-dwarf spectra (e.g., Milone et al. 2023a, see their Figure 12). In particular (as shown in the bottom panels of Fig. 7), the isochrones with different oxygen abundances have different colors below the MS-knee, with the O-poor isochrones drawing sequences with redder IE − JE and IE − YE colors and bluer YE − HE colors than the O-rich isochrones. We verified that these conclusion, obtained from isochrones based on Dotter et al. (2008) models, can be confirmed when using isochrones from the BaSTI database (Pietrinferni et al. 2021).
To further explore multiple stellar populations in photometric diagrams derived from Euclid photometry, we utilized isochrones with chemical compositions representative of 1P and 2P stars. We simulated six distinct isochrones with different levels of He, C, N, O, and Fe, as detailed in Table 2. Isochrones I1 are characteristic of 1P stars, while I2, I3, and I4 mimic 2P stars, maintaining the same iron abundance as I1 but incorporating different degrees of light-element variations. Isochrones I5 mirror the C, N, O, and Fe content of I1 but include enhanced helium abundances. Finally, I6 isochrones have the same helium and light-element abundances relative to iron as I1 but exhibit an increased [Fe/H] by 0.1 dex, accounting for star-to-star metallicity differences that drive the extended 1P sequence observed in chromosome maps of numerous clusters (Milone et al. 2015; Marino et al. 2019b; Legnardi et al. 2022, 2024; Lagioia et al. 2024).
The HE versus YE − HE and HE versus IE − JE CMDs, displayed in the top panels of Fig. 8, offer the most effective separation of stellar populations with varying C, N, and O abundances and [Fe/H]=−1.5 below the MS knee. Consequently, the ΔYE–HE versus ΔIE–JE chromosome map (ChM) optimally distinguishes multiple populations with different light-element compositions in GCs. The clustering of I6 stars near I1 stars further indicates that this ChM is poorly sensitive to the small metallicity variations typically found among 1P stars in Type I GCs. The analysis of isochrones with [Fe/H]=−2.3 and the same abundances of helium, carbon, nitrogen and oxygen as those shown in the top panels of Fig. 8 provide the same conclusions.
The bottom panels of Fig. 8 display isochrones with [Fe/H] = −0.75. As shown in the left panel, the relative behavior of the metal-rich I1–I6 isochrones is similar to what is observed for lower metallicities ([Fe/H] = −1.5 and −2.3). However, the rise of molecular absorption features, particularly in the IE band for metal-rich stars fainter than the MS knee, makes colors involving this filter highly sensitive to variations in oxygen abundance. Specifically, 2P stars, which are oxygen-poor, experience less molecular absorption and thus appear brighter in the IE band compared to 1P stars with higher oxygen content.
Among the investigated colors, the IE − YE color, used to construct the CMD in the bottom-middle panel of Fig. 8, provides the most pronounced separation between the multiple populations of M dwarfs. While the IE − JE and IE − HE colors are also effective at distinguishing 1P and 2P stars, the molecular absorption effects on the JE and HE magnitudes partially counteract the absorption seen in IE. Interestingly, at [Fe/H] = −0.75, O-rich stars exhibit bluer IE − JE colors than O-poor stars—a trend that is reversed in the simulated CMDs for lower metallicities.
Pseudo-colors, such as those derived from CIE,YE,JE =(mIE − mYE)−(mYE − mHE) or the ΔYE–HE versus ΔIE–YE ChM plotted in the bottom-right panel of Fig. 8, offer an even greater ability to disentangle multiple populations and provide a valuable tool for studying their properties.
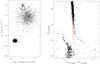 |
Fig. 3 Proper-motion diagram of stars in the field A. The light-red circle encloses the bulk of cluster members (left). mF322W2 versus mF150W2 − mF322W2 CMD from NIRCam data. Black circles and light-red points mark probable the proper-motion selected cluster members and field stars, respectively. The error bars colored teal and crimson represent the typical photometric uncertainties of white dwarfs and MS cluster stars, respectively, at different F322W2 magnitude values (right). |
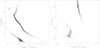 |
Fig. 4 mF606W vs. mF606W − mF814W (left) and mF814W vs. mF814W − mF150W2 (right) CMD of proper-motion selected cluster members. |
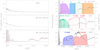 |
Fig. 5 Left panels. Flux ratios were calculated for simulated spectra of stars with identical luminosity in the NIRCam F115W band but different chemical compositions. The 2P spectra are helium and nitrogen-enhanced while being carbon and oxygen-depleted compared to the 1P spectra. Light-blue spectra represent stars with the same C, N, O abundances as 1P stars but enriched in helium, while light-red spectra correspond to stars with 1P-like helium content but different C, N, and O abundances. The bottom, middle, and top panels correspond to M-dwarfs, K-dwarfs, and RGB stars, respectively (Milone et al. 2023a). For 1P stars and 2P-like stars with Y=0.246, the effective temperatures, Teff, and gravities, log(g), are 3762 K, 5901 K, 4746 K and 5.03, 4.50, 1.82, respectively. Helium-rich stars were modeled with Teff = 3808 K, 6048 K, 4803 K, and log(g)=5.03, 4.48, 1.78, based on Dotter et al. (2008) isochrones. Right panels. Transmission curves of the filters used in this paper. The Euclid filters (top), the F606W and F814W ACS/WFC and F110W F160W IR/WFC3 filters on board HST (middle), and the F150W2 and F322W2 filters of NIRCam/JWST. We superimpose on each panel the flux ratio between 2P and 1P M-dwarf with different helium and C, N, O abundances. |
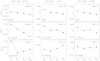 |
Fig. 6 Magnitude difference between a 1P star and a star with the same F115W magnitude and a chemical composition that resembles 2P stars. The azure points correspond to stars with the same chemical composition as 1P stars but enhanced in helium (Y=0.33). The light-red points are derived from spectra that share the same helium content as 1P stars but are enhanced in N and depleted in both C and O. Left, middle, and right panels show spectra with [Fe/H]=−0.75, −1.50, and −2.30 (Milone et al. 2023a; Ziliotto et al. 2023), respectively. The results for RGB, bright-MS stars, and M -dwarfs are shown in the top, middle, and bottom panel respectively. We display in the top-right corner of – each panel the effective temperature and the logarithm of gravity for 1P spectra. |
Chemical compositions of the isochrones I1–I6.
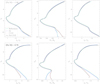 |
Fig. 7 13 Gyr isochrones from the Dartmouth database (Dotter et al. 2008) with [α/Fe]=0.4 and with [Fe/H]=−1.50 (top panels) and [Fe/H]=−0.75 (bottom panels). Isochrones with pristine helium content (Y=0.246 and Y=0.254 for the top- and bottom-panels, respectively) are shown in aqua and light red, while those enriched in helium (Y=0.33) are displayed in blue and black. The light-red and black isochrones have chemical compositions with carbon and oxygen depletion of 0.5 and 0.9 dex, respectively, along with a nitrogen enhancement of 1.2 dex. In contrast, the aqua and blue isochrones represent stars with [O/Fe]=0.4 and solar abundances of carbon and nitrogen. |
4 Multiple populations in NGC 6397 from Euclid, HST and JWST
To investigate multiple stellar populations in NGC 6397 with Euclid data, we started analyzing the HE versus IE − JE (left) and HE versus YE − HE CMDs plotted in Fig. 9.
The left panel of Fig. 10 presents the ΔIE–JE versus ΔYE–HE ChM of M dwarfs derived from these CMDs within the magnitude range 19.8 < HE < 21.0, where the impact of multiple populations on the MS color is most pronounced. This ChM, constructed following the methodology outlined by Milone et al. (2017b, see also Sect. 3), reveals two distinct stellar groups. Stars clustered near the origin of the reference frame correspond to the 1P, while the group located around (ΔIE–JE, ΔYE–HE) ~ (−0.06, 0.06) represents the 2P.
The right panel of Fig. 10 displays the simulated ChM that provides the best match with the observations and is derived as in Zennaro et al. (2019). The 1P and 2P stars comprise the 31% and 69%, respectively, of the simulated stars and are colored teal and crimson, respectively. We also compare the kernel-density distributions of ΔIE–JE and ΔYE–HE for the observed (black line) and simulated stars (gray line) and indicate the distributions of 1P and 2P simulated stars with teal and crimson dashed lines, respectively.
To further investigate the multiple populations in NGC 6397, we compared the results obtained from JWST and Euclid data. Figure 11 presents the mF322W2 versus mF606W − mF322W2 CMD, derived from NIRCam data and corrected for differential reddening. This CMD, along with the mF322W2 vs. mF814W − mF150W2 CMD, has been utilized to construct the ChM shown in the inset. A visual inspection of the ChM distinctly identifies two stellar populations: 1P stars, concentrated near the origin of the reference frame, and 2P stars, which exhibit significantly larger absolute values of ΔF606W,F322W2 and ΔF814W,F150W2. These results are in agreement with recent findings by Scalco et al. (2024b), who identified 1P and 2P stars among M-dwarfs of NGC 6397 by using the same dataset.
We used the ChM derived from NIRCam photometry to identify bona fide groups of 1P and 2P stars, represented by teal and crimson points, respectively, in the leftmost panel of Fig. 12. Subsequently, we analyzed the distribution of these stars in other ChMs constructed using both NIRCam and Euclid photometry. The second panel from the left reproduces the ΔIE–JE versus ΔYE–HE ChM introduced in Fig. 10, where teal and crimson dots represent the 1P and 2P stars, respectively, for which both Euclid and NIRCam photometry is available. The observation that the majority of 1P and 2P stars, selected from the NIRCam ChM, occupy distinct regions in the Euclid ChM further strengthens the evidence for the presence of multiple populations in NGC 6397. If the pseudo-color broadening in the ChMs were solely due to observational errors, the teal and crimson groups of stars, selected from NIRCam photometry, would have an equal likelihood of displaying large or small ΔIE–JE and ΔYE–HE values. However, the observation that these two groups exhibit distinct average pseudo-colors in the Euclid ChM, as indicated by the small points with error bars, provides strong evidence for intrinsic pseudo-color variations associated with multiple populations (Anderson et al. 2009; Milone et al. 2010). For completeness, the two rightmost panels of Fig. 12 present two ChMs: ΔF606W–F322W2 versus ΔIE–JE and ΔYE–HE versus ΔF814W–F150W2, constructed using NIRCam and Euclid photometry. In both diagrams, the stars display an anticorrelation, with Spearman’s rank correlation coefficients of approximately 0.6. This finding further corroborates the presence of 1P and 2P stars among M-dwarfs.
To infer the relative oxygen abundances of 1P and 2P stars using Euclid data alone, we followed the recipe by Milone et al. (2023b), leveraging the HE versus YE − HE and HE versus IE − JE CMDs, corrected for differential reddening. These CMDs, reproduced in the left and middle panels of Fig. 13, are compared with alpha-enhanced isochrones from the BaSTI database (Pietrinferni et al. 2021). The black isochrones correspond to [Fe/H]=−2.02 and Y=0.246 and are consistent with those used by Massari et al. (2025). In addition, we derived the colors of blue and magenta isochrones, which share the same iron abundance as the black isochrones but are depleted in oxygen by 0.3 and 0.4 dex, respectively. Considering the negligible helium difference between 1P and 2P stars in NGC 6397 (ΔY = 0.006 ± 0.009; Milone et al. 2018), we assumed the same helium content for all isochrones. We determined five fiducial points corresponding to probable 1P and 2P stars, selected from the ChM in the right panel of Fig. 13. These fiducials, spanning the HE interval between 19.8 and 21.5 mag, are overlaid on the CMDs in this figure.
Although the black isochrones provide a reasonable match to the observed CMDs, small discrepancies between the fiducial points of 1P stars and the black isochrone are evident. To mitigate the impact of these discrepancies on the estimation of the relative abundances of multiple populations in NGC 6397, we plotted in the insets of Fig. 13 the YE − HE and IE − JE color differences between the 2P and 1P fiducials at various HE magnitudes. The blue and magenta lines in the insets represent the corresponding color differences between the O-poor isochrones and the black isochrone, showing a good match with the observed points. These isochrones are also superimposed on the ChM shown in the right panel of Fig. 13, where they cluster into three distinct small regions marked with triangles. Our analysis indicates that isochrones with [O/Fe]=0.1 provide the best match for the bulk of 2P stars, while isochrones with [O/Fe]=0.0 likely represent the 2P stars occupying the extreme positions in the ChM.
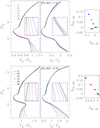 |
Fig. 8 Top panels. Isochrones with different contents of helium, carbon, nitrogen, and oxygen in the HE vs. YE − HE (left) and HE vs. IE − JE (right) CMDs. The right panel shows the ChM for the M-dwarfs highlighted in the insets of the left and middle panels. All isochrones in the top panels have [Fe/H]=−1.5 with the exception of the isochrones I 6, which are enhanced in iron abundance by 0.1 dex with respect to the other isochrones. Bottom panels represent the HE vs. YE − HE (left) and HE vs. IE − YE (right) CMDs, and the ChM derived from these CMDs for the M-dwarfs plotted in the CMD insets (right). The isochrones I1–I5 in the bottom panels share the same iron to hydrogen ratios, [Fe/H]=−0.75, while isochrones I6 have [Fe/H]=−0.65. |
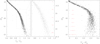 |
Fig. 9 CMDs of proper-motion selected stars in NGC 6397. The panels show the HE vs. IE − JE (left) and HE vs. YE − HE (right) diagram for cluster members. The photometry, derived from Euclid data (Libralato et al. 2024), has been corrected for the differential-reddening effects. |
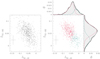 |
Fig. 10 Left panel. Observed ChM of NGC 6397 derived from Euclid photometry. Right panel: corresponding simulated ChM. The right panel also includes the kernel-density distributions of ΔIE–JE and ΔYE–HE for both the observed ChM (black lines) and the simulated ChM (gray lines with a shaded area). The red and blue dashed lines represent the simulated 1P and 2P stars, respectively. |
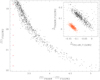 |
Fig. 11 mF322W2 vs. mF606W − mF322W2 CMD of proper-motion-selected members of NGC 6397, constructed using NIRCam data. The inset displays the ΔF606W–F322W2 vs. ΔF814W–F150W2 ChM, where black points represent NGC 6397 stars, and the orange points correspond to a simulated ChM for a single-population cluster. Red error bars indicate the typical color and magnitude uncertainties for stars in different magnitude bins. |
4.1 Internal kinematics of stellar populations in NGC 6397
The high-precision proper motions derived from Euclid, HST, and JWST data provide a unique opportunity to constrain the internal kinematics of NGC 6397 and better understand various unresolved questions about its stellar populations. To demonstrate the potential of this dataset, we will analyze the proper motions of stars in the central field and in Fields A to E to investigate the internal kinematics of 1P and 2P stars, placing constraints on the degree of proper-motion anisotropy in each population. Additionally, leveraging the availability of high-precision proper motions for Field A stars (spanning a wide mass range from ~0.1 to 0.8 solar masses) we aim to constrain the state of energy equipartition within this field.
4.1.1 Proper motion anisotropy
To study the internal dynamics of multiple populations in NGC 6397, we followed the procedure outlined in various works on this topic (e.g., Richer et al. 2013; Cordoni et al. 2020b,a; Libralato et al. 2022; Ziliotto et al. 2025). First, we converted the proper motions from Cartesian coordinates (μα cos δ, μδ) to radial and tangential components (μR, μT). Here, radial proper motions are defined as positive when moving outward, while tangential proper motions are positive for counter-clockwise rotation.
Next, we determined the velocity dispersions of 1P and 2P stars by considering the negative log-likelihood function:
![Mathematical equation: $\[\lambda=\prod_{i=1}^N p\left(v_i, \epsilon_i\right)\]$](/articles/aa/full_html/2025/04/aa53746-25/aa53746-25-eq2.png)
with the probability of finding a star with velocity vi and uncertainty ϵi given by:
![Mathematical equation: $\[p\left(v_i, \epsilon\right)=\frac{1}{2 \pi \sqrt{\left(\sigma^2+\epsilon_i^2\right)}} \exp \left(-\frac{\left(v_i-v\right)^2}{2\left(\sigma^2+\epsilon_i^2\right)}\right)\]$](/articles/aa/full_html/2025/04/aa53746-25/aa53746-25-eq3.png)
Finally, we found the intrinsic dispersion by maximizing the likelihood (see Mackey et al. 2013; Marino et al. 2014, for details). The uncertainties in the velocity dispersions were estimated using the Markov Chain Monte Carlo algorithm emcee (Foreman-Mackey et al. 2013). Finally, we calculated the anisotropy parameter as β = σT/σR − 1.
Considering the varying number of stars in the studied fields, we analyzed the central field, field A, and field D individually, while fields B, C, and E have been combined to increase the statistical significance of the results. For fields with a sufficient number of stars, specifically, the central field and field A, we defined two radial bins, each containing an equal number of stars.
Our results for all fields are presented in Fig. 14, with 1P stars shown in teal and 2P stars in crimson. The radial and tangential velocity dispersion profiles are displayed in the top and middle panels, respectively, while the anisotropy profile is shown in the bottom panel. We find that 1P and 2P stars exhibit similar radial and tangential velocity-dispersion profiles, with both populations displaying motion consistent with isotropy. These findings align with the average anisotropy distribution observed in dynamically old GCs, as inferred by Cordoni et al. (2024). The corresponding distributions are represented by teal and crimson lines, along with shaded areas, in Fig. 14.
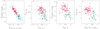 |
Fig. 12 Collection of ChMs for M dwarfs in NGC 6397. The leftmost panel reproduces the ΔF606W–F322W2 vs. ΔF814W–F150W2 ChM derived from NIRCam photometry, as presented in Fig. 11. In this panel, probable 1P and 2P stars are colored teal and crimson, respectively. The second panel from the left displays the ChM constructed from Euclid photometry, introduced in Fig. 10. Here, teal and crimson points with error bars indicate the average positions of 1P and 2P stars, respectively. The remaining panels present ChMs obtained by combining Euclid and NIRCam photometry. Large dots highlight stars with data available from both NIRCam and Euclid. |
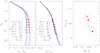 |
Fig. 13 Reproductions of the CMDs (left and middle panels) and the ChM (right panel) for the proper-motion-selected NGC 6397 cluster members from Figs. 9 and 10 are presented. Stars selected from the ChM are color-coded, with light-green and light-red representing 1P and 2P stars, respectively. Isochrones from the BaSTI database (Pietrinferni et al. 2021), with the same iron abundance ([Fe/H]=−2.02) but varying the oxygen content of [O/Fe]=0.4, 0.1, and 0.0, are shown in black, blue, and purple, respectively. These isochrones represent 1P stars, and 2P stars with intermediate and large oxygen variations. Segments of the isochrones with 19.8 < HE < 21.5 mag are highlighted as large triangles superimposed on the ChM. Teal and crimson large dots overlaid on the CMDs represent the fiducial lines for 1P and 2P stars, respectively. The crimson dots in the insets of the left and middle panels indicate the color differences between the fiducials of 2P and 1P stars, δ(YE − HE) and δ(IE − EE), at various HE magnitude levels. The color differences as a function of magnitude for the O-intermediate and O-poor 2P isochrones are also displayed. |
4.1.2 Energy equipartition
We know that GCs can undergo a process known as two-body relaxation, which drives them toward energy equipartition. In this state, lower-mass stars attain higher velocity dispersions compared to their higher-mass counterparts (Spitzer 1969). This phenomenon is typically quantified using the parameter η, which describes the relationship between velocity dispersion, σμ and stellar mass, M, as σμ ∝ Mη. Complete energy equipartition corresponds to η=0.5. However, N-body simulations reveal that GCs rarely achieve full equipartition, instead reaching a state of partial equipartition (Baumgardt & Makino 2003; Trenti & van der Marel 2013).
To investigate the state of energy equipartion of stars with high-quality proper motion measurements in field A, we considered giants and MS stars in different bins of mF814W and estimated the proper motion dispersion, σμ, as discussed in Sect. 4.1.1 and σμ=σT = σR. We repeated the same analysis for white dwarfs. The upper panel of Fig. 15 illustrates the proper motion dispersion as a function of the F814W magnitude. A marginal increase of 0.05 mas yr−1 is observed when comparing the velocity dispersion of giant stars to that of stars near the bottom of the MS. Additionally, white dwarfs exhibit a proper motion dispersion similar to that of most MS stars. The bottom panel of Fig. 15 plots σμ against the logarithm of stellar mass, which we inferred by using the best-fit isochrone from Pietrinferni et al. (2021). The straight line represents the best-fit least-squares line, with a slope corresponding to η = 0.05 ± 0.02. This result indicates that the studied stars in NGC 6397 exhibit only a very small degree of energy equipartition.
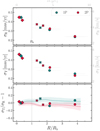 |
Fig. 14 Proper-motion dispersion along the radial (top panel) and tangential direction (middle panel) as a function of the distance from the cluster center. The lower panel shows the anisotropy parameter against the radial distance. The vertical lines mark the half-light radius, whereas teal and crimson symbols represent 1P and 2P stars, respectively. The results obtained from the HST, Euclid, and JWST ChMs are plotted with diamonds, crosses, and dots, respectively. The distance from the cluster center is reported in units of half-light radius (bottom x-axis) and parsecs (top x-axis). Similarly, velocities are shown in mas/yr on the left y-axis and km/s on the right y-axis. Here, we assumed the cluster distance and half-light radius provided by the 2010 version of the Harris (1996) catalog. The colored lines and shaded regions in the bottom panel represent the global anisotropy profiles of dynamically old clusters derived in Cordoni et al. (2024, see their Sects. 3.2 and 4). |
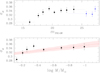 |
Fig. 15 Top panel: velocity dispersion, σμ, as a function of the mF814W magnitude for MS, SGB, and RGB stars (black circles) and for white dwarfs (blue circles). Bottom panel. σμ against the logarithm of stellar mass for MS, SGB, and RGB stars. We used light-red colors to represent the best-fit straight line. The horizontal segments indicate the magnitude and mass interval associated with each point. |
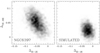 |
Fig. 16 Left panel: Hess diagram of the ΔYE–HE versus ΔIE–JE ChM constructed from Euclid photometry for NGC 6397 stars. The stars were selected based on positional displacements between the catalogs of Stetson et al. (2019) and Libralato et al. (2024). For comparison, the right panel shows the same ChM but exclusively for simulated 1P stars, highlighting the expected distribution of a single population. |
4.2 The radial distribution of multiple populations
To examine the radial distribution of 1P and 2P stars in NGC 6397, we utilized ChMs constructed from Euclid, HST, and JWST photometry. The ΔYE–HE versus ΔIE–JE Euclid ChM was derived using M-dwarfs identified as probable cluster members based on the positional displacements between the catalogs of Stetson et al. (2019) and Libralato et al. (2024). These stars are marked as black points in the middle and right panels of Fig. 2. The left panel of Fig. 16 displays the Hess diagram of this ChM, which includes stars spanning a broad FoV, from less than 2 arcminutes to 28 arcminutes from the center of NGC 6397. For comparison, the right panel of Fig. 16 shows the Hess diagram for simulated 1P stars only, constructed by incorporating observational photometric uncertainties. This simulated diagram represents the expected distribution of stars in a single-population cluster, underscoring the presence of multiple populations in NGC 6397.
To explore the central region of NGC 6397, we derived the result for ΔC,F275W,F336W,F438W versuss ΔF275W–F814W ChM for MS stars in the central field, as illustrated in Fig. 17. The bottom panel of this figure includes all MS stars, with probable binaries having high mass ratios (q≳0.5) highlighted by crimson star symbols. These binaries were identified based on their positions in the mF814W versus mF606W − mF814W and mF814W versus mF438W − mF814W CMDs. The top panels compare the observed ChM for probable single stars with the simulated ChM for 1P stars only, emphasizing the predominance of 2P stars among the analyzed stars in NGC 6397.
While a quantitative assessment of the binary fraction among 1P and 2P stars is outside the scope of this study, the observation that binaries with similar ΔF275W–F814W values span a wide range of ΔC,F275W,F336W,F438W suggests that the cluster core hosts comparable fractions of binary systems composed of both 1P and 2P stars. Furthermore, we used the ΔF606W–F322W2 versus ΔF814W–F150W ChM derived from NIRCam and ACS/WFC photometry of stars in field A, as introduced in Fig. 11.
We utilized each ChM to estimate the fractions of 1P and 2P stars by following the procedure outlined by Zennaro et al. (2019), which was also applied in Sect. 4. To better examine the population ratio as a function of radial distance, we defined five radial bins containing equal numbers of M-dwarfs used for the Euclid ChM, and two additional radial bins with equal numbers of bright MS stars used for the central-field ChM. Each bin was analyzed separately.
The resulting fractions of 2P stars are shown with black symbols in Fig. 18, alongside the 2P fraction derived by Milone et al. (2017a) for RGB stars, represented by a light-red symbol. Notably, the fraction of 2P stars inferred from MS stars in the central field and field A agrees, within one sigma, with the results by Milone et al. (2012c) and Scalco et al. (2024b) obtained from similar datasets. However, in the central field, the bright-MS star sample yields larger 2P fractions compared to the RGB results by Milone et al. (2017a), with agreement at only the ~1.5-sigma level.
Overall, we find that the fraction of 2P stars is approximately ~70% and remains nearly constant across the analyzed radial range. There is a slight indication that 2P stars may be slightly more concentrated, with their fraction decreasing by less than ~4% from the cluster center to the outer regions.
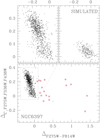 |
Fig. 17 ChM of NGC 6397 MS stars in the central field from HST photometry. The ChM shown in the bottom panel includes the MS binaries (starred symbols), whereas the top-left panel is a zoom on the ChM region occupied by single stars. Top-right panel shows the simulated ChM for 1P stars. |
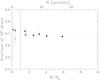 |
Fig. 18 Fraction of 2P stars as a function of radial distance from the cluster center. The radial scale is provided both in units of the half-light radius (Rh = 2.9 arcmin; 2010 version of the Harris 1996, catalog) and in arcminutes. Diamonds, crosses, and large dots represent results derived from HST, combined JWST and HST, and Euclid data, respectively. Results from this study are shown in black, while the fraction of 2P stars determined by Milone et al. (2017a) for RGB stars is depicted with a light-red diamond. Horizontal lines indicate the radial range associated with each determination of the 2P fraction. |
5 Summary and conclusions
We present the first study investigating multiple stellar populations in GCs using Euclid data. Our analysis begins with a theoretical exploration of how stellar populations with varying chemical compositions affect stellar magnitudes in the Euclid bands. To this end, we generated synthetic spectra for MS, SGB, and RGB stars with different helium, carbon, nitrogen, and oxygen contents. We examined metal-poor, metal-intermediate, and metal-rich clusters with [Fe/H]=−2.30, −1.50, and −0.75, respectively.
The fluxes of bright MS stars and giants are only minimally influenced by variations in C, N, and O abundances. In contrast, for M-dwarfs, the most pronounced differences between the spectra of 2P-like stars with enhanced C, N, and O and those of 1P-like stars with similar atmospheric parameters arises at wavelengths λ ≳ 13 000 Å. These differences, driven by molecular absorption involving oxygen, primarily affect the HE band and, to a lesser extent, the JE band. In addition, in the metal-rich populations, we have observed strong molecular absorption features affecting the optical portion of the M-dwarf spectra, which are responsible for large IE magnitude differences between 2P and 1P stars.
We used the synthetic spectra to derive the colors and magnitudes of Dartmouth isochrones that mimic 1P and 2P stars. For [Fe/H]=−1.50 and −2.30, the CMDs constructed with the YE − HE color provide the optimal separation between the M-dwarf sequences of 1P and 2P stars for all adopted helium abundances. The IE − JE color serves as an alternative for disentangling multiple populations among M-dwarfs; however, in stellar populations with large helium contents, the helium and oxygen variations have opposite effects on stellar colors. As a consequence, the ΔYE − ΔHE versus ΔIE − ΔJE would be an efficient tool to identify 1P and 2P stars among M-dwarfs.
In the case of metal-rich isochrones, due to the rise of molecular absorptions at wavelengths shorter than ~7000 Å, the IE band becomes very sensitive to the oxygen abundance of the M-dwarfs. At odds with what is observed at lower metallicities, the CMDs constructed with this filter are very efficient tools to identify multiple stellar populations in GCs. This phenomenon is similar to what is observed with HST filters, where CMDs constructed with the F606W band, whose transmission curve partially overlaps with the Euclid IE band, such as mF814W versus mF606W − mF814W, show nearly coincident M-dwarf sequences in metal-poor GCs, such as NGC 6397 (see, e.g., Fig. 4), but exhibit large color separations in metal-rich GCs, such as 47 Tucanae (e.g., Richer et al. 2013; Milone & Marino 2022; Marino et al. 2024a). Moreover, the YE − HE color is an efficient tool to disentangle 1P and 2P stars.
As a consequence, various photometric diagrams such as the ΔYE–HE versus ΔIE–YE or ΔYE–HE versus ΔIE–JE ChM and the pseudo-CMDs constructed with the CIE,YE,HE=(IE − YE)-(YE − HE) index are optimal diagrams to disentangle multiple populations in metal-rich GCs.
While variations in C, N, and O abundances do not significantly affect the colors of stars brighter than the MS knee, helium differences are responsible for the splitting of MS and faint RGB stars in CMDs constructed with the IE band. Helium-rich stars are hotter than stars with 1P-like helium abundance; hence, wide color baselines, such as IE − HE, would allow for the detection of distinct populations with different helium content.
This effect of helium on stellar color has been widely used in studies on multiple populations. The first evidence of multiple MSs in GCs has been provided by CMDs constructed with optical colors, such as the mF475W − mF814W or mF555W − mF814W colors from HST (e.g., Anderson 1997; Bedin et al. 2004; D’Antona et al. 2005; Piotto et al. 2007; Milone et al. 2010). Recent surveys of multiple populations in GCs with HST and ground-based telescopes utilize the ΔCF275W,F336W,F438W versus ΔF275W–F814W and ΔCU,B,I versus ΔB–I ChM, respectively (Milone et al. 2017a; Jang et al. 2022). The x-axis of these ChMs is derived from the mF275W − mF814W and B − I colors and is very sensitive to helium variations in GCs. In this context, the Euclid NIR magnitudes, together with far-UV or blue filters, would provide wider color baselines than those commonly used in the literature. As a consequence, the ΔCF275W,F336W,F438W versus ΔF275W-HE and ΔCU,B,I versus ΔB–HE ChMs would improve our capability to detect multiple stellar populations along the upper MS and the RGB.
Inspired by our theoretical findings, we have explored multiple populations in the nearby GC NGC 6397, recently observed by Euclid (Massari et al. 2025). We combined stellar astrometry and photometry obtained from Euclid data (Libralato et al. 2024) with observations from various facilities.
Specifically, we used archival HST and JWST images to derive high-precision photometry and astrometry of stars in six distinct fields. The stellar positions from these data, combined with those from Euclid, allowed us to derive accurate stellar proper motions. This approach enabled the discrimination of cluster members from field stars and facilitating the investigation of the internal kinematics of NGC 6397 stars. A further selection of cluster members across a wide FoV was achieved by analyzing the displacements between stellar positions in the Euclid catalog and the astro-photometric catalog provided by Peter Stetson. The main results on NGC 6397 include:
The ΔYE–HE versus ΔIE–JE ChM constructed from the HE versus IE − JE and HE versus YE − HE CMDs of proper-motion selected cluster members exhibit significant color broadening among M-dwarfs, which is consistent with the existence of two stellar populations. Approximately 30% of the studied M-dwarfs belong to the 1P population, with pseudocolor broadening consistent with observational errors. In contrast, the 2P stars display an intrinsic color broadening, indicative of small but significant star-to-star chemical inhomogeneities.
For stars in field A, we obtained deep photometry in the F606W and F814W bands of WFC/ACS and the F150W2 and F322W2 filters of NIRCam. Consistent with previous studies (Richer et al. 2006; Bedin et al. 2024; Scalco et al. 2024b; Gerasimov et al. 2024), these data enabled us to construct deep CMDs of NGC 6397 stars, revealing the faintest cluster members. For instance, the mF814W versus mF814W – mF150W2 CMD reaches the end of the white dwarf cooling sequence, showing sharp changes of the sequence slope at mF814W ~ 26.7 and 27.5 mag. Similarly, the mF322W2 versus mF150W2 − mF322W2 CMD approaches the hydrogenburning limit of MS stars and reveals the upper portion of the brown dwarf sequence. Despite the small number of faint MS stars, these diagrams hint at potential gaps among very low-mass stars, as recently observed in 47 Tucanae by Marino et al. (2024a).
HST and JWST photometry of stars in field A is used to derive the ΔF606W–F322W2 versus ΔF814W–F150W2 ChM, which clearly reveals the presence of 1P and 2P stars. The clustering of 1P and 2P stars, as identified in the ChM, constructed from NIRCam and ACS/WFC photometry into distinct regions of the Euclid ChM, further highlights the capability of Euclid photometry to disentangle multiple stellar populations in GCs.
-
We compared the distribution of 1P and 2P stars in the Euclid CMDs (HE versus IE − JE and HE versus YE − HE) and in the ΔYE − ΔHE versus ΔIE–JE ChM with α-enhanced isochrones from the BaSTi database (Pietrinferni et al. 2021), which account for the chemical composition of multiple populations in NGC 6397. The observations indicate that the bulk of 2P stars are depleted by ~0.3 dex in [O/Fe] compared to the 1P stars, which exhibit [O/Fe]=0.4. Additionally, a small fraction of 2P stars, comprising about one-fifth of the total 2P population, show lower oxygen abundances with [O/Fe]~0.0.
The average oxygen difference between 1P and 2P stars is consistent with the findings of Carretta et al. (2005), based on the spectroscopy of RGB stars, and Scalco et al. (2024b), who used NIRCam photometry of M-dwarfs, thus demonstrating that Euclid photometry is a valuable tool to estimate the content of light elements in 2P stars relative to the 1P. However, Lind et al. (2011) derived a smaller [O/Fe] difference between 1P and 2P stars of ~0.2 dex by using high-precision spectroscopy of RGB stars. The discrepancy between our results on the oxygen abundances of multiple populations in NGC 6397 and those by Lind and collaborators may be partially reconciled by considering that the oxygen content of 1P stars assumed in our study is approximately 0.3 dex lower than the value inferred by Lind et al. (2011).
The wide FoV of Euclid has enabled an extensive investigation into the radial distribution of multiple populations in NGC 6397. Using Euclid photometry, we identified multiple populations among M-dwarfs spanning a radial range from ~2 to ~28 arcmin from the cluster center. In the crowded central regions, where disentangling 1P and 2P stars with Euclid data is challenging, we utilized the ChM of bright MS stars constructed from F275W, F336W, F438W, and F814W images obtained with the UVIS/WFC3 and WFC/ACS cameras on HST. Our analysis reveals that the fraction of 1P stars remains nearly constant across the studied radial interval. However, there is a subtle indication of a possible gradient, with the fraction of 2P stars increasing by less than ~4% when moving from the outermost cluster regions toward the center.
Finally, we derived high-precision stellar proper motions by comparing stellar positions in Euclid images with archival images from HST and JWST. This enabled us to investigate the radial and tangential proper-motion dispersions of multiple populations at various distances from the cluster center. Our analysis reveals that 1P and 2P stars exhibit similar proper-motion distributions. Both populations display isotropic proper motions, consistent with the behavior typically observed in dynamically evolved GCs (Cordoni et al. 2024).
In summary, our theoretical analysis of multiple populations using Euclid data has identified the CMDs and ChMs best suited for distinguishing 1P and 2P stars. In particular, Euclid photometry proves to be an efficient tool for identifying multiple stellar populations in the low-mass regime of M dwarfs and inferring their oxygen abundances.
Unlike studies based on HST and JWST, Euclid’s wide FoV makes it ideally suited for analyzing multiple stellar populations across broad spatial extents and at varying radial distances from cluster centers. This capability provides crucial insights for constraining scenarios related to the formation and evolution of this elusive phenomenon.
These theoretical conclusions are strongly supported by our findings on NGC 6397. For the first time, we have identified the multiple populations of M dwarfs over a wide field of ~28 arcmin from the cluster center, constrained their radial distribution, and explored their internal kinematics.
Data availability
Tables of the positions of photometry of all stars are available at the CDS via anonymous ftp to cdsarc.cds.unistra.fr (130.79.128.5) or via https://cdsarc.cds.unistra.fr/viz-bin/cat/J/A+A/696/A221
Acknowledgements
This work has been funded by the European Union – NextGenerationEU RRF M4C2 1.1 (PRIN 2022 2022MMEB9W: “Understanding the formation of globular clusters with their multiple stellar generations”, CUP C53D23001200006, PI: Anna F. Marino), from INAF Research GTO-Grant Normal RSN2-1.05.12.05.10 – (ref. Anna F. Marino) of the “Bando INAF per il Finanziamento della Ricerca Fondamentale 2022”, and from the European Union’s Horizon 2020 research and innovation programme under the Marie Skłodowska-Curie Grant Agreement No. 101034319 and from the European Union – NextGenerationEU (beneficiary: T. Ziliotto).
Appendix A HST and JWST images
Table A.1 provides the main information on the images of NGC 6397 collected by HST and JWST and used in the paper. In addition we provide the coordinates of each studied field.
Information about the HST and JWST images used in this work.
Appendix B Multiple populations and cluster mass
In a recent study, Dondoglio et al. (2022) conducted a survey of multiple populations among M-dwarfs using F110W and F160W data collected with IR/WFC3 on board the HST. Analyzing the F110W–F160W color distribution of M-dwarfs, Dondoglio and collaborators concluded that the properties of multiple populations vary significantly between clusters. Notably, the MS width, WF110W,F160W, measured 2.0 magnitudes below the MS knee, exhibits strong correlations with both cluster mass and internal oxygen variation.
As a byproduct of our research, we utilize the mF160W versus, mF110W − mF160W CMD derived for central-field stars in NGC 6397, shown in the upper panel of Fig. B.1, to further investigate the relations identified by Dondoglio and collaborators. The results by Dondoglio et al. (2022) are reproduced in the bottom panels of Fig. B.1, where white and black dots represent the nine GCs studied by these authors and the open cluster NGC 6791, respectively.
The MS width of NGC 6397, determined from the CMD in Fig. B.1 using the method outlined by Dondoglio et al. (2022), is represented by an azure dot. The fact that our findings for NGC 6397 align with the established relations between cluster mass and oxygen variations supports the conclusion of Dondoglio and collaborators that the extent of internal oxygen variation in GCs depends on cluster mass. Similar trends involving internal nitrogen and helium variations among RGB stars have also been reported in previous studies (see Milone et al. 2017a, 2018; Lagioia et al. 2019; Jang et al. 2021).
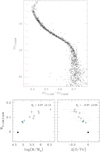 |
Fig. B.1 Top panel. mF160W vs. mF110W − mF160W CMD for NGC 6397 stars derived from IR/WFC3 data. Bottom panels. Color width of the M-dwarf sequence, WF110W,F160W, as a function of the logarithm of the cluster mass (left) and the internal oxygen variation (right). The black dot represents the open cluster NGC 6791, NGC 6397 is shown in azure, and the remaining GCs are displayed with white dots (Dondoglio et al. 2022). The Spearman’s rank correlation coefficients are quoted in each panel. |
References
- Anderson, A. J. 1997, PhD thesis, University of California, Berkeley, USA [Google Scholar]
- Anderson, J. 2022, AAS Meeting Abstracts, 240, 206.01 [Google Scholar]
- Anderson, J., & King, I. R. 2000, PASP, 112, 1360 [NASA ADS] [CrossRef] [Google Scholar]
- Anderson, J., & King, I. R. 2003, AJ, 126, 772 [NASA ADS] [CrossRef] [Google Scholar]
- Anderson, J., & King, I. R. 2006, PSFs, Photometry, and Astronomy for the ACS/WFC, Instrument Science Report ACS 2006-01, 34 pages [Google Scholar]
- Anderson, J., King, I. R., Richer, H. B., et al. 2008a, AJ, 135, 2114 [NASA ADS] [CrossRef] [Google Scholar]
- Anderson, J., Sarajedini, A., Bedin, L. R., et al. 2008b, AJ, 135, 2055 [Google Scholar]
- Anderson, J., Piotto, G., King, I. R., Bedin, L. R., & Guhathakurta, P. 2009, ApJ, 697, L58 [NASA ADS] [CrossRef] [Google Scholar]
- Bastian, N., & Lardo, C. 2018, ARA&A, 56, 83 [Google Scholar]
- Baumgardt, H., & Makino, J. 2003, MNRAS, 340, 227 [NASA ADS] [CrossRef] [Google Scholar]
- Bedin, L. R., Piotto, G., Anderson, J., et al. 2004, ApJ, 605, L125 [Google Scholar]
- Bedin, L. R., Nardiello, D., Salaris, M., et al. 2024, Astron. Nachr., 345, e20240039 [NASA ADS] [CrossRef] [Google Scholar]
- Bellini, A., & Bedin, L. R. 2009, PASP, 121, 1419 [CrossRef] [Google Scholar]
- Bellini, A., Anderson, J., & Bedin, L. R. 2011, PASP, 123, 622 [CrossRef] [Google Scholar]
- Branco, V., Coelho, P. R. T., Lançon, A., Martins, L. P., & Prugniel, P. 2024, A&A, 687, A142 [NASA ADS] [CrossRef] [EDP Sciences] [Google Scholar]
- Cadelano, M., Pallanca, C., Dalessandro, E., et al. 2023, A&A, 679, L13 [NASA ADS] [CrossRef] [EDP Sciences] [Google Scholar]
- Carretta, E., Gratton, R. G., Lucatello, S., Bragaglia, A., & Bonifacio, P. 2005, A&A, 433, 597 [NASA ADS] [CrossRef] [EDP Sciences] [Google Scholar]
- Carretta, E., Bragaglia, A., Gratton, R. G., et al. 2009, A&A, 505, 117 [NASA ADS] [CrossRef] [EDP Sciences] [Google Scholar]
- Cordoni, G., Milone, A. P., Marino, A. F., et al. 2020a, ApJ, 898, 147 [NASA ADS] [CrossRef] [Google Scholar]
- Cordoni, G., Milone, A. P., Mastrobuono-Battisti, A., et al. 2020b, ApJ, 889, 18 [Google Scholar]
- Cordoni, G., Casagrande, L., Milone, A., et al. 2024, arXiv e-prints [arXiv:2409.02330] [Google Scholar]
- Correnti, M., Gennaro, M., Kalirai, J. S., Cohen, R. E., & Brown, T. M. 2018, ApJ, 864, 147 [NASA ADS] [CrossRef] [Google Scholar]
- Cuillandre, J.-C., Bertin, E., Bolzonella, M., et al. 2025, A&A, 697, A6 [Google Scholar]
- D’Antona, F., Caloi, V., Montalbán, J., Ventura, P., & Gratton, R. 2002, A&A, 395, 69 [CrossRef] [EDP Sciences] [Google Scholar]
- D’Antona, F., Bellazzini, M., Caloi, V., et al. 2005, ApJ, 631, 868 [Google Scholar]
- Dondoglio, E., Milone, A. P., Renzini, A., et al. 2022, ApJ, 927, 207 [NASA ADS] [CrossRef] [Google Scholar]
- Dotter, A., Chaboyer, B., Jevremović, D., et al. 2008, ApJS, 178, 89 [Google Scholar]
- Dotter, A., Ferguson, J. W., Conroy, C., et al. 2015, MNRAS, 446, 1641 [Google Scholar]
- Euclid Collaboration (Cropper, M. S., et al.) 2025, A&A, 697, A2 [Google Scholar]
- Euclid Collaboration (Jahnke, K., et al.) 2025, A&A, 697, A3 [Google Scholar]
- Foreman-Mackey, D., Hogg, D. W., Lang, D., & Goodman, J. 2013, PASP, 125, 306 [Google Scholar]
- Gaia Collaboration (Brown, A. G. A., et al.) 2021, A&A, 649, A1 [NASA ADS] [CrossRef] [EDP Sciences] [Google Scholar]
- Gerasimov, R., Bedin, L. R., Burgasser, A. J., et al. 2024, ApJ, 971, 65 [NASA ADS] [CrossRef] [Google Scholar]
- Gratton, R., Bragaglia, A., Carretta, E., et al. 2019, A&A Rev., 27, 8 [NASA ADS] [CrossRef] [Google Scholar]
- Harris, W. E. 1996, AJ, 112, 1487 [Google Scholar]
- Jang, S., Milone, A. P., Lagioia, E. P., et al. 2021, ApJ, 920, 129 [NASA ADS] [CrossRef] [Google Scholar]
- Jang, S., Milone, A. P., Legnardi, M. V., et al. 2022, MNRAS, 517, 5687 [CrossRef] [Google Scholar]
- Kalirai, J. S., Anderson, J., Richer, H. B., et al. 2007, ApJ, 657, L93 [Google Scholar]
- Kraft, R. P. 1994, PASP, 106, 553 [Google Scholar]
- Kurucz, R. L. 1970, SAO Special Report, 309 [Google Scholar]
- Kurucz, R. L. 1993, SYNTHE Spectrum Synthesis Programs and Line Data (Cambridge, Mass.: Smithsonian Astrophysical Observatory) [Google Scholar]
- Kurucz, R. L., & Avrett, E. H. 1981, SAO Special Report, 391 [Google Scholar]
- Lagioia, E. P., Milone, A. P., Marino, A. F., Cordoni, G., & Tailo, M. 2019, AJ, 158, 202 [NASA ADS] [CrossRef] [Google Scholar]
- Lagioia, E. P., Milone, A. P., Legnardi, M. V., et al. 2024, arXiv e-prints [arXiv:2406.16824] [Google Scholar]
- Lee, J.-W. 2022, ApJS, 263, 20 [NASA ADS] [CrossRef] [Google Scholar]
- Legnardi, M. V., Milone, A. P., Armillotta, L., et al. 2022, MNRAS, 513, 735 [NASA ADS] [CrossRef] [Google Scholar]
- Legnardi, M. V., Milone, A. P., Cordoni, G., et al. 2023, MNRAS, 522, 367 [CrossRef] [Google Scholar]
- Legnardi, M. V., Milone, A. P., Cordoni, G., et al. 2024, A&A, 687, A160 [NASA ADS] [CrossRef] [EDP Sciences] [Google Scholar]
- Li, C., Zheng, Z., Li, X., et al. 2022, Res. Astron. Astrophys., 22, 095004 [Google Scholar]
- Libralato, M., Bellini, A., Bedin, L. R., et al. 2015, MNRAS, 450, 1664 [NASA ADS] [CrossRef] [Google Scholar]
- Libralato, M., Bellini, A., Vesperini, E., et al. 2022, ApJ, 934, 150 [NASA ADS] [CrossRef] [Google Scholar]
- Libralato, M., Bedin, L. R., Griggio, M., et al. 2024, A&A, 692, A96 [NASA ADS] [CrossRef] [EDP Sciences] [Google Scholar]
- Lind, K., Charbonnel, C., Decressin, T., et al. 2011, A&A, 527, A148 [NASA ADS] [CrossRef] [EDP Sciences] [Google Scholar]
- Mackey, A. D., Da Costa, G. S., Ferguson, A. M. N., & Yong, D. 2013, ApJ, 762, 65 [CrossRef] [Google Scholar]
- Marino, A. F., Villanova, S., Piotto, G., et al. 2008, A&A, 490, 625 [NASA ADS] [CrossRef] [EDP Sciences] [Google Scholar]
- Marino, A. F., Milone, A. P., Yong, D., et al. 2014, MNRAS, 442, 3044 [NASA ADS] [CrossRef] [Google Scholar]
- Marino, A. F., Milone, A. P., Renzini, A., et al. 2019a, MNRAS, 487, 3815 [CrossRef] [Google Scholar]
- Marino, A. F., Milone, A. P., Sills, A., et al. 2019b, ApJ, 887, 91 [NASA ADS] [CrossRef] [Google Scholar]
- Marino, A. F., Milone, A. P., Legnardi, M. V., et al. 2024a, ApJ, 965, 189 [NASA ADS] [CrossRef] [Google Scholar]
- Marino, A. F., Milone, A. P., Renzini, A., et al. 2024b, ApJ, 969, L8 [Google Scholar]
- Massari, D., Dalessandro, E., Erkal, D., et al. 2025, A&A, 697, A8 [Google Scholar]
- Mehta, V. J., Milone, A. P., Casagrande, L., et al. 2025, MNRAS, 536, 1077 [Google Scholar]
- Milone, A. P., & Marino, A. F. 2022, Universe, 8, 359 [NASA ADS] [CrossRef] [Google Scholar]
- Milone, A. P., Villanova, S., Bedin, L. R., et al. 2006, A&A, 456, 517 [NASA ADS] [CrossRef] [EDP Sciences] [Google Scholar]
- Milone, A. P., Piotto, G., King, I. R., et al. 2010, ApJ, 709, 1183 [NASA ADS] [CrossRef] [Google Scholar]
- Milone, A. P., Marino, A. F., Cassisi, S., et al. 2012a, ApJ, 754, L34 [NASA ADS] [CrossRef] [Google Scholar]
- Milone, A. P., Marino, A. F., Piotto, G., et al. 2012b, ApJ, 745, 27 [Google Scholar]
- Milone, A. P., Piotto, G., Bedin, L. R., et al. 2012c, A&A, 540, A16 [NASA ADS] [CrossRef] [EDP Sciences] [Google Scholar]
- Milone, A. P., Marino, A. F., Piotto, G., et al. 2013, ApJ, 767, 120 [NASA ADS] [CrossRef] [Google Scholar]
- Milone, A. P., Marino, A. F., Bedin, L. R., et al. 2014, MNRAS, 439, 1588 [NASA ADS] [CrossRef] [Google Scholar]
- Milone, A. P., Marino, A. F., Piotto, G., et al. 2015, ApJ, 808, 51 [NASA ADS] [CrossRef] [Google Scholar]
- Milone, A. P., Marino, A. F., Bedin, L. R., et al. 2017a, MNRAS, 469, 800 [NASA ADS] [CrossRef] [Google Scholar]
- Milone, A. P., Piotto, G., Renzini, A., et al. 2017b, MNRAS, 464, 3636 [Google Scholar]
- Milone, A. P., Marino, A. F., Renzini, A., et al. 2018, MNRAS, 481, 5098 [NASA ADS] [CrossRef] [Google Scholar]
- Milone, A. P., Marino, A. F., Bedin, L. R., et al. 2019, MNRAS, 484, 4046 [NASA ADS] [CrossRef] [Google Scholar]
- Milone, A. P., Cordoni, G., Marino, A. F., et al. 2023a, A&A, 672, A161 [NASA ADS] [CrossRef] [EDP Sciences] [Google Scholar]
- Milone, A. P., Marino, A. F., Dotter, A., et al. 2023b, MNRAS, 522, 2429 [CrossRef] [Google Scholar]
- Monelli, M., Milone, A. P., Stetson, P. B., et al. 2013, MNRAS, 431, 2126 [NASA ADS] [CrossRef] [Google Scholar]
- Nardiello, D., Milone, A. P., Piotto, G., et al. 2015, A&A, 573, A70 [NASA ADS] [CrossRef] [EDP Sciences] [Google Scholar]
- Norris, J. E. 2004, ApJ, 612, L25 [NASA ADS] [CrossRef] [Google Scholar]
- Pietrinferni, A., Hidalgo, S., Cassisi, S., et al. 2021, ApJ, 908, 102 [NASA ADS] [CrossRef] [Google Scholar]
- Piotto, G., Bedin, L. R., Anderson, J., et al. 2007, ApJ, 661, L53 [NASA ADS] [CrossRef] [Google Scholar]
- Piotto, G., Milone, A. P., Anderson, J., et al. 2012, ApJ, 760, 39 [NASA ADS] [CrossRef] [Google Scholar]
- Piotto, G., Milone, A. P., Bedin, L. R., et al. 2015, AJ, 149, 91 [Google Scholar]
- Renzini, A. 2017, MNRAS, 469, L63 [Google Scholar]
- Richer, H. B., Anderson, J., Brewer, J., et al. 2006, Science, 313, 936 [NASA ADS] [CrossRef] [PubMed] [Google Scholar]
- Richer, H. B., Heyl, J., Anderson, J., et al. 2013, ApJ, 771, L15 [NASA ADS] [CrossRef] [Google Scholar]
- Salaris, M., Cassisi, S., Mucciarelli, A., & Nardiello, D. 2019, A&A, 629, A40 [NASA ADS] [CrossRef] [EDP Sciences] [Google Scholar]
- Sarajedini, A., Bedin, L. R., Chaboyer, B., et al. 2007, AJ, 133, 1658 [Google Scholar]
- Sbordone, L., Bonifacio, P., Castelli, F., & Kurucz, R. L. 2004, Mem. Soc. Astron. It. Suppl., 5, 93 [Google Scholar]
- Sbordone, L., Salaris, M., Weiss, A., & Cassisi, S. 2011, A&A, 534, A9 [CrossRef] [EDP Sciences] [Google Scholar]
- Scalco, M., Gerasimov, R., Bedin, L. R., et al. 2024a, Astron. Nachr., 345, e20240018 [NASA ADS] [Google Scholar]
- Scalco, M., Libralato, M., Gerasimov, R., et al. 2024b, A&A, 689, A59 [NASA ADS] [CrossRef] [EDP Sciences] [Google Scholar]
- Scaramella, R., Amiaux, J., Mellier, Y., et al. 2022, A&A, 662, A112 [NASA ADS] [CrossRef] [EDP Sciences] [Google Scholar]
- Schirmer, M., Jahnke, K., Seidel, G., et al. 2022, A&A, 662, A92 [NASA ADS] [CrossRef] [EDP Sciences] [Google Scholar]
- Spitzer, Jr., L. 1969, ApJ, 158, L139 [NASA ADS] [CrossRef] [Google Scholar]
- Stetson, P. B. 2000, PASP, 112, 925 [Google Scholar]
- Stetson, P. B., Pancino, E., Zocchi, A., Sanna, N., & Monelli, M. 2019, MNRAS, 485, 3042 [Google Scholar]
- Trenti, M., & van der Marel, R. 2013, MNRAS, 435, 3272 [NASA ADS] [CrossRef] [Google Scholar]
- Yong, D., Grundahl, F., Johnson, J. A., & Asplund, M. 2008, ApJ, 684, 1159 [NASA ADS] [CrossRef] [Google Scholar]
- Zennaro, M., Milone, A. P., Marino, A. F., et al. 2019, MNRAS, 487, 3239 [CrossRef] [Google Scholar]
- Ziliotto, T., Milone, A., Marino, A. F., et al. 2023, ApJ, 953, 62 [NASA ADS] [CrossRef] [Google Scholar]
- Ziliotto, T., Milone, A. P., Cordoni, G., et al. 2025, arXiv e-prints [arXiv:2502.03140] [Google Scholar]
All Tables
All Figures
|
Fig. 1 Stacked image of the Euclid images in the HE band (Libralato et al. 2024). The right panel shows a zoom of the studied FoV, together with the footprints of the HST and JWST images used in this paper. The color scale is associated with the epoch as indicated by the color-bar on the right. The bottom panels compare the observations of a 30 square arcsec region obtained in the F606W and F814W bands of WFC/ACS, the F150W2 and F322W2 filters of NIRCam and the Euclid filters. |
| In the text | |
|
Fig. 2 Map of differential reddening toward NGC 6397. The color levels in the map correspond to the relative variation in E(B–V), with the scale indicated on the right (left panel). The middle panel presents the IE vs. IE − YE CMD corrected for differential reddening. The right panel shows IE plotted against the displacement (in Euclid VIS pixel units) relative to the average motion of NGC 6397. Probable cluster members are highlighted in black, while field stars are depicted in gray. |
| In the text | |
|
Fig. 3 Proper-motion diagram of stars in the field A. The light-red circle encloses the bulk of cluster members (left). mF322W2 versus mF150W2 − mF322W2 CMD from NIRCam data. Black circles and light-red points mark probable the proper-motion selected cluster members and field stars, respectively. The error bars colored teal and crimson represent the typical photometric uncertainties of white dwarfs and MS cluster stars, respectively, at different F322W2 magnitude values (right). |
| In the text | |
|
Fig. 4 mF606W vs. mF606W − mF814W (left) and mF814W vs. mF814W − mF150W2 (right) CMD of proper-motion selected cluster members. |
| In the text | |
|
Fig. 5 Left panels. Flux ratios were calculated for simulated spectra of stars with identical luminosity in the NIRCam F115W band but different chemical compositions. The 2P spectra are helium and nitrogen-enhanced while being carbon and oxygen-depleted compared to the 1P spectra. Light-blue spectra represent stars with the same C, N, O abundances as 1P stars but enriched in helium, while light-red spectra correspond to stars with 1P-like helium content but different C, N, and O abundances. The bottom, middle, and top panels correspond to M-dwarfs, K-dwarfs, and RGB stars, respectively (Milone et al. 2023a). For 1P stars and 2P-like stars with Y=0.246, the effective temperatures, Teff, and gravities, log(g), are 3762 K, 5901 K, 4746 K and 5.03, 4.50, 1.82, respectively. Helium-rich stars were modeled with Teff = 3808 K, 6048 K, 4803 K, and log(g)=5.03, 4.48, 1.78, based on Dotter et al. (2008) isochrones. Right panels. Transmission curves of the filters used in this paper. The Euclid filters (top), the F606W and F814W ACS/WFC and F110W F160W IR/WFC3 filters on board HST (middle), and the F150W2 and F322W2 filters of NIRCam/JWST. We superimpose on each panel the flux ratio between 2P and 1P M-dwarf with different helium and C, N, O abundances. |
| In the text | |
|
Fig. 6 Magnitude difference between a 1P star and a star with the same F115W magnitude and a chemical composition that resembles 2P stars. The azure points correspond to stars with the same chemical composition as 1P stars but enhanced in helium (Y=0.33). The light-red points are derived from spectra that share the same helium content as 1P stars but are enhanced in N and depleted in both C and O. Left, middle, and right panels show spectra with [Fe/H]=−0.75, −1.50, and −2.30 (Milone et al. 2023a; Ziliotto et al. 2023), respectively. The results for RGB, bright-MS stars, and M -dwarfs are shown in the top, middle, and bottom panel respectively. We display in the top-right corner of – each panel the effective temperature and the logarithm of gravity for 1P spectra. |
| In the text | |
|
Fig. 7 13 Gyr isochrones from the Dartmouth database (Dotter et al. 2008) with [α/Fe]=0.4 and with [Fe/H]=−1.50 (top panels) and [Fe/H]=−0.75 (bottom panels). Isochrones with pristine helium content (Y=0.246 and Y=0.254 for the top- and bottom-panels, respectively) are shown in aqua and light red, while those enriched in helium (Y=0.33) are displayed in blue and black. The light-red and black isochrones have chemical compositions with carbon and oxygen depletion of 0.5 and 0.9 dex, respectively, along with a nitrogen enhancement of 1.2 dex. In contrast, the aqua and blue isochrones represent stars with [O/Fe]=0.4 and solar abundances of carbon and nitrogen. |
| In the text | |
|
Fig. 8 Top panels. Isochrones with different contents of helium, carbon, nitrogen, and oxygen in the HE vs. YE − HE (left) and HE vs. IE − JE (right) CMDs. The right panel shows the ChM for the M-dwarfs highlighted in the insets of the left and middle panels. All isochrones in the top panels have [Fe/H]=−1.5 with the exception of the isochrones I 6, which are enhanced in iron abundance by 0.1 dex with respect to the other isochrones. Bottom panels represent the HE vs. YE − HE (left) and HE vs. IE − YE (right) CMDs, and the ChM derived from these CMDs for the M-dwarfs plotted in the CMD insets (right). The isochrones I1–I5 in the bottom panels share the same iron to hydrogen ratios, [Fe/H]=−0.75, while isochrones I6 have [Fe/H]=−0.65. |
| In the text | |
|
Fig. 9 CMDs of proper-motion selected stars in NGC 6397. The panels show the HE vs. IE − JE (left) and HE vs. YE − HE (right) diagram for cluster members. The photometry, derived from Euclid data (Libralato et al. 2024), has been corrected for the differential-reddening effects. |
| In the text | |
|
Fig. 10 Left panel. Observed ChM of NGC 6397 derived from Euclid photometry. Right panel: corresponding simulated ChM. The right panel also includes the kernel-density distributions of ΔIE–JE and ΔYE–HE for both the observed ChM (black lines) and the simulated ChM (gray lines with a shaded area). The red and blue dashed lines represent the simulated 1P and 2P stars, respectively. |
| In the text | |
|
Fig. 11 mF322W2 vs. mF606W − mF322W2 CMD of proper-motion-selected members of NGC 6397, constructed using NIRCam data. The inset displays the ΔF606W–F322W2 vs. ΔF814W–F150W2 ChM, where black points represent NGC 6397 stars, and the orange points correspond to a simulated ChM for a single-population cluster. Red error bars indicate the typical color and magnitude uncertainties for stars in different magnitude bins. |
| In the text | |
|
Fig. 12 Collection of ChMs for M dwarfs in NGC 6397. The leftmost panel reproduces the ΔF606W–F322W2 vs. ΔF814W–F150W2 ChM derived from NIRCam photometry, as presented in Fig. 11. In this panel, probable 1P and 2P stars are colored teal and crimson, respectively. The second panel from the left displays the ChM constructed from Euclid photometry, introduced in Fig. 10. Here, teal and crimson points with error bars indicate the average positions of 1P and 2P stars, respectively. The remaining panels present ChMs obtained by combining Euclid and NIRCam photometry. Large dots highlight stars with data available from both NIRCam and Euclid. |
| In the text | |
|
Fig. 13 Reproductions of the CMDs (left and middle panels) and the ChM (right panel) for the proper-motion-selected NGC 6397 cluster members from Figs. 9 and 10 are presented. Stars selected from the ChM are color-coded, with light-green and light-red representing 1P and 2P stars, respectively. Isochrones from the BaSTI database (Pietrinferni et al. 2021), with the same iron abundance ([Fe/H]=−2.02) but varying the oxygen content of [O/Fe]=0.4, 0.1, and 0.0, are shown in black, blue, and purple, respectively. These isochrones represent 1P stars, and 2P stars with intermediate and large oxygen variations. Segments of the isochrones with 19.8 < HE < 21.5 mag are highlighted as large triangles superimposed on the ChM. Teal and crimson large dots overlaid on the CMDs represent the fiducial lines for 1P and 2P stars, respectively. The crimson dots in the insets of the left and middle panels indicate the color differences between the fiducials of 2P and 1P stars, δ(YE − HE) and δ(IE − EE), at various HE magnitude levels. The color differences as a function of magnitude for the O-intermediate and O-poor 2P isochrones are also displayed. |
| In the text | |
|
Fig. 14 Proper-motion dispersion along the radial (top panel) and tangential direction (middle panel) as a function of the distance from the cluster center. The lower panel shows the anisotropy parameter against the radial distance. The vertical lines mark the half-light radius, whereas teal and crimson symbols represent 1P and 2P stars, respectively. The results obtained from the HST, Euclid, and JWST ChMs are plotted with diamonds, crosses, and dots, respectively. The distance from the cluster center is reported in units of half-light radius (bottom x-axis) and parsecs (top x-axis). Similarly, velocities are shown in mas/yr on the left y-axis and km/s on the right y-axis. Here, we assumed the cluster distance and half-light radius provided by the 2010 version of the Harris (1996) catalog. The colored lines and shaded regions in the bottom panel represent the global anisotropy profiles of dynamically old clusters derived in Cordoni et al. (2024, see their Sects. 3.2 and 4). |
| In the text | |
|
Fig. 15 Top panel: velocity dispersion, σμ, as a function of the mF814W magnitude for MS, SGB, and RGB stars (black circles) and for white dwarfs (blue circles). Bottom panel. σμ against the logarithm of stellar mass for MS, SGB, and RGB stars. We used light-red colors to represent the best-fit straight line. The horizontal segments indicate the magnitude and mass interval associated with each point. |
| In the text | |
|
Fig. 16 Left panel: Hess diagram of the ΔYE–HE versus ΔIE–JE ChM constructed from Euclid photometry for NGC 6397 stars. The stars were selected based on positional displacements between the catalogs of Stetson et al. (2019) and Libralato et al. (2024). For comparison, the right panel shows the same ChM but exclusively for simulated 1P stars, highlighting the expected distribution of a single population. |
| In the text | |
|
Fig. 17 ChM of NGC 6397 MS stars in the central field from HST photometry. The ChM shown in the bottom panel includes the MS binaries (starred symbols), whereas the top-left panel is a zoom on the ChM region occupied by single stars. Top-right panel shows the simulated ChM for 1P stars. |
| In the text | |
|
Fig. 18 Fraction of 2P stars as a function of radial distance from the cluster center. The radial scale is provided both in units of the half-light radius (Rh = 2.9 arcmin; 2010 version of the Harris 1996, catalog) and in arcminutes. Diamonds, crosses, and large dots represent results derived from HST, combined JWST and HST, and Euclid data, respectively. Results from this study are shown in black, while the fraction of 2P stars determined by Milone et al. (2017a) for RGB stars is depicted with a light-red diamond. Horizontal lines indicate the radial range associated with each determination of the 2P fraction. |
| In the text | |
|
Fig. B.1 Top panel. mF160W vs. mF110W − mF160W CMD for NGC 6397 stars derived from IR/WFC3 data. Bottom panels. Color width of the M-dwarf sequence, WF110W,F160W, as a function of the logarithm of the cluster mass (left) and the internal oxygen variation (right). The black dot represents the open cluster NGC 6791, NGC 6397 is shown in azure, and the remaining GCs are displayed with white dots (Dondoglio et al. 2022). The Spearman’s rank correlation coefficients are quoted in each panel. |
| In the text | |
Current usage metrics show cumulative count of Article Views (full-text article views including HTML views, PDF and ePub downloads, according to the available data) and Abstracts Views on Vision4Press platform.
Data correspond to usage on the plateform after 2015. The current usage metrics is available 48-96 hours after online publication and is updated daily on week days.
Initial download of the metrics may take a while.