Fig. 5
Download original image
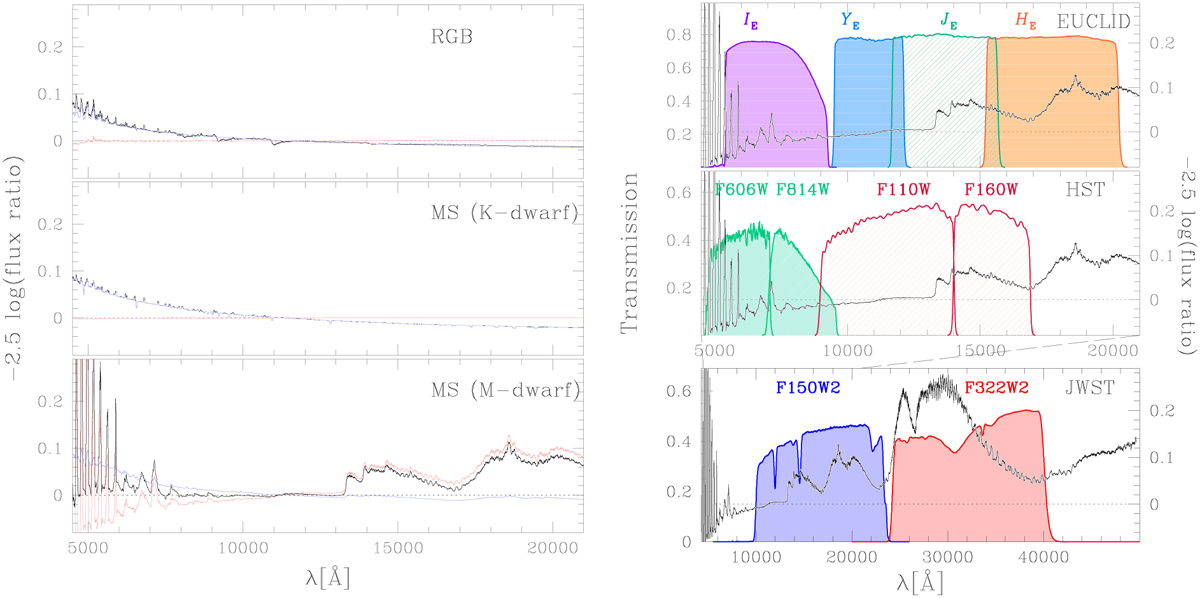
Left panels. Flux ratios were calculated for simulated spectra of stars with identical luminosity in the NIRCam F115W band but different chemical compositions. The 2P spectra are helium and nitrogen-enhanced while being carbon and oxygen-depleted compared to the 1P spectra. Light-blue spectra represent stars with the same C, N, O abundances as 1P stars but enriched in helium, while light-red spectra correspond to stars with 1P-like helium content but different C, N, and O abundances. The bottom, middle, and top panels correspond to M-dwarfs, K-dwarfs, and RGB stars, respectively (Milone et al. 2023a). For 1P stars and 2P-like stars with Y=0.246, the effective temperatures, Teff, and gravities, log(g), are 3762 K, 5901 K, 4746 K and 5.03, 4.50, 1.82, respectively. Helium-rich stars were modeled with Teff = 3808 K, 6048 K, 4803 K, and log(g)=5.03, 4.48, 1.78, based on Dotter et al. (2008) isochrones. Right panels. Transmission curves of the filters used in this paper. The Euclid filters (top), the F606W and F814W ACS/WFC and F110W F160W IR/WFC3 filters on board HST (middle), and the F150W2 and F322W2 filters of NIRCam/JWST. We superimpose on each panel the flux ratio between 2P and 1P M-dwarf with different helium and C, N, O abundances.
Current usage metrics show cumulative count of Article Views (full-text article views including HTML views, PDF and ePub downloads, according to the available data) and Abstracts Views on Vision4Press platform.
Data correspond to usage on the plateform after 2015. The current usage metrics is available 48-96 hours after online publication and is updated daily on week days.
Initial download of the metrics may take a while.