Fig. B.1
Download original image
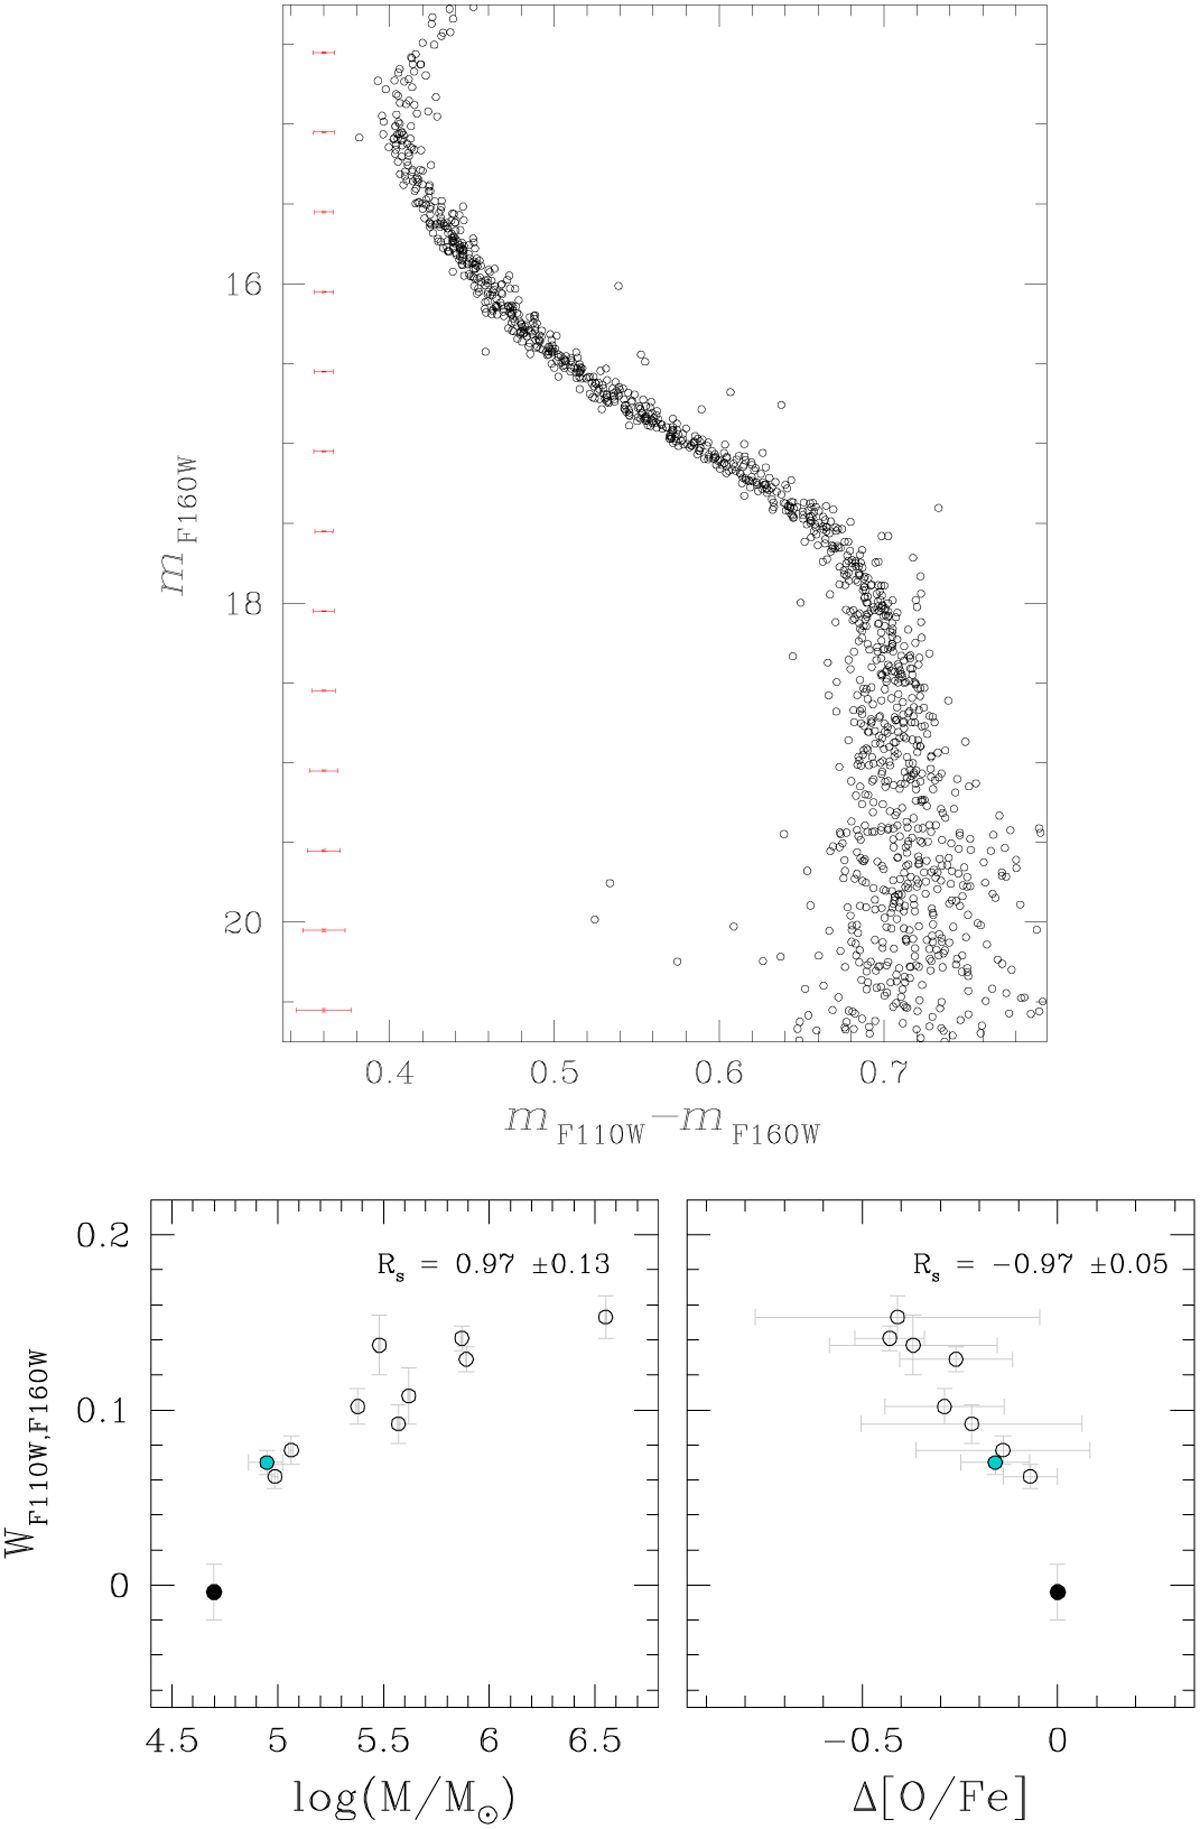
Top panel. mF160W vs. mF110W − mF160W CMD for NGC 6397 stars derived from IR/WFC3 data. Bottom panels. Color width of the M-dwarf sequence, WF110W,F160W, as a function of the logarithm of the cluster mass (left) and the internal oxygen variation (right). The black dot represents the open cluster NGC 6791, NGC 6397 is shown in azure, and the remaining GCs are displayed with white dots (Dondoglio et al. 2022). The Spearman’s rank correlation coefficients are quoted in each panel.
Current usage metrics show cumulative count of Article Views (full-text article views including HTML views, PDF and ePub downloads, according to the available data) and Abstracts Views on Vision4Press platform.
Data correspond to usage on the plateform after 2015. The current usage metrics is available 48-96 hours after online publication and is updated daily on week days.
Initial download of the metrics may take a while.