Fig. 14
Download original image
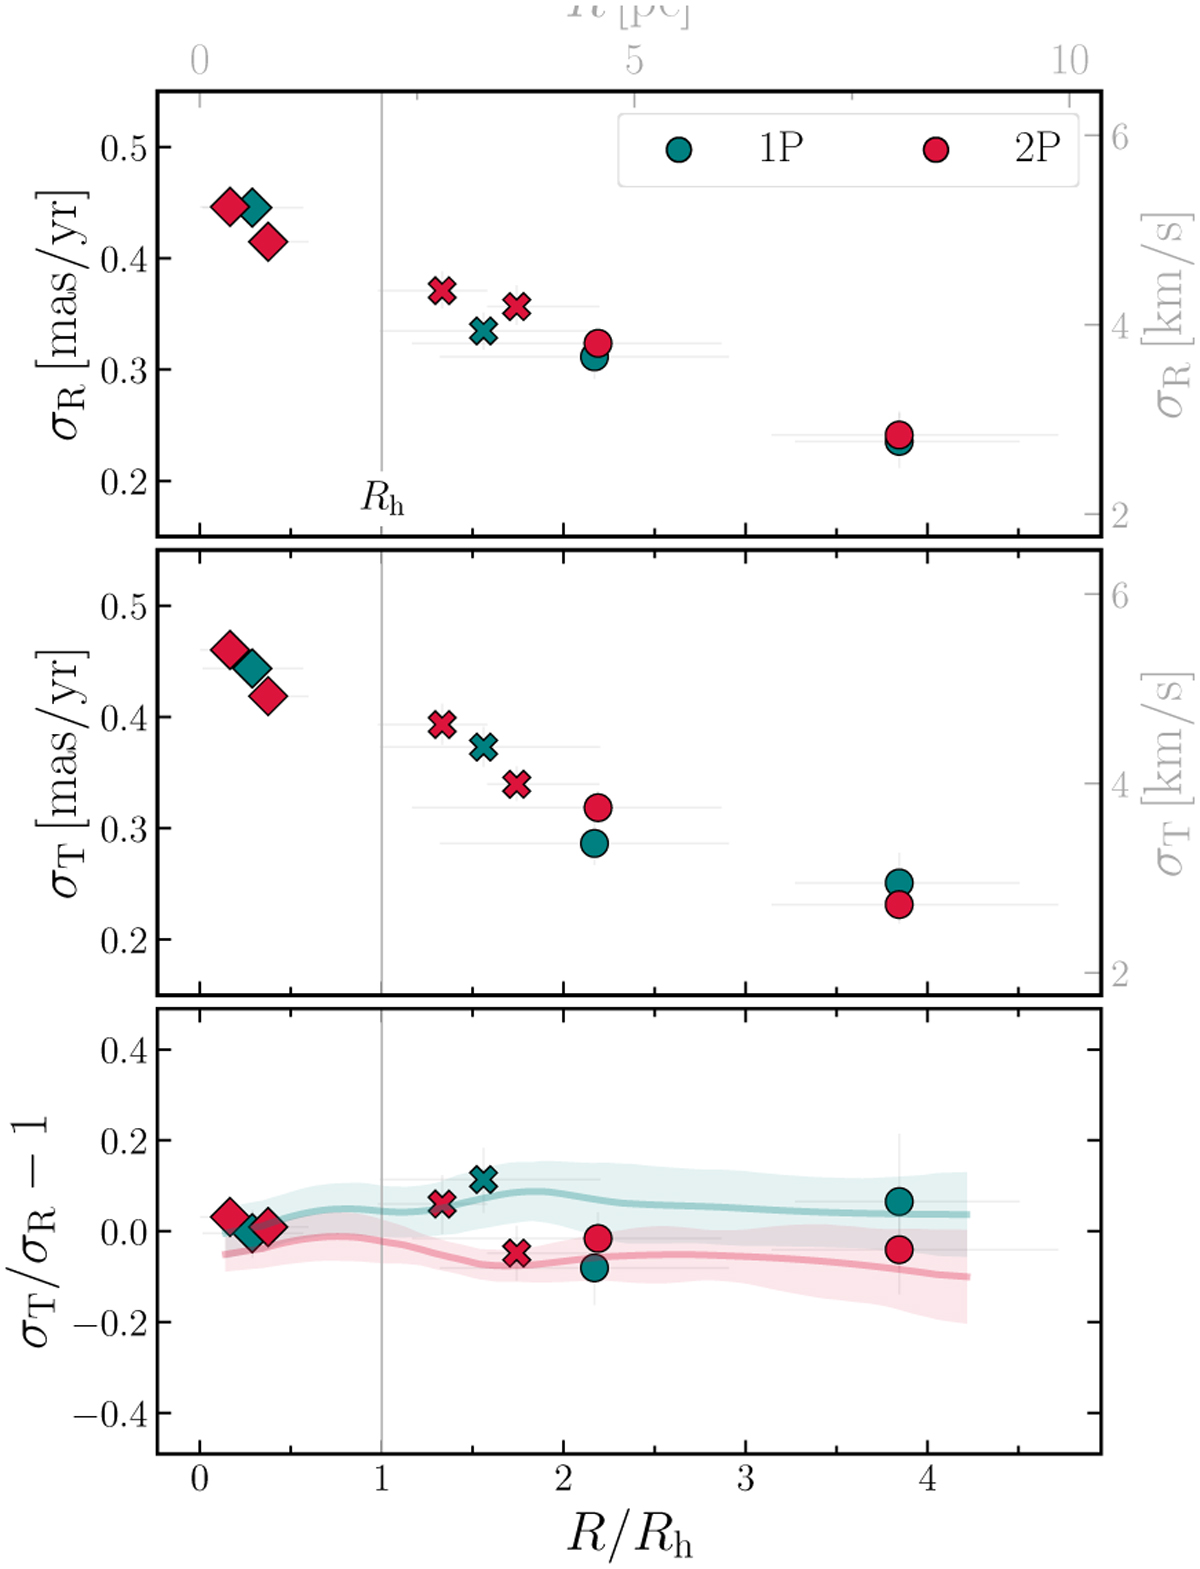
Proper-motion dispersion along the radial (top panel) and tangential direction (middle panel) as a function of the distance from the cluster center. The lower panel shows the anisotropy parameter against the radial distance. The vertical lines mark the half-light radius, whereas teal and crimson symbols represent 1P and 2P stars, respectively. The results obtained from the HST, Euclid, and JWST ChMs are plotted with diamonds, crosses, and dots, respectively. The distance from the cluster center is reported in units of half-light radius (bottom x-axis) and parsecs (top x-axis). Similarly, velocities are shown in mas/yr on the left y-axis and km/s on the right y-axis. Here, we assumed the cluster distance and half-light radius provided by the 2010 version of the Harris (1996) catalog. The colored lines and shaded regions in the bottom panel represent the global anisotropy profiles of dynamically old clusters derived in Cordoni et al. (2024, see their Sects. 3.2 and 4).
Current usage metrics show cumulative count of Article Views (full-text article views including HTML views, PDF and ePub downloads, according to the available data) and Abstracts Views on Vision4Press platform.
Data correspond to usage on the plateform after 2015. The current usage metrics is available 48-96 hours after online publication and is updated daily on week days.
Initial download of the metrics may take a while.