Fig. 2
Download original image
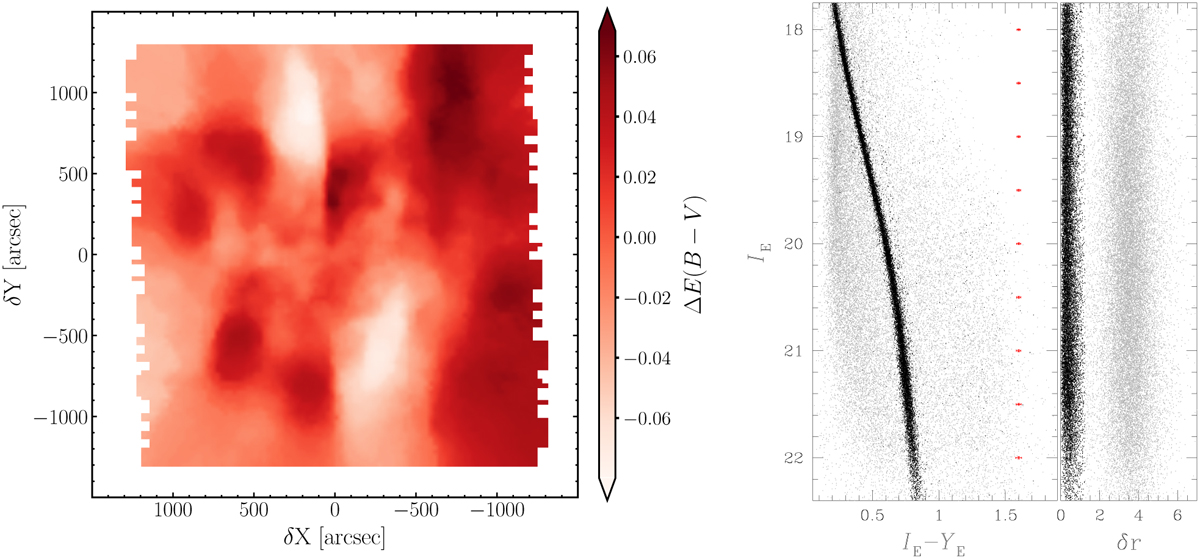
Map of differential reddening toward NGC 6397. The color levels in the map correspond to the relative variation in E(B–V), with the scale indicated on the right (left panel). The middle panel presents the IE vs. IE − YE CMD corrected for differential reddening. The right panel shows IE plotted against the displacement (in Euclid VIS pixel units) relative to the average motion of NGC 6397. Probable cluster members are highlighted in black, while field stars are depicted in gray.
Current usage metrics show cumulative count of Article Views (full-text article views including HTML views, PDF and ePub downloads, according to the available data) and Abstracts Views on Vision4Press platform.
Data correspond to usage on the plateform after 2015. The current usage metrics is available 48-96 hours after online publication and is updated daily on week days.
Initial download of the metrics may take a while.