Fig. 10
Download original image
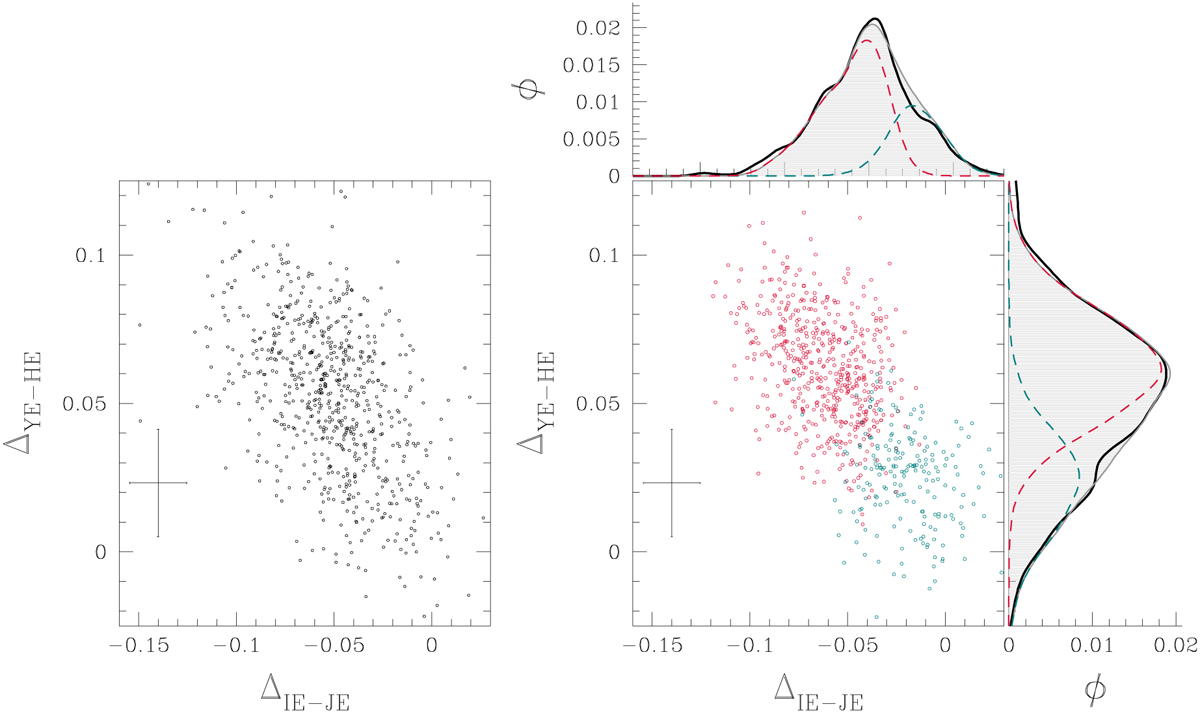
Left panel. Observed ChM of NGC 6397 derived from Euclid photometry. Right panel: corresponding simulated ChM. The right panel also includes the kernel-density distributions of ΔIE–JE and ΔYE–HE for both the observed ChM (black lines) and the simulated ChM (gray lines with a shaded area). The red and blue dashed lines represent the simulated 1P and 2P stars, respectively.
Current usage metrics show cumulative count of Article Views (full-text article views including HTML views, PDF and ePub downloads, according to the available data) and Abstracts Views on Vision4Press platform.
Data correspond to usage on the plateform after 2015. The current usage metrics is available 48-96 hours after online publication and is updated daily on week days.
Initial download of the metrics may take a while.