| Issue |
A&A
Volume 696, April 2025
|
|
|---|---|---|
| Article Number | A26 | |
| Number of page(s) | 15 | |
| Section | Planets, planetary systems, and small bodies | |
| DOI | https://doi.org/10.1051/0004-6361/202453473 | |
| Published online | 01 April 2025 | |
The effects of spatial scales on the in situ photometric analysis of the Chang’e-4 landing region
1
Center for Lunar and Planetary Science, Institute of Geochemistry, Chinese Academy of Sciences,
Guiyang,
China
2
University of Chinese Academy of Sciences,
Beijing,
China
3
State Key Laboratory of Solar Activity and Space Weather, National Space Science Center, Chinese Academy of Sciences,
Beijing,
China
4
Center for Excellence in Comparative Planetology, Chinese Academy of Sciences,
Hefei,
China
5
School of Space Science and Technology, Shandong University,
Weihai,
China
6
College of Geo-exploration Science and Technology, Jilin University,
Changchun,
China
★ Corresponding authors; This email address is being protected from spambots. You need JavaScript enabled to view it.
; This email address is being protected from spambots. You need JavaScript enabled to view it.
Received:
17
December
2024
Accepted:
17
February
2025
Abstract
Context. Visible and near-infrared reflectance spectroscopy is widely used to determine the surface composition and maturity of the Moon, but it may be influenced by the observation geometry. In situ observation is crucial for understanding the angular scattering behaviour of the lunar surface and can help to link laboratory measurements with orbital remote sensing. The Chang’e-4 (CE-4) rover has been exploring on the lunar surface for five years and has collected in situ spectral data covering a wide range of measurement angles.
Aims. Our aim is to investigate the impact of different spatial scales (from several centimetres to tens of centimetres) on the photometric analysis results of the CE-4 landing region and the phase reddening effects.
Methods. We constructed four sets of spectrophotometric data with different spatial scales (~2 cm, ~5.5 cm, ~10.5 cm, and ~15 cm × 21 cm) based on the spectral data acquired by the CE-4 imaging spectrometer and employed the Hapke model for photometric inversion analysis.
Results. For the four different spatial scales, the derived phase function parameters lie outside the ‘hockey stick’ area and the photometric roughness parameter is smaller than 10°. These parameters show clear variation trends as the spatial scale increases. The reflectance phase curves show a distinct bowl-like shape with a turning point near 90° of phase angle. The colour ratios (ratios of reflectance at two different wavelengths) manifest significant phase-angle dependence, which may affect the estimation of surface maturity. The colour ratio phase curves exhibit a distinct arch shape when involving visible bands (<745 nm), whereas it appears as a monotonically increasing pattern when both bands are in the near-infrared wavelength range (R945/R745).
Conclusions. Varied spatial scales have no significant effect on the phase curve shape and phase reddening effects, but do influence the photometric parameters derived using the Hapke model. This study could serve as a reference to link the discrepancies between laboratory and orbital research.
Key words: radiative transfer / techniques: photometric / Moon
© The Authors 2025
 Open Access article, published by EDP Sciences, under the terms of the Creative Commons Attribution License (https://creativecommons.org/licenses/by/4.0), which permits unrestricted use, distribution, and reproduction in any medium, provided the original work is properly cited.
This article is published in open access under the Subscribe to Open model. This email address is being protected from spambots. You need JavaScript enabled to view it. to support open access publication.
1 Introduction
Visible and near-infrared (VNIR) reflectance spectroscopy has been widely utilized for determining the surface mineralogical compositions of planetary bodies (e.g. Shkuratov et al. 2011; Pieters et al. 2013; Ohtake et al. 2013), because most rockforming silicates have diagnostic absorption features within this wavelength range (e.g. Clark et al. 1999; Chapman 2004; Gaffey 2010). However, the spectra of many bodies in our Solar System also exhibit variations in brightness and spectral features (e.g. Clark et al. 1999; Hapke 1993; Yang et al. 2020a) due to changes in observing geometries. To better retrieve the composition information from measured spectra, a photometric correction process is needed to normalize the spectral data collected under different observing geometries to a standard angle (e.g. Besse et al. 2013; Wu et al. 2013).
Photometric correction is also important for assessing the maturity induced by the space weathering process of the observed lunar surface. Space weathering encompasses a suite of space environmental processes that modify the surface materials of the Moon and other airless bodies (e.g. Housley et al. 1973; Adams & McCord 1973; Hapke et al. 1975; Chapman 1996; Pieters et al. 2000; Pieters & Noble 2016). It can cause significant alterations in the optical properties of lunar surface materials, primarily manifested as an overall reduction in spectral reflectance within the VNIR bands (known as darkening), an increase in spectral slope (reddening), and a weakening of absorption features (e.g. Chapman 1996; Hapke 2001; Pieters & Noble 2016). Based on these spectral changes, several spectroscopic parameters have been proposed to characterize the degree of space weathering (e.g. Fischer & Pieters 1996; Hiroi et al. 1997; Le Mouélic et al. 2000; Lucey et al. 2000; Noble et al. 2001; Hiroi & Sasaki 2001; Hapke 2001), among which optical maturity (OMAT) is the most widely used. It was initially developed by Lucey et al. (2000) as an empirical model, utilizing the R950/R750 (i.e. the ratio of reflectance at 950 nm to reflectance at 750 nm) and R750 (i.e. the reflectance at 750 nm) data of lunar soil samples with varying degrees of maturity. The R950/R750 value can characterize the extents of spectral reddening and weakening, while R750 gives the degree of spectral darkening. However, the spectral slope may also become larger with increasing observation phase angle, a phenomenon known as phase reddening (e.g. Gehrels et al. 1964; Sanchez et al. 2012). This effect has been observed in laboratory studies of terrestrial rocks and meteorite samples, as well as in situ detections and orbital remote sensing observations of the lunar surface (e.g. Gradie et al. 1980; Sanchez et al. 2012; Schröder et al. 2014; Jin et al. 2015; Jiang et al. 2019; Yang et al. 2020a; Hapke et al. 2012).
To better interpret the mineral compositions and weathering maturity from spectral data, a proper photometric model and accurate photometric parameters are required. The bidirectional reflectance distribution function (BRDF) is often used to describe the angular scattering behaviour of a surface (e.g. Hapke 2012b). It is determined not only by compositions of a surface, but also by the physical properties of the observed surface, such as particle size, porosity, and roughness (e.g. Hapke 2012b). Consequently, when a surface has been measured under a wide range of observing angles, a photometric model can be employed to fit the BRDF data, thereby enabling the retrieval of these critical physical properties (e.g. Hapke 2012a; Sato et al. 2014; Jin et al. 2015; Jiang et al. 2021). Throughout the past half-century, various photometric models have been proposed to describe the scattering properties of particulate surfaces, particularly the lunar surface (e.g. Kreslavsky et al. 2000; Wu et al. 2009; Shkuratov et al. 2011; Hapke 2012b; Besse et al. 2013; Shepard 2017). Among these models, the Hapke BRDF model, after years of iterative refinements, emerged as the most prevalent photometric model in planetary science because of its simplicity and effectiveness (e.g. Hapke 1981; Hapke & Wells 1981; Hapke 1984, 1986; Hapke et al. 1998; Hapke 2002, 2008, 2012a, 2021).
Generally, a photometric model is composed of three parts: an albedo term that describes the overall brightness of the surface, a disk function that describes the effects of incidence and emission angles, and a phase function that characterizes the dependency on phase angles (e.g. Kreslavsky et al. 2000; Shkuratov et al. 2011; Hapke 2012b). The Hapke model formulates the BRDF as a function of several factors, including the single scattering albedo (SSA), observing geometry, illumination angle, opposition effect (OE), single particle scattering phase function (P(g)), multiple scattering, and surface roughness (e.g. Hapke 1981, 2012b). The phase function has been formulated to characterize the angular distribution of light scattered by a single particle (e.g. Hapke 1981; McGuire & Hapke 1995; Hartman & Domingue 1998). For example, this function encapsulates the preference for forward or backward scattering and the degree of asymmetry in the scattering lobe. For photometric analysis, the most prevalent approximation for P(g) is the Henyey–Greenstein (HG) phase function (McGuire & Hapke 1995). The parameters within the HG function are often used for photometric classification of surface materials on planetary bodies (e.g. Hapke 2012a; Sato et al. 2014). For instance, the typical lunar highland materials exhibit more backscattering than mare materials (Sato et al. 2014).
A series of photometric studies have been conducted based on laboratory measurements of terrestrial samples and returned lunar soil samples (e.g. Mustard & Pieters 1989; Hartman & Domingue 1998; Cord et al. 2003; Shepard & Helfenstein 2007; Shkuratov et al. 2007; Souchon et al. 2011; Johnson et al. 2013; Schröder et al. 2014; Yang et al. 2019; Chang et al. 2023). However, replicating the original packing state of lunar regolith on the lunar surface in laboratory settings remains challenging, particularly due to the complex ‘fairy-castle’ structure (Hapke & van Horn 1963). Therefore, analysing the photometric properties of the lunar surface using in situ measurement data is critically important. To date, Jin et al. (2015) and Xu et al. (2022b) have conducted photometric analyses based on BRDF data acquired by the Chang’e-3 (CE-3) panoramic camera on the lunar surface. Nonetheless, their studies were limited to the visible wavelength range, and the research areas may have been affected by the rocket exhaust during the landing process (Clegg-Watkins et al. 2016). Similarly, another in situ photometric research area investigated by the Chang’e-5 (CE-5) mission (e.g. Xu et al. 2022a; Guo et al. 2024) was also affected by the rocket exhaust (Wang et al. 2023), highlighting the complexities involved in obtaining photometric data from pristine lunar surface.
The photometric data of lunar surface materials, acquired through laboratory measurements and orbital remote sensing, often exhibit notable discrepancies. For instance, the phase curves of terrestrial minerals (e.g. Shkuratov et al. 2007; Souchon et al. 2011; Schröder et al. 2014; Yang et al. 2019) and returned lunar soil samples (e.g. Johnson et al. 2013; Chang et al. 2023) tested in laboratory settings usually exhibit a bowl-shaped pattern. In contrast, orbital data typically display a monotonic decrease in reflectance with increasing phase angle (e.g. Hapke et al. 2012; Clegg-Watkins et al. 2017; Korokhin et al. 2016a,b; Velichko et al. 2024). This discrepancy may be attributable to two factors. Firstly, replicating the pristine packing conditions of lunar soil in the laboratory setting is challenging; secondly, there is a marked differences in spatial scale between laboratory measurements (millimetres to centimetres) and orbital observations (metres to hundreds of metres). In situ photometric observations of the lunar surface can help to link the gap between laboratory analysis and orbital remote sensing studies.
On January 3, 2019, the Chang’e-4 (CE-4) lander successfully touched down in the Von Kármán crater (I77.588°E, 45.457°S) on the lunar far side (Fig. 1a) and deployed the Yutu-2 rover for in situ detection of the lunar surface (Di et al. 2019). During the fourth lunar day of the mission’s operation, the Yutu-2 rover made its first trial for in situ spectrophotometric observations on the lunar surface. By rotating in place, it collected spectral data of seven adjacent sites under varying observing geometries (Lin et al. 2020a). Subsequently, on the tenth lunar day, the Yutu-2 rover conducted a more rigorous spectrophotometric experiment. The rover remained stationary and performed repeated observations at two adjacent sites at different times. A total of 23 reflectance spectra were obtained under various observing conditions. Notably, this represents the first rigorous spectrophotometric measurements conducted on the lunar surface that cover the entire visible to near-infrared wavelength range (450–2395 nm) (e.g. Lin et al. 2020b; Yang et al. 2020a).
Instead of using the two datasets specifically obtained for photometric analysis, we tried to make use of all the spectral data obtained in the past five years of the CE-4 mission operation. Until March 2024, the Yutu-2 rover had traversed more than 1600 m (Fig. 1b) and conducted 208 spectral measurements along its traverse. Therefore, we can collect photometric data covering a larger range of measurement angles, especially those measured outside the regions possibly affected by the rocket exhaust. This approach may provide a better insight into the photometric properties of the in situ regolith.
For this work, we analysed the in situ spectrophotometric data collected by the Yutu-2 rover over the past five years (2019–2024) using the Hapke model. Our aim was to retrieve the photometric parameters for surface regolith at the CE-4 landing region and to investigate the dependence of the BRDF and derived parameters on the spatial scale of observations. Furthermore, we explored the phase reddening effect and its impact on the evaluation of space weathering maturity. We believe that these findings can serve as a link between laboratory sample analysis and orbital remote sensing studies, facilitating a more comprehensive understanding of the lunar surface properties.
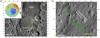 |
Fig. 1 Geologic context of CE-4 landing region and distribution of spectral detection sites. (a) Landing site of CE-4 (red flag). The basemap is from the Lunar Reconnaissance Orbiter Camera (LROC) Wide Angle Camera. The inset in the upper left corner is a digital elevation model; (b) VNIR measurement sites (green dots) along the Yutu-2 rover’s travel path. The Yutu-2 rover has been travelling in the northwest direction from the landing site. The basemap is from the LROC Narrow Angle Camera image. |
2 Data and methods
The Visible and Near-Infrared Imaging Spectrometer (VNIS), mounted on the front of the Yutu-2 rover, measured the lunar surface from a height of about 0.7 m. The VNIS consists of an imager (256 × 256 pixels) made of a complementary metal oxide semiconductor (CMOS) and a single-pixel short-wavelength infrared (SWIR) detector. The wavelengths of the CMOS imager and SWIR detector are 450–945 nm and 900–2395 nm, respectively, with spectral resolutions of 2.4–6.5 nm and 3.6–9.6 nm (e.g. Li et al. 2019b,a). For this work, we only used the CMOS data because it has a higher resolution in both spatial and angular dimensions compared to the SWIR data.
2.1 Absolute reflectance calibration
The radiometrically calibrated radiance data (level 2B) was divided by the distance-corrected solar irradiance data to obtain the absolute reflectance (reflectance factor, REFF). A detailed description of the calibration method can be found in Yang et al. (2020a). To derive the photometric values of pristine lunar surface regolith, we excluded the data measured at plume-disturbed, wheel-trenched, prominently shadowed, rocky, and cloddy sites. Additionally, images obviously exhibiting stray light reflected by the rover were also excluded, and data involved in the two possible artificial absorption bands within the ranges of 750–900 nm and 620–690 nm were masked; the details are described in Appendix A. Finally, a total of 92 CMOS hyperspectral images were included in the analysis (Appendix B, Table B.1).
For each CMOS data, the emission angles (e) and phase angles (g) are provided for the four corner and central pixels of the image. Here we assumed that the detected lunar surface was flat and horizontal when calculating the observing angles for each pixel. The assumption was reasonable given that the slope angles in the CE-4 landing area were less than 5° (e.g. Wu et al. 2021, 2020; Qiao et al. 2019) based on the analysis of large-scale (1 cm to 10 m/pixel) digital elevation models (DEMs) and digital terrain models (DTMs), and that the observed area was relatively small (~15 cm×2l cm). Moreover, we excluded image data that contained obvious rocks and wheel tracks. Linear interpolation was applied to calculate the emission and phase angles for all pixels of a CMOS image. Figure 2 presents an example CMOS image along with the corresponding distributions of emission and phase angles. The solar incidence angle (i) remains constant across all pixels within a CMOS image.
The relative azimuths and observing angles at the central pixel of each CMOS image are shown in Fig. 3. Most of the azimuth angles ranged from 0° to 180°, indicating that the solar light was incident from the right side of the rover. Conversely, a range of 180°–360° means that the Sun was positioned on the left side of the rover. The incident, emission, and phase angles spanned ranges of 55.2°–72.2°, 39.4°–51.9°, and 45.3°–111.6°, respectively.
2.2 Phase curve extraction
The CMOS data have a spatial resolution better than 1 mm/pixel (Yang et al. 2022). To investigate the photometric properties of lunar regolith at scales of centimetres to tens of centimetres, we constructed four photometric datasets by binning the CMOS data with varying intervals. The first dataset, referred to as CMOS-bin1, was obtained by averaging the reflectance and angle values within an interval of 1° phase angle by 1° emission angle for each CMOS data (Sato et al. 2014). CMOS-bin1 has a spatial scale of ~2 cm. For comparison, we applied bins with intervals of 2° by 2° and 4° by 4° to the CMOS data, generating two datasets with spatial scales of ~5.5 cm and ~10.5 cm. These two datasets are referred to as CMOS-bin2 and CMOS-bin4, respectively. We also averaged the entire data within each CMOS image to produce a dataset named CMOS-whole, which has a spatial scale of ~15 cm×2l cm (Yang et al. 2022). Subsequently, the phase curves of these datasets were extracted, and are shown in Fig. 4.
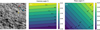 |
Fig. 2 Example CMOS image and distributions of emission and phase angles for each pixel. (a) CMOS image at a wavelength of 750 nm. The red, yellow, and blue arrows represent the relative azimuths of incident light, emergent light, and north direction, respectively. (b) Distribution of emission angles for each pixel. (c) Distribution of phase angles for each pixel. |
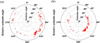 |
Fig. 3 Relative azimuth angle of the selected CMOS data. (a) and (b) show the relative azimuth angle along with incidence and emission angles, respectively. The angle values presented were extracted from the central pixel of each CMOS image. The relative azimuth angle was defined as the azimuth angle of the rover relative to the Sun. |
2.3 Photometric analysis using the Hapke model
In this work, we adopt the Hapke model for photometric analysis. The full version of the Hapke model contains nine parameters:
![Mathematical equation: $\matrix{ {R(i,e,) = K{{{\omega _0}} \over {4{\mu _0}}}{{{\mu _{0e}}} \over {{\mu _{0e}} + {\mu _e}}}\left\{ {P()\left[ {1 + {B_s}()} \right] + H\left( {{\mu _{0e}}/K,{\omega _0}} \right)} \right.} \cr {\left. {H\left( {{\mu _e}/K,{\omega _0}} \right) - 1} \right\}\left[ {1 + {B_C}()} \right]S(i,e,\bar \theta ),} \cr } $](/articles/aa/full_html/2025/04/aa53473-24/aa53473-24-eq1.png) (1)
(1)
where R is the reflectance factor (REFF); i, e, and g are the incidence, emission, and phase angles, respectively; K is the porosity factor; ω0 is the SSA; µ0 is the cosine of i;  and µe are the cosines of the effective i and the effective e, respectively; P(g) is the average particle single-scattering phase function; H (x, ω0) is the Ambartsumian-Chandrasekhar H function; and
  is the shadowing function. The functions BS (g) and BC(g) describe the shadow-hiding opposition effect (SHOE) and the coherent-back-scattering opposition effect (CBOE) at small phase angle ranges, respectively (e.g. Hapke et al. 1998; Hapke 2012b).
When fitting to a photometric dataset, various simplified versions of the Hapke model were employed in previous studies (e.g. Hapke et al. 2012; Sato et al. 2014; Jin et al. 2015; Lin et al. 2020b), making the photometric parameters retrieved in different studies incomparable. Since the OE only occurs at small phase angles, the parameters that characterize the OE are usually ignored for data obtained at large phase angles. The porosity parameter K was often set to be 1 in previous studies (Sato et al. 2014), despite the dependence of the bidirectional reflectance on the porosity of planetary regolith. Considering that our data were all collected at phase angles larger than 41°, we ignored the OE terms in our photometric fitting, but retained the porosity parameter K. Consequently, the Hapke model used in this work is a five-parameter version:
 (2)
(2)
The phase function P(g) is approximated using the HG phase function (McGuire & Hapke 1995),
 (3)
(3)
where the left and right parts describe the backward-scattering lobe and forward-scattering lobe, respectively (McGuire & Hapke 1995). The parameter c accounts for the relative strength of the backward- and forward-scattering lobes, and b is the shape-controlling parameter of the two scattering lobes. Since P(g) has extremes at g = 0° and 180°, c and b must satisfy the condition in mathematics:
 (4)
(4)
The H function is approximated by (Hapke 2002)
![Mathematical equation: $H\left( {x,{\omega _0}} \right) \approx {\left\{ {1 - {\omega _0}x\left[ {{r_0} + {{1 - 2{r_0}x} \over 2}\ln \left( {{{1 + x} \over x}} \right)} \right]} \right\}^{ - 1}},$](/articles/aa/full_html/2025/04/aa53473-24/aa53473-24-eq7.png) (5)
(5)
where r0 is the diffusive reflectance, given by
 (6)
(6)
Since i ≥ e for the three datasets (see Appendix C, Fig. C.1), the roughness shadowing function is given by
![Mathematical equation: $S(i,e,\bar \theta ) = {{{\mu _e}} \over {\eta (e)}}{{{\mu _0}} \over {\eta (i)}}{{\chi (\bar \theta )} \over {1 - f(\psi ) + f(\psi )\chi (\bar \theta )[\mu /\eta (e)]}},$](/articles/aa/full_html/2025/04/aa53473-24/aa53473-24-eq9.png) (7)
(7)
where  is the subpixel photometric roughness. The remaining parameters of the model are expressed as
![Mathematical equation: ${\mu _{0e}} = \chi (\bar \theta )\left[ {{\mu _0} + \sin (i)\tan (\bar \theta ){{{{\rm{E}}_2}(i) - {{\sin }^2}(\psi /2){{\rm{E}}_2}(e)} \over {2 - {{\rm{E}}_1}(i) - (\psi /\pi ){{\rm{E}}_1}(e)}}} \right],$](/articles/aa/full_html/2025/04/aa53473-24/aa53473-24-eq11.png) (8)
(8)
![Mathematical equation: ${\mu _e} = \chi (\bar \theta )\left[ {\mu + \sin (e)\tan (\bar \theta ){{\cos (\psi ){{\rm{E}}_2}(i) + {{\sin }^2}(\psi /2){{\rm{E}}_2}(e)} \over {2 - {{\rm{E}}_1}(i) - (\psi /\pi ){{\rm{E}}_1}(e)}}} \right],$](/articles/aa/full_html/2025/04/aa53473-24/aa53473-24-eq12.png) (9)
(9)
![Mathematical equation: $\chi (\bar \theta ) = 1/{\left[ {1 + \pi {{\tan }^2}(\bar \theta )} \right]^{1/2}},$](/articles/aa/full_html/2025/04/aa53473-24/aa53473-24-eq13.png) (10)
(10)
![Mathematical equation: $\eta (y) = \chi (\bar \theta )\left[ {\cos (y) + \sin (y)\tan (\bar \theta ){{{E_2}(y)} \over {2 - {E_1}(y)}}} \right],$](/articles/aa/full_html/2025/04/aa53473-24/aa53473-24-eq14.png) (11)
(11)
 (12)
(12)
 (13)
(13)
![Mathematical equation: $f(\psi ) = \exp \left[ { - 2\tan \left( {{\psi \over 2}} \right)} \right],$](/articles/aa/full_html/2025/04/aa53473-24/aa53473-24-eq17.png) (14)
(14)
![Mathematical equation: $\psi = \arccos \left[ {{{\cos (g) - \mu {\mu _0}} \over {\sin (e)\sin (i)}}} \right],$](/articles/aa/full_html/2025/04/aa53473-24/aa53473-24-eq18.png) (15)
(15)
where y corresponds to i or e, and ψ is the azimuth angle.
The five parameters in this study are the porosity factor (K), the phase function parameters (b and c), the single scattering albedo (ω0), and the photometric roughness  . The inverting results are highly sensitive to the initial values of the five parameters. To avoid obtaining a local optimal solution, we randomly generated ten million parameter combinations within the range of each parameter’s value domain and input them into the model. Ultimately, we acquired the optimal parameter combinations characterized by the minimum root mean square error (RMSE), which quantifies the difference between the model’s modelled values and the actual measured values.
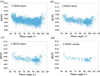 |
Fig. 4 Phase curves of the four datasets extracted at a wavelength of 500 nm. |
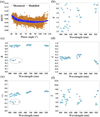 |
Fig. 5 Modelled phase curve and derived values of five photometric parameters for the CMOS-bin1 dataset. (a) Phase curves at a wavelength of 500 nm. (b–f) Derived parameter values varying with wavelength for K, b, c, ω0, and |

2.4 Phase reddening analysis using the reflectance ratio
To analyse the influence of the phase reddening effect on the maturity estimation, the colour ratios of R945/R745 at varying phase angles were extracted and calculated for the four datasets. The R945 and R745 were the mean values over three adjacent bands to reduce measurement errors induced by the detector band response instability. For comparison with laboratory study results (Schröder et al. 2014), the colour ratios of R600/R500 were similarly extracted and calculated.
3 Results
3.1 Phase-angle dependence of reflectance and derived photometric parameters
Figure 5 shows the model inversion results for the CMOS-bin1 dataset. The phase curve exhibits a general bowl shape, with a notable turning point occurring at a phase angle of ~90°. The minimum RMSE values between the modelled and measured phase curves for all wavelengths are lower than 2 × 10⁻², indicating a high predicting quality of the photometric model. As an example, Fig. 5a displays the modelled and measured phase curves at a wavelength of 500 nm.
Figures 5b to 5f depict the derived parameter values for all the CMOS wavelengths. Among the five parameters there is a certain continuity between the derived values of b, c, and SSA at different wavelengths. It is worth noting that the derived values of b and SSA exhibit two distinct groups (Figs. 5c and 5e). Specifically, within certain visible wavelengths, the best-fit parameter values are clearly smaller than those of other wavelengths. Considering that the spectral reflectance is continuous across these wavelengths, the derived values of parameter SSA for each adjacent band should thus be causally related and generally should not exhibit abrupt changes (e.g. Mustard & Pieters 1989; Yang et al. 2019), just as the inversion results for most other bands. These abnormal values might be attributed to some unknown reasons. The points marked with grey circles in Figs. 5c and 5e are for the same bands. In theory, the porosity parameter K and roughness parameter  should be independent of wavelength. However, the inverted parameter values of parameter K and roughness parameter
  do not coverage to a constant, but instead vary randomly with wavelength. The wavelength- averaged parameter values are summarized in Appendix D, Table D.1, with the abnormal points in the visible range excluded.
Figures 6 and 7 show the inversion results for the CMOS- bin2 and CMOS-bin4 datasets, respectively. With the spatial scale increasing from ~2 cm to ~10.5 cm, the phase curves still show bowl-like shapes, and the positions of their turning points show no clear differences compared to that of the CMOS-bin1 dataset. Regarding the wavelength dependence of the five parameters, the distribution patterns of each derived parameter closely resemble those observed in the CMOS- bin1 dataset. For the wavelength-averaged parameter values (Appendix D, Table D.1), the parameter c continuously decreases from –0.05 (CMOS-bin1) to –0.21 (CMOS-bin4), suggesting enhanced forward scattering (e.g. Sato et al. 2014; Yang et al. 2019) with increasing spatial scale. Additionally, the parameter b slightly decreases from 0.91 (CMOS-bin1) to 0.87 (CMOS-bin4), implying a broader and/or lower scattering lobe (McGuire & Hapke 1995). There is also a notable increasing trend for the derived  values when the spatial scale becomes larger, whereas the derived SSA values show a slightly decreasing trend.
For the CMOS-whole dataset, the phase curve shape and the wavelength dependence of the derived parameters are all similar to those observed in the other three datasets (Fig. 8). As the spatial scales increase for the other three datasets, there are clear reduction trends in the derived wavelength-averaged parameters b, c, and SSA, accompanied by increasing trends for the parameters K and θ. However, the CMOS-whole dataset, which has the largest spatial scale in our analysis (~15 cm by 21 cm), does not follow the trends as expected. As shown in Fig. 9, Appendix D, Table D.1, the derived values of b, c, and SSA are very close to those of the CMOS-bin1 dataset. In contrast, the derived value of parameter θ for the CMOS- whole dataset is much larger than that of the other three datasets.
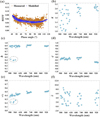 |
Fig. 6 Modelled phase curve and derived values of five photometric parameters for the CMOS-bin2 dataset. (a) Phase curves at a wavelength of 500 nm. (b–f) Derived parameter values varying with wavelength for K, b, c, ω0, and |

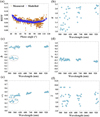 |
Fig. 7 Modelled phase curve and derived values of five photometric parameters for the CMOS-bin4 dataset. (a) Phase curves at a wavelength of 500 nm. (b–f) Derived parameter values varying with wavelength for K, b, c, ω0, and |

3.2 Phase-angle dependence of colour ratios
The phase reddening effect (i.e. when the spectral slope becomes steeper with increasing phase angle) is often characterized using the colour-ratio phase curve (e.g. Kaydash et al. 2010; Jin et al. 2015; Jiang et al. 2021; Hapke et al. 2012). For this study we examined the ratios of R600/R500 (i.e. ratio of reflectance at 600 nm to reflectance at 500 nm) and R945/R745 as a function of phase angle for all datasets. As shown in Fig. 10, the phase reddening effect is evident across all four datasets, with an increase in colour ratio values for R600/R500 and R945/R745 at larger phase angles. Although the R945/R745 colour-ratio phase curves exhibit some fluctuations, an overall increasing trend with increasing phase angle is still clear for all four datasets. In contrast, the R600/R500 colour-ratio phase curves appear smoother, with a trend that transfers from increasing to decreasing at a phase angle of 90° for all four datasets. This transition point is similar to the turning point observed in the reflectance phase curves (Figs. 5a, 6a, 7a, and 8a).
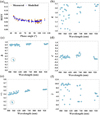 |
Fig. 8 Modelled phase curve and derived values of five photometric parameters for the CMOS-whole dataset. (a) Phase curves at a wavelength of 500 nm. (b–f) Derived parameter values varying with wavelength for K, b, c, ω0, and |

3.3 Evaluation of space weathering maturity
The enhanced reddening effects associated with increasing phase angle may result in an overestimation of the space weathering maturity of the lunar regolith (Yang et al. 2020a). In the R945/R745 versus R745 plot, which is often used for the qualitative assessment of the weathering maturity of lunar regolith, the data points for all four datasets exhibit considerable dispersion (Lucey et al. 2000), particularly with respect to the R945/R745 values at different phase angles (Fig. 11). Consequently, the space weathering maturity of the lunar regolith derived from these spectral data will also have a large variation. Overall, data measured at larger phase angles tend to yield higher maturity. Compared to the returned lunar soil samples (e.g. Morris 1978; Taylor et al. 2001; Pieters et al. 2006), our results indicate that the top layer of the lunar regolith in the CE-4 landing region, which remains pristine, has a high degree of maturity. Regarding the effects of spatial scale, the CMOS-whole dataset exhibits the least dispersion, whereas the CMOS-bin4 dataset shows the most dispersion. However, there are no significant differences in the overall distribution patterns among the four datasets.
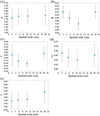 |
Fig. 9 Parameter values at different spatial scales. Panels (a) to (e) show the values for K, b, c, ω0, and |

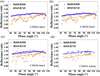 |
Fig. 10 Colour ratio phase curves for the four datasets with different spatial scales. Panels ato d show the results for the CMOS-bin1, CMOS- bin2, CMOS-bin4, and CMOS-whole datasets, respectively. Each point in these subfigures is the mean value within a 1° phase angle bin. The lines in these subfigures are the best-fit results with either a first-order polynomial or a third-order polynomial. |
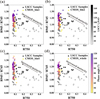 |
Fig. 11 Distribution patterns of the R945/R745 values against reflectance at 745 nm. Panels ato d show the results for the CMOS-bin1, CMOS-bin2, CMOS-bin4, and CMOS-whole datasets, respectively. The squares represent the CMOS data and the circles represent the LSCC samples. Each square in these subfigures is the mean value within a 1° phase angle bin. The spectra of the Apollo returned lunar soil samples are from the LSCC database and are measured under the standard geometry (i = 30°, e = 0°, g = 30°). The Is /FeO values are from Pieters et al. (2006). |
4 Discussion
4.1 Comparison of phase curves obtained in the laboratory, in situ, and via orbital measurements
Discrepancies often arise between laboratory measurement data and orbital observation data, which may be attributed to different scales of observation. In situ spectral data can help to link the gap between laboratory measurements and orbital remote sensing. We constructed four in situ photometric datasets, each with distinct spatial scales, ranging from ~2 cm to ~20 cm. All four datasets yielded phase curves characterized by a distinct bowl-like shape, which is commonly observed in sample data measured in laboratory (e.g. Schröder et al. 2014; Yang et al. 2019), but is uncommon in orbital observation data. In contrast, the phase curves obtained by orbital remote sensing observations generally exhibit a monotonically decreasing pattern with the increase of phase angle, lacking a clear turning point even when the phase angle reaches 120° (Hapke et al. 2012). This discrepancy may be caused by variations in the shadowing effect under different observation scales. During large-scale remote sensing observations, the topography and rocks on the lunar surface are detectable and can cast significant shadows, particularly when observed in the forward direction (i.e. when the phase angle is large). This suppression of the reflectance increase in the forward direction results in a monotonic decrease of the observed phase curves. Notably, the photometric curves obtained based on the panoramic camera (PCAM) data of the CE-3 and CE-4 missions show a slight increasing trend when the phase angle is larger than ~110° (e.g. Jin et al. 2015; Jiang et al. 2021). Compared to the CMOS data used in this work, the PCAM images used in previous studies cover a much larger area of the lunar surface. Therefore, the derived phase curves may be affected by terrain features, but the extent of this effect should be less than that of orbital observations.
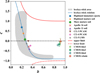 |
Fig. 12 Phase function parameter c against b. The parameter values of the four datasets are the mean values with a standard variation values across all points, after excluding abnormal points. The upper and lower limits constrain the reasonable parameter space (Hapke 2012a). The orbital research results of highland immature ejecta, highland mature soil, and mare mature soil are from Sato et al. (2014). The laboratory research results of Apollo 16 and 11 soil samples are from Johnson et al. (2013). The in situ research result of the CE-5 Lunar Mineralogical Spectrometer (LMS) is from Xu et al. (2022a), and that of the CE-3 and CE-4 PCAM inverted by the five-parameter Hapke model are from Jin et al. (2015) and Jiang et al. (2021), respectively. |
4.2 Effects of spatial scale on in situ photometric data
When examining the in situ photometric data, there is no significant difference in the overall phase curve shapes among datasets with spatial scales ranging from ~2 cm to ~20 cm. For the photometric parameters inverted from the datasets of CMOS-bin1, CMOS-bin2, and CMOS-bin4, there is a clear variation trend (Fig. 9, Appendix D, Table D.1). Specifically, the derived parameters SSA, b, and c exhibit a systematic decrease, whereas the parameter  increase with increasing spatial scale. Among these, the parameter most influenced by scale is c, which decreases from –0.05 to –0.21, suggesting enhanced forward scattering at larger spatial scales. The increasing value of
  indicates that the surface photometric roughness increases with the spatial scale. However, for the dataset CMOS-whole, which has a spatial scale of ~20 cm, the inverted parameters SSA, b, and c do not follow the decreasing trend, instead, they are very close to the inversion results of the CMOS-bin1 dataset. This discontinuity may be attributed to the large ranges of actual observation and phase angles corresponding to each data point in the CMOS-whole dataset. As shown in Fig. 2, the range of observation and phase angles involved in each CMOS image spans about 10°, and the CMOS-whole dataset is equivalent to binning at 10° intervals, which is significantly higher than the binning intervals of 1°, 2°, and 4° for the first three datasets. Interestingly, the derived value of parameter
  , compared to the other three datasets, continues to increase to ~6.56, which is consistent with the fact that larger observation scales correlate with greater photometric roughness. Overall, our inversion results could serve as a better reference for comparison with laboratory data.
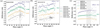 |
Fig. 13 Colour ratio phase curves for different bands combinations. (a) and (b) were derived by our four datasets, while (c) was derived from Hapke et al. (2012). The lines in (a), (b), and (c) are the best-fit results with a third-order, first-order, and second-order polynomial, respectively. All spectra are vertically offset for clarity. The phase angles of the maximum ratio values are marked by the grey region. |
4.3 Comparisons of derived phase function parameters with previous studies
The P(g) in the Hapke model characterizes the average singleparticle scattering properties of various particles in the observed surface, and thus it is often used to distinguish between different surface photometric properties. Based on extensive laboratory data, Hapke (2012a) found that there is a certain correlation between the parameters c and b in the HG phase function. In the plot of c versus b, the distribution of all data points exhibits a hockey stick-like shape, and they proposed an empirical relationship model, which is c = 3.29exp(–1.74b2) – 0.08. This empirical relationship has been widely accepted and used in the analyses of in situ and orbital photometric observation data of the lunar surface. Figure 12 summarizes a compilation of previous inversion results of the phase function parameters, encompassing the distributions of parameters c and b derived from returned lunar soil samples (Johnson et al. 2013), in situ observation data from the CE-3/CE-4/CE-5 (e.g. Jin et al. 2015; Lin et al. 2020b; Jiang et al. 2021; Xu et al. 2022a), and orbital remote sensing data from the Lunar Reconnaissance Orbiter Camera (LROC) Wide Angle Camera (WAC) (Sato et al. 2014). Our results exhibit significant deviations from previous results, with all data points falling outside the hockey stick-shaped area. This discrepancy may be due to several reasons.
It should be noted that, in addition to differences in the data or the samples, the Hapke model employed in different studies has often undergone varying degrees of simplification. For instance, Sato et al. (2014) opted to directly adopt the empirical hockey-stick relationship between c and b, thereby reducing the two phase function parameters to a single parameter. For this work we retained all five parameters, excluding those specifically designated for the opposition effect. The distributions of the parameters c and b, inverted from four datasets with different spatial scales, are all located outside the hockey stick-shaped area. This suggests that differences in photometric properties persist between undisturbed lunar regolith and laboratory-tested samples. Notably, the pristine packing structure of lunar soil, such as the fairy-castle structure, may be destroyed upon its return to Earth (Pieters et al. 1993). This structure may also play an indispensable role in determining the photometric properties of the lunar regolith. Therefore, when conducting photometric model inversion analysis on the lunar surface data, it is better to keep free the phase function parameters, rather than directly constraining them with empirical models derived from laboratory analysis.
4.4 The phase reddening behaviour
Based on the in situ spectrophotometric data obtained by the Yutu-2 rover, we observed a clear phase reddening effect, which manifests as an increase in the ratio of reflectance at longer wavelengths to shorter wavelengths as the phase angle increases. We also found a clear correlation between the shape of the colour ratio phase curves of the lunar surface and the selected bands. Specifically, for the visible bands (i.e. < 745 nm), the R600/R500 phase curves exhibit a distinct arch-shaped feature, with a maximum value near g=95° (Fig. 13a), while for the nearinfrared bands (i.e. R945/R745), the R945/R745 phase curves display a nearly monotonically increasing trend with phase angle (Fig. 13b). Schröder et al. (2014) have also reported similar arch-shaped colour ratio phase curves for terrestrial samples measured in a laboratory setting. They found that this feature mainly appeared in pressed transparent or semi-transparent samples, and the position of the maximum point was found to depend on the incidence angles. However, the colour ratio phase curves of R750/R458 and R633/R458 for unpressed typical lunar-type minerals with varying particle sizes tested in the laboratory by Yang et al. (2020b) show an arch shape similar to that found in the in situ data, except that their turning point appears at smaller phase angles (45° –80°). Their observations were primarily conducted within the principal plane, with a fixed incidence angle of 45°. Johnson et al. (2013) examined typical lunar soil samples from the highland and the mare regions, and found that their R750/R450 colour ratio phase curves also exhibited a distinct arch shape. Despite some differences in amplitude of the arch, the turning points of both samples occurred near a phase angle of 90°, aligning with our observations. This may be attributed to the wide range of incidence, emission, and azimuth angles involved in their data, which more closely resembled the observational geometry of our in situ data. This indicates that the colour ratio phase curves of the lunar soil samples measured in the laboratory are comparable to those of the lunar regolith measured in situ on the lunar surface. According to Shkuratov et al. (2011), the orbital remote sensing colour ratio phase curve of R600/R400 near the Luna-20 landing region also exhibits a similar arch-shaped feature, with the maximum value appearing near g=50°. The colour ratio curve derived from the LROC WAC data by Hapke et al. (2012) also has a similar shape (Fig. 13c). The maximum values of the colour ratio phase curves for different band combinations are observed between 55° to 80°, with larger phase angles corresponding to higher overall colour ratio values. The smaller phase angles in some datasets may be attributed to smaller emission angles in their data.
Based on the laboratory, in situ, and orbital observation results presented above, we may conclude that the shape of the colour ratio phase curve of lunar surface materials is related to the selected spectral bands. The colour ratio phase curve often exhibits a typical arch-shaped characteristic when the colour ratio is composed of a longer wavelength near the upper limit of the visible range (i.e. 633 nm or 750 nm) and a shorter visible wavelength (e.g. 450 nm).
5 Conclusions
We conducted an in situ photometric analysis for the CE-4 landing region. We examined the shape of phase curves, derived the photometric parameters using the Hapke model, and investigated the phase reddening effect and its influence on the estimation of optical maturity. Furthermore, we studied the effects of varying spatial scales (ranging from ~2 cm to ~20 cm) on these results. The results are summarized as follows:
(1) The spatial scales investigated do not exhibit a significant impact on the shape of the phase curves and the phase reddening effects, but do influence the photometric parameters, specifically manifesting in a decrease in the derived SSA, b, and c as the spatial scale increases. Conversely, the parameter  increases with increasing spatial scale. Notably, the dataset collected at the largest scale (~20 cm) deviates from this general trend, which is likely due to the large variation in observing angles for each data point within this dataset.
(2) The derived phase function parameters fall outside the general hockey-stick area. The photometric roughness parameter for all four datasets examined is less than 10°, which may serve as the lower bound for orbital remote sensing studies.
(3) The phase curves exhibit a distinct bowl-like shape, which aligns with laboratory observations, but contrasts with the results from the orbital remote sensing observations.
(4) Phase reddening effects are evident and have a notable influence on the estimation of maturity. The colour ratio phase curves exhibit a distinct arch-shaped pattern within the visible range (i.e. <745 nm), whereas they display a monotonically increasing trend in the near-infrared range (i.e. R945/R745).
Acknowledgements
The Chang’e-4 mission was implemented by the Chinese Lunar Exploration Program, with data provided by the China National Space Administration. We extend our gratitude to the Chang’e-4 engineering team for their tremendous efforts in making this mission a success. This work was supported by the National Key Research and Development Program of China (2022YFF0503100), the Key Research Program of the Chinese Academy of Sciences (Grant NO. KGFZD-145-23-15), the Compilation of Chinese Regional Geological Chronicles and Series of Maps (Grant Nos. DD20230007 and DD20221645), and the research and construction of specialized lunar and planetary science multimodal large language model (Grant NO. QKHZDZX- (2024)-016). Yang Y. also acknowledges support from the Young Elite Scientists Sponsorship Program by CAST (No. 2021QNRC001) and National Natural Science Foundation of China (Grant No. 42374218). In addition, we extend our sincere gratitude to Dr. Te Jiang for his insightful discussion, to Dr. Yining Zhang, Dr. Qingwen Zhang, and Dr. Xiao Xiao for their valuable assistance with parameters inversion, and to Xiang Zhou for his valuable discussion of parameters inversion. The data reported in this work is archived at https://moon.bao.ac.cn/ce5web/moonGisMap.search.
Appendix A Data selection for photometric analysis
We examined obviously shadow-affected data by analysing the reflectance histogram to identify a significant number of low reflectance values (Fig. A.1a) or a double-peak distribution (Fig. A.1b), and then excluded such data. Images with significant local shadow were also excluded (Fig. A.1c).
In addition to shadow, the spectra may also be affected by the reflected light from the multi-layer insulation (MLI) of the Yutu-2 rover. The MLI has a clear absorption within the range of 750-900 nm (Xu et al. 2021). The specular reflection usually happen when the sun is positioned at the left-front of the Yutu-2 rover (Fig. A.2d). Hence, the specular reflection-influenced CMOS data were also excluded in our photometric analysis. Regarding the CMOS data influenced by non-specular reflection, the spectra within the range of 750–900 nm were still excluded. The potential artefactual absorption bands from 620 to 690 nm were also masked (Yang et al. 2022). Furthermore, the bands shorter than 500 nm were also masked due to possible instrumental measurement error.
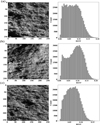 |
Fig. A.1 Examples of shadow-affected CMOS data. Left: CMOS image of lunar surface at a wavelength of 750 nm. Right: Histogram distribution of reflectance for all pixels of a CMOS data at a wavelength of 750 nm. |
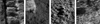 |
Fig. A.2 Examples of other excluded CMOS data. Panels (a) to (d) show the wheel-trenched site, a site with rock, a site with clods, and an artefact site with specular reflection, respectively. All subfigures were lunar surface images at a wavelength of 750nm. |
Appendix B List of all data file names used in this work
Data IDs used in this work
Appendix C Other information on parameter inversion
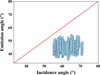 |
Fig. C.1 Distribution of incident and emission angles of pixels for all selected CMOS data |
Appendix D The derived values for the five-parameter Hapke model in this work
Inversion values of five parameters for the four datasets
References
- Adams, J. B., & McCord, T. B. 1973, in Proceedings of the Lunar Science Conference, 4, 163 [Google Scholar]
- Besse, S., Sunshine, J., Staid, M., et al. 2013, Icarus, 222, 229 [NASA ADS] [CrossRef] [Google Scholar]
- Chang, R., Lin, H., Yang, W., et al. 2023, A&A, 674, A68 [NASA ADS] [CrossRef] [EDP Sciences] [Google Scholar]
- Chapman, C. R. 1996, Meteor. Planet. Sci., 31, 699 [NASA ADS] [CrossRef] [Google Scholar]
- Chapman, C. R. 2004, Annu. Rev. Earth Planet. Sci., 32, 539 [CrossRef] [Google Scholar]
- Clark, R. N. 1999, Chapter 1 in Manual Remote Sens., 3, 2 [Google Scholar]
- Clegg-Watkins, R., Jolliff, B., Boyd, A., et al. 2016, Icarus, 273, 84 [NASA ADS] [CrossRef] [Google Scholar]
- Clegg-Watkins, R., Jolliff, B., Watkins, M., et al. 2017, Icarus, 285, 169 [Google Scholar]
- Cord, A. M., Pinet, P. C., Daydou, Y., & Chevrel, S. D. 2003, Icarus, 165, 414 [Google Scholar]
- Di, K., Liu, Z., Liu, B., et al. 2019, J. Remote Sens., 23, 177 [Google Scholar]
- Fischer, E. M., & Pieters, C. M. 1996, J. Geophys. Res.: Planets, 101, 2225 [Google Scholar]
- Gaffey, M. J. 2010, Icarus, 209, 564 [NASA ADS] [CrossRef] [Google Scholar]
- Gehrels, T., Coffeen, T., & Owings, D. 1964, AJ, 69, 826 [NASA ADS] [CrossRef] [Google Scholar]
- Gradie, J., Veverka, J., & Buratti, B. 1980, in Lunar and Planetary Science Conference Proceedings, 11, 799 [NASA ADS] [Google Scholar]
- Guo, L., Ren, X., Liu, D., et al. 2024, J. Geophys. Res.: Planets, 129, e2023JE007847 [Google Scholar]
- Hapke, B. 1981, J. Geophys. Res.: Solid Earth, 86, 3039 [NASA ADS] [CrossRef] [Google Scholar]
- Hapke, B. 1984, Icarus, 59, 41 [Google Scholar]
- Hapke, B. 1986, Icarus, 67, 264 [Google Scholar]
- Hapke, B. 1993, Theory of Reflectance and Emittance Spectroscopy (Cambridge University Press) [Google Scholar]
- Hapke, B. 2001, J. Geophys. Res.: Planets, 106, 10039 [NASA ADS] [CrossRef] [Google Scholar]
- Hapke, B. 2002, Icarus, 157, 523 [NASA ADS] [CrossRef] [Google Scholar]
- Hapke, B. 2008, Icarus, 195, 918 [Google Scholar]
- Hapke, B. 2012a, Icarus, 221, 1079 [NASA ADS] [CrossRef] [Google Scholar]
- Hapke, B. 2012b, Theory of Reflectance and Emittance Spectroscopy (Cambridge University Press) [Google Scholar]
- Hapke, B. 2021, Icarus, 354, 114105 [NASA ADS] [CrossRef] [Google Scholar]
- Hapke, B., & van Horn, H. 1963, J. Geophys. Res., 68, 4545 [Google Scholar]
- Hapke, B., & Wells, E. 1981, J. Geophys. Res.: Solid Earth, 86, 3055 [Google Scholar]
- Hapke, B., Cassidy, W., & Wells, E. 1975, Moon, 13, 339 [NASA ADS] [CrossRef] [Google Scholar]
- Hapke, B., Nelson, R., & Smythe, W. 1998, Icarus, 133, 89 [CrossRef] [Google Scholar]
- Hapke, B., Denevi, B., Sato, H., Braden, S., & Robinson, M. 2012, J. Geophys. Res.: Planets, 117 [Google Scholar]
- Hartman, B., & Domingue, D. 1998, Icarus, 131, 421 [Google Scholar]
- Hiroi, T., & Sasaki, S. 2001, Meteor. Planet. Sci., 36, 1587 [NASA ADS] [CrossRef] [Google Scholar]
- Hiroi, T., Pieters, C., & Morris, R. 1997, in Lunar and Planetary Science Conference, 575 [Google Scholar]
- Housley, R. M., Grant, R. W., & Paton, N. 1973, in Proceedings of the Lunar Science Conference, 4, 2737 [Google Scholar]
- Jiang, T., Zhang, H., Yang, Y., et al. 2019, Icarus, 331, 127 [CrossRef] [Google Scholar]
- Jiang, T., Hu, X., Zhang, H., et al. 2021, A&A, 646, A2 [NASA ADS] [CrossRef] [EDP Sciences] [Google Scholar]
- Jin, W., Zhang, H., Yuan, Y., et al. 2015, Geophys. Res. Lett., 42, 8312 [NASA ADS] [CrossRef] [Google Scholar]
- Johnson, J. R., Shepard, M. K., Grundy, W. M., Paige, D. A., & Foote, E. J. 2013, Icarus, 223, 383 [NASA ADS] [CrossRef] [Google Scholar]
- Kaydash, V., Gerasimenko, S. Y., Shkuratov, Y. G., et al. 2010, Sol. Syst. Res., 44, 267 [NASA ADS] [CrossRef] [Google Scholar]
- Korokhin, V., Shkuratov, Y., Kaydash, V., et al. 2016a, Planet. Space Sci., 122, 70 [NASA ADS] [Google Scholar]
- Korokhin, V., Shkuratov, Y., Kaydash, V., Velikodsky, Y. I., & Videen, G. 2016b, in 47th Annual Lunar and Planetary Science Conference, 1903, 1248 [Google Scholar]
- Kreslavsky, M., Shkuratov, Y. G., Velikodsky, Y. I., et al. 2000, J. Geophys. Res.: Planets, 105, 20281 [Google Scholar]
- Le Mouélic, S., Langevin, Y., Erard, S., et al. 2000, J. Geophys. Res.: Planets, 105, 9445 [Google Scholar]
- Li, C., Wang, Z., Xu, R., et al. 2019a, Sensors, 19, 2806 [NASA ADS] [CrossRef] [Google Scholar]
- Li, C., Xu, R., Lv, G., et al. 2019b, Rev. Sci. Instrum., 90, 103106 [NASA ADS] [CrossRef] [Google Scholar]
- Lin, H., Xu, R., Yang, W., et al. 2020a, J. Geophys. Res.: Planets, 125, e2019JE006076 [Google Scholar]
- Lin, H., Yang, Y., Lin, Y., et al. 2020b, A&A, 638, A35 [NASA ADS] [CrossRef] [EDP Sciences] [Google Scholar]
- Lucey, P. G., Blewett, D. T., Taylor, G. J., & Hawke, B. R. 2000, J. Geophys. Res.: Planets, 105, 20377 [NASA ADS] [CrossRef] [Google Scholar]
- McGuire, A. F., & Hapke, B. W. 1995, Icarus, 113, 134 [NASA ADS] [CrossRef] [Google Scholar]
- Morris, R. 1978, in Lunar and Planetary Science IX, Abstract TKO, 9, 760 [Google Scholar]
- Mustard, J. F., & Pieters, C. M. 1989, J. Geophys. Res.: Solid Earth, 94, 13619 [Google Scholar]
- Noble, S. K., Pieters, C. M., Taylor, L. A., et al. 2001, Meteor. Planet. Sci., 36, 31 [NASA ADS] [CrossRef] [Google Scholar]
- Ohtake, M., Pieters, C., Isaacson, P., et al. 2013, Icarus, 226, 364 [NASA ADS] [CrossRef] [Google Scholar]
- Pieters, C. M., & Noble, S. K. 2016, J. Geophys. Res.: Planets, 121, 1865 [NASA ADS] [CrossRef] [Google Scholar]
- Pieters, C. M., Fischer, E. M., Rode, O., & Basu, A. 1993, J. Geophys. Res. Planets, 98, 20817 [Google Scholar]
- Pieters, C. M., Taylor, L. A., Noble, S. K., et al. 2000, Meteor. Planet. Sci., 35, 1101 [NASA ADS] [CrossRef] [Google Scholar]
- Pieters, C., Shkuratov, Y., Kaydash, V., Stankevich, D., & Taylor, L. 2006, Icarus, 184, 83 [NASA ADS] [CrossRef] [Google Scholar]
- Pieters, C. M., Boardman, J. W., Ohtake, M., et al. 2013, Icarus, 226, 951 [NASA ADS] [CrossRef] [Google Scholar]
- Qiao, L., Ling, Z., Fu, X., & Li, B. 2019, Icarus, 333, 37 [CrossRef] [Google Scholar]
- Sanchez, J. A., Reddy, V., Nathues, A., et al. 2012, Icarus, 220, 36 [CrossRef] [Google Scholar]
- Sato, H., Robinson, M., Hapke, B., Denevi, B., & Boyd, A. 2014, J. Geophys. Res.: Planets, 119, 1775 [Google Scholar]
- Schröder, S. E., Grynko, Y., Pommerol, A., et al. 2014, Icarus, 239, 201 [Google Scholar]
- Shepard, M. K. 2017, Introduction to Planetary Photometry (Cambridge University Press) [Google Scholar]
- Shepard, M. K., & Helfenstein, P. 2007, J. Geophys. Res.: Planets, 112 [Google Scholar]
- Shkuratov, Y., Bondarenko, S., Kaydash, V., et al. 2007, J. Quant. Spectrosc. Radiat. Transf., 106, 487 [Google Scholar]
- Shkuratov, Y., Kaydash, V., Korokhin, V., et al. 2011, Planetary Space Sci., 59, 1326 [Google Scholar]
- Souchon, A., Pinet, P., Chevrel, S., et al. 2011, Icarus, 215, 313 [NASA ADS] [CrossRef] [Google Scholar]
- Taylor, L. A., Pieters, C. M., Keller, L. P., Morris, R. V., & McKay, D. S. 2001, J. Geophys. Res.: Planets, 106, 27985 [Google Scholar]
- Velichko, S., Korokhin, V., Velikodsky, Y., et al. 2024, Planet. Space Sci., 246, 105914 [Google Scholar]
- Wang, C., Sanlang, S., Tong, X., et al. 2023, Icarus, 403, 115649 [Google Scholar]
- Wu, Y., Gong, P., Liu, Q., & Chappell, A. 2009, Remote Sens. Environ., 113, 213 [NASA ADS] [CrossRef] [Google Scholar]
- Wu, Y., Besse, S., Li, J.-Y., et al. 2013, Icarus, 222, 283 [NASA ADS] [CrossRef] [Google Scholar]
- Wu, B., Li, F., Hu, H., et al. 2020, Photogram. Eng. Rem. Sens., 86, 247 [Google Scholar]
- Wu, B., Li, Y., Liu, W. C., et al. 2021, Earth Planet. Sci. Lett., 553, 116666 [Google Scholar]
- Xu, J., Wang, M., Lin, H., et al. 2021, Remote Sens., 13, 2359 [Google Scholar]
- Xu, J., Wang, M., Lin, H., et al. 2022a, Geophys. Res. Lett., 49, e2021GL096876 [Google Scholar]
- Xu, T., Hapke, B., Zhang, X., Wu, Y., & Lu, X. 2022b, A&A, 665, A15 [NASA ADS] [CrossRef] [EDP Sciences] [Google Scholar]
- Yang, Y., Li, S., Milliken, R. E., et al. 2019, J. Geophys. Res.: Planets, 124, 31 [Google Scholar]
- Yang, Y., Lin, H., Liu, Y., et al. 2020a, Geophys. Res. Lett., 47, e2020GL087080 [Google Scholar]
- Yang, Y., Ma, P., Qiao, L., et al. 2020b, A&A, 644, A30 [NASA ADS] [CrossRef] [EDP Sciences] [Google Scholar]
- Yang, Y., Li, S., Zhu, M.-H., et al. 2022, Nat. Astron., 6, 207 [Google Scholar]
All Tables
All Figures
|
Fig. 1 Geologic context of CE-4 landing region and distribution of spectral detection sites. (a) Landing site of CE-4 (red flag). The basemap is from the Lunar Reconnaissance Orbiter Camera (LROC) Wide Angle Camera. The inset in the upper left corner is a digital elevation model; (b) VNIR measurement sites (green dots) along the Yutu-2 rover’s travel path. The Yutu-2 rover has been travelling in the northwest direction from the landing site. The basemap is from the LROC Narrow Angle Camera image. |
| In the text | |
|
Fig. 2 Example CMOS image and distributions of emission and phase angles for each pixel. (a) CMOS image at a wavelength of 750 nm. The red, yellow, and blue arrows represent the relative azimuths of incident light, emergent light, and north direction, respectively. (b) Distribution of emission angles for each pixel. (c) Distribution of phase angles for each pixel. |
| In the text | |
|
Fig. 3 Relative azimuth angle of the selected CMOS data. (a) and (b) show the relative azimuth angle along with incidence and emission angles, respectively. The angle values presented were extracted from the central pixel of each CMOS image. The relative azimuth angle was defined as the azimuth angle of the rover relative to the Sun. |
| In the text | |
|
Fig. 4 Phase curves of the four datasets extracted at a wavelength of 500 nm. |
| In the text | |
|
Fig. 5 Modelled phase curve and derived values of five photometric parameters for the CMOS-bin1 dataset. (a) Phase curves at a wavelength of 500 nm. (b–f) Derived parameter values varying with wavelength for K, b, c, ω0, and |
| In the text | |
|
Fig. 6 Modelled phase curve and derived values of five photometric parameters for the CMOS-bin2 dataset. (a) Phase curves at a wavelength of 500 nm. (b–f) Derived parameter values varying with wavelength for K, b, c, ω0, and |
| In the text | |
|
Fig. 7 Modelled phase curve and derived values of five photometric parameters for the CMOS-bin4 dataset. (a) Phase curves at a wavelength of 500 nm. (b–f) Derived parameter values varying with wavelength for K, b, c, ω0, and |
| In the text | |
|
Fig. 8 Modelled phase curve and derived values of five photometric parameters for the CMOS-whole dataset. (a) Phase curves at a wavelength of 500 nm. (b–f) Derived parameter values varying with wavelength for K, b, c, ω0, and |
| In the text | |
|
Fig. 9 Parameter values at different spatial scales. Panels (a) to (e) show the values for K, b, c, ω0, and |
| In the text | |
|
Fig. 10 Colour ratio phase curves for the four datasets with different spatial scales. Panels ato d show the results for the CMOS-bin1, CMOS- bin2, CMOS-bin4, and CMOS-whole datasets, respectively. Each point in these subfigures is the mean value within a 1° phase angle bin. The lines in these subfigures are the best-fit results with either a first-order polynomial or a third-order polynomial. |
| In the text | |
|
Fig. 11 Distribution patterns of the R945/R745 values against reflectance at 745 nm. Panels ato d show the results for the CMOS-bin1, CMOS-bin2, CMOS-bin4, and CMOS-whole datasets, respectively. The squares represent the CMOS data and the circles represent the LSCC samples. Each square in these subfigures is the mean value within a 1° phase angle bin. The spectra of the Apollo returned lunar soil samples are from the LSCC database and are measured under the standard geometry (i = 30°, e = 0°, g = 30°). The Is /FeO values are from Pieters et al. (2006). |
| In the text | |
|
Fig. 12 Phase function parameter c against b. The parameter values of the four datasets are the mean values with a standard variation values across all points, after excluding abnormal points. The upper and lower limits constrain the reasonable parameter space (Hapke 2012a). The orbital research results of highland immature ejecta, highland mature soil, and mare mature soil are from Sato et al. (2014). The laboratory research results of Apollo 16 and 11 soil samples are from Johnson et al. (2013). The in situ research result of the CE-5 Lunar Mineralogical Spectrometer (LMS) is from Xu et al. (2022a), and that of the CE-3 and CE-4 PCAM inverted by the five-parameter Hapke model are from Jin et al. (2015) and Jiang et al. (2021), respectively. |
| In the text | |
|
Fig. 13 Colour ratio phase curves for different bands combinations. (a) and (b) were derived by our four datasets, while (c) was derived from Hapke et al. (2012). The lines in (a), (b), and (c) are the best-fit results with a third-order, first-order, and second-order polynomial, respectively. All spectra are vertically offset for clarity. The phase angles of the maximum ratio values are marked by the grey region. |
| In the text | |
|
Fig. A.1 Examples of shadow-affected CMOS data. Left: CMOS image of lunar surface at a wavelength of 750 nm. Right: Histogram distribution of reflectance for all pixels of a CMOS data at a wavelength of 750 nm. |
| In the text | |
|
Fig. A.2 Examples of other excluded CMOS data. Panels (a) to (d) show the wheel-trenched site, a site with rock, a site with clods, and an artefact site with specular reflection, respectively. All subfigures were lunar surface images at a wavelength of 750nm. |
| In the text | |
|
Fig. C.1 Distribution of incident and emission angles of pixels for all selected CMOS data |
| In the text | |
Current usage metrics show cumulative count of Article Views (full-text article views including HTML views, PDF and ePub downloads, according to the available data) and Abstracts Views on Vision4Press platform.
Data correspond to usage on the plateform after 2015. The current usage metrics is available 48-96 hours after online publication and is updated daily on week days.
Initial download of the metrics may take a while.