Fig. 10
Download original image
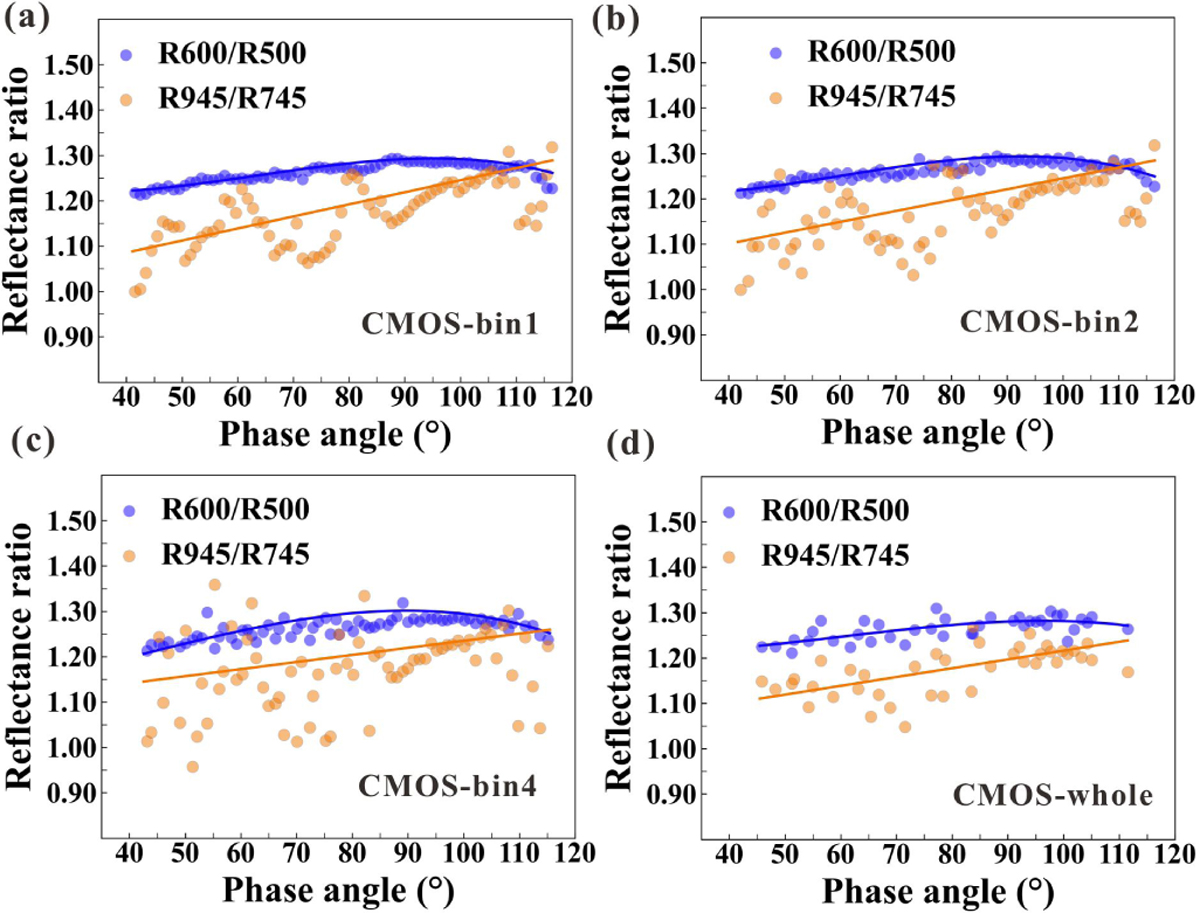
Colour ratio phase curves for the four datasets with different spatial scales. Panels ato d show the results for the CMOS-bin1, CMOS- bin2, CMOS-bin4, and CMOS-whole datasets, respectively. Each point in these subfigures is the mean value within a 1° phase angle bin. The lines in these subfigures are the best-fit results with either a first-order polynomial or a third-order polynomial.
Current usage metrics show cumulative count of Article Views (full-text article views including HTML views, PDF and ePub downloads, according to the available data) and Abstracts Views on Vision4Press platform.
Data correspond to usage on the plateform after 2015. The current usage metrics is available 48-96 hours after online publication and is updated daily on week days.
Initial download of the metrics may take a while.