| Issue |
A&A
Volume 674, June 2023
|
|
|---|---|---|
| Article Number | A68 | |
| Number of page(s) | 7 | |
| Section | Planets and planetary systems | |
| DOI | https://doi.org/10.1051/0004-6361/202245751 | |
| Published online | 01 June 2023 | |
Comparison of laboratory and in situ reflectance spectra of Chang’e-5 lunar soil
1
Key Laboratory of Earth and Planetary Physics, Institute of Geology and Geophysics, Chinese Academy of Sciences,
No. 19 Beitucheng Western Road,
Beijing
100029, PR China
e-mail: This email address is being protected from spambots. You need JavaScript enabled to view it.
2
University of Chinese Academy of Sciences,
No. 1 Yanqihu East Road,
Beijing
101408, PR China
3
Key Laboratory of Space Active Opto-Electronics Technology, Shanghai Institute of Technical Physics, Chinese Academy of Sciences,
No. 500 Yutian Road,
Shanghai
200083,
PR China
Received:
21
December
2022
Accepted:
24
March
2023
Abstract
Context. Reflectance spectra provide essential information on the mineralogical composition of a planetary surface. However, the spectral characteristics of lunar soil are significantly influenced by its photometric properties, coupled with space weathering and particle size.
Aims. China’s Chang’e-5 (CE5) mission returned lunar soil samples and obtained in situ spectra of the sampling site, enabling us to compare the laboratory and in situ analyses of the same sample.
Methods. In this study, we measured the reflectance spectra of the bulk CE5 soil and two size fractions (<45 and 45–355 μm) at various phase angles (41.3° to 101.3°).
Results. The photometric properties of the CE5 samples exhibit back scattering, whereas an in situ measurement appears as forward scattering, indicating that in situ photometric experiments are always necessary for spectral exploration on the Moon. In addition, the scattering properties of the <45-μm fraction are closer to the in situ spectral data, suggesting that the finer fraction could be more representative of pristine lunar soil. The maturity of CE5 soil is estimated to be submature to mature based on the spectral ratio between 750 nm and 950 nm.
Key words: planets and satellites: surfaces / infrared: planetary systems / radiative transfer / scattering
© The Authors 2023
 Open Access article, published by EDP Sciences, under the terms of the Creative Commons Attribution License (https://creativecommons.org/licenses/by/4.0), which permits unrestricted use, distribution, and reproduction in any medium, provided the original work is properly cited.
This article is published in open access under the Subscribe to Open model. This email address is being protected from spambots. You need JavaScript enabled to view it. to support open access publication.
1 Introduction
Visible and near-infrared (VNIR) reflectance spectra are a powerful tool for determining the mineralogical composition of planetary surfaces (e.g., Clark et al. 1990; Pieters & Englert 1993; Bishop 2019). The orbital and in situ remote measurements provide global and regional compositional characteristics and soil properties of the Earth’s Moon. The quantitative accuracy of VNIR is limited due to the effects of complex factors on the Moon, such as space weathering, viewing geometry, particle size, among others. Spectra of lunar soil samples collected by the Apollo and Luna missions have been measured in the laboratory, supporting the interpretation of remote sensing data (Taylor et al. 2001b; Pieters et al. 2002). However, the different measurement conditions hinder the connection between the laboratory spectra and remote sensing data. The Chang’e-5 (CE5) spacecraft landed on the Northern Oceanus Procellarum of the Moon on 1 December 2020, and successfully returned 1.731 kg of lunar soil 16 days later (Yang & Lin 2021). Besides bringing back samples, CE5 also performed in situ spectral measurements at the landing site using the Lunar Mineralogical Spectrometer (LMS; Lin et al. 2022), enabling the analysis of the same samples under laboratory as well as in situ conditions.
On the Moon, space weathering has a significant effect on the spectra of the soil. It increases soil maturity (Taylor et al. 2001a), making the soil spectra redder, darker, and flatter (Taylor et al. 2001b). Thus, the degree of space weathering (soil maturity) can be estimated from the reflectance spectra of the lunar surface. However, the photometric properties significantly influence spectral patterns and reflectance values. Laboratory studies of lunar analogs (Johnson et al. 2013; Schröder et al. 2014), orbital measurements (Hapke et al. 2012; Sato et al. 2014), and in situ measurements of the Chang’e-4 (CE4) rover (Lin et al. 2020c; Yang et al. 2020) show the phenomenon of phase reddening, which means an increase in spectral slope toward longer wavelengths with increasing phase angle. Therefore, photometric effects on soil spectra and their impact on estimating soil maturity and composition need to be evaluated. The low spatial resolution of orbital observations cannot meet the requirement that the analyzed area be homogeneous. In situ measurements of the CE4 rover only covered a narrow range of phase angles due to the rover’s limited attitude (Lin et al. 2020b,c; Yang et al. 2020). In addition, no samples were returned from the CE4 landing site.
Another factor affecting the spectral properties of lunar soil is particle size (Pieters et al. 1993). Lunar soils with different particle sizes exhibit different optical properties due to their different optical paths and scattering properties (Clark & Roush 1984). Asteroid impacts and space weathering have substantially altered the lunar surface, making it more fine-grained (Joy et al. 2016; Lin et al. 2020a; Shkuratov & Bondarenko 2001). As the particle size of the soil decreases, its reflectance intensity increases (Li & Li 2011; Taylor et al. 2010). Therefore, given that space weathering reduces the brightness of the lunar soil by producing submicroscopic metallic iron (Hapke 2001; Wang et al. 2017), the spectral properties of lunar soil are influenced by both space weathering and particle size.
This study measured the reflectance spectra of the bulk CE5 lunar soil and two fractions (<45 and 45–355 μm) at a series of viewing geometries in the laboratory and analyzed the photometric properties of the sample. The in situ photometric parameters were also calculated for comparison. These results are important for interpreting the CE5 LMS and future in situ spectral data.
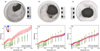 |
Fig. 1 Images and reflectance spectra of the CE5 samples. The images of the CE5 samples: (a) <45-μm fraction, (b) 45–355-μm fraction, and (c) bulk soil sample. The spectra: (d) <45-μm fraction, (e) 45–355-μm fraction, and (f) bulk soil sample. The gray plots represent the CE5 in situ multispectral reflectance obtained by LMS. The green plots represent CE5 in situ multispectra at the sampled locations. |
2 Materials and methods
2.1 CE5 lunar soil samples
The CE5 samples used in this study are numbered CE5C0600YJFM00402 with a total weight of 1500 mg and CE5C1000YJFM00404 with a total weight of 1200 mg. Both are scooped samples from the same site. The sample CE5C0600YJFM00402 was sieved into three fractions: < 45, 45–355, and >355 μm. The <45-μm and 45–355-μm fractions were selected for laboratory spectral experiments. The 45 μm fraction was selected to separate these two fractions because the topmost layer of the lunar soil is believed to be finer than 45 μm and substituted the spectral features of the bulk lunar soil (Pieters et al. 1993; Taylor et al. 2001b). The sample CE5C1000YJFM00404 was selected as the bulk CE5 lunar soil without sieving. The images of the <45-μm and 45–355-μm fractions as well as the bulk soil sample are shown in Figs. 1a–c.
The previous study indicated that 95% (in mass) of CE5 lunar soil has particle sizes between 4.84 and 432.27 μm with a mean value of 49.80 μm (Li et al. 2022). The source materials of CE5 lunar soil are dominated by the local basalt, which is characterized by high FeO (>22 wt%) and low Mg# (<34;=100 × Mg/[Mg + Fe]) relative to the Apollo and Luna returned samples (Tian et al. 2021; Zong et al. 2022). The bulk soil comprises 26.4–30.4% plagioclase, 31.6–44.5% pyroxene, 3.6–8.9% olivine, 4.5–6.0% ilmenite, and 15.5–24.4% glass/agglutinate (Cao et al. 2022; Li et al. 2022; Zhang et al. 2022).
2.2 Acquisition of reflectance spectra of lunar soil returned samples
The CE5 lunar soil samples were placed in glass dishes. In order to obtain flat and natural surfaces, the dishes were tapped carefully to disperse the soil samples at the bottom. This operation also ensured that the thickness of the sample was larger than 1–2 mm without any light transmission.
The laboratory experiment was performed using a FieldSpec-4 ASD under darkness in the Lunar Sample Clean Laboratory at the Institute of Geology and Geophysics, Chinese Academy of Sciences (Fig. 2). Halogen lamps were used as the light source. A tripod was used to maintain the incidence angle of light at 46.3°. A macro-angle-resolved scaffold was used to precisely control the emission angle of the detection, ensuring that the same portion of the sample was measured during spectral measurements. However, the range of the emission angle is limited from −5° to 55° with a step of 5° due to the small amount of CE5 lunar soil samples studied here. The shadow of the optical fiber probe affects the measurement when the emission angle is lower than −5° and the optical fiber probe hits the glass dish when the emission angle is larger than 55° (Fig. 2). According to this limitation of the emission angle range, the phase angle was limited to the range of 41.3° to 101.3°. The measurements were repeated six times for each spectrum to alleviate the effects of measuring error. The spectra range was from 450 to 2500 nm with spectral resolutions of 3 nm at 700 nm and 6 nm at 1400 and 2100 nm. The field of view (FOV) of the spectrometer was set as ~1 × 1 mm. Figures 1d–f show the reflectance spectra of the CE5 samples.
The in situ multispectral data of CE5 were obtained by the full-view scanning and multispectral observation (multispectral mode) of LMS. Twenty bands were selected in multispectral mode, which can cover the full sampling region with a total of 180 scanned FOVs (Fig. 3; Xu et al. 2022). LMS acquired the reflectance data of most of the sampling area, which was approximately 2 × 2 m. The spectral resolution of LMS is 0.4–1 mm pixel−1, and the FOV of each measurement is ~15 × 20 cm with 256 × 256 pixels. The gray dots plotted in Figs. 1d–f show the reflectance data of all 180 multispectral measurements, of which phase angles range from 22.41° to 93.57°. The in situ reflectance data detected at the same site with the sampling site are shown as green dots in Figs. 1d–f, indicating a similar spectral shape to the laboratory results. Therefore, it is worth comparing in situ and laboratory spectral data.
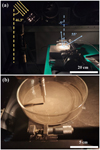 |
Fig. 2 Photo of laboratory experiment conditions (a) and the analyzed surface of the sample (b). The yellow lines represent the path of light and the blue lines represent the path of the emission signal. |
2.3 Data and processing methods
The multispectral reflectance of CE5 in situ was obtained from the ratio of the CE5 LMS 2B radiance data to the solar spectral irradiance data (Gueymard 2004; Wu et al. 2018; Xu et al. 2022). Considering the effects of rock areas, shadow occlusions, and bright spots, a total of 23 abnormal spectral measurements of the multispectral reflectance data were excluded (Xu et al. 2022). Photometric properties of CE5 soil were derived from the Hapke radiative transfer model (Hapke 1981). The parameters b and c of the phase function were derived from the two-term Legendre polynomial and Henyey–Greenstein (HG) phase function, respectively (Hapke 2012). The detailed method of deriving parameters b and c for the two-term Legendre polynomial phase function has been described by Yang et al. (2020). The parameters derived method for the HG phase function has been described by Lin et al. (2020c).
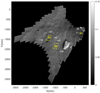 |
Fig. 3 Full-view scanning and multispectral observation map obtained by LMS at 750 nm (Liu et al. 2022). The black boxes indicate the multispectral detection areas related to the sampling sites. The yellow numbers (S1, S2, and S5) indicate the sampling sites. |
3 Results and discussions
3.1 Phase curves
The reflectance spectra of the CE5 lunar soil exhibit an apparent absorption feature at around 1000 nm (Figs. 1d–f). The spectral reflectance of the <45-μm fraction is higher than that of the bulk soil sample, the 45–355-μm fraction in general, and the CE5 in situ multispectral reflectance. As shown in Figs. 1d–f, the absolute spectral reflectance for the bulk soil sample is similar to the mean reflectance of the in situ multispectral measurements. The standard deviation of the reflectance values obtained from the LMS multispectral data ranged from 0.007 to 0.12. It should be noted that the in situ observation area (~15 × 20 cm) is significantly larger than the laboratory measurements, and the surface roughness could affect the in situ reflectance.
The phase curves extracted from the reflectance measurements are shown in Fig. 4, and they were fitted with the two-term Legendre polynomial Hapke model at the representative wavelength of 485, 750, 950, 1250, 1550, and 2000 nm. Overall, the shapes of spectra measured at different phase angles are consistent. The curvatures of the phase curves are related to their wavelengths. There is a decrease in the absolute reflectance of the spectra for the phase angle increasing from 41.3° to 66.3° (±5°), while an increase in the absolute reflectance of the spectra for the phase angle increasing from 66.3° (±5°) to 101.3°.
In addition, the gap between the phase curves of <45-μm and 45–355-μm fractions increases with the wavelength increasing according to Figs. 4a–f. Moreover, the influence of the phase angle on the change of phase curve curvature is more obvious for the fine sample. The phase curves of the bulk soil sample are lower than the sieved fractions while reaching the same level to the 45–355-μm fraction at a >2000 nm band.
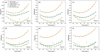 |
Fig. 4 Phase curves of the <45-μm and 45–355-μm fractions, as well as the bulk soil sample. (a)–(f) are the phase curves at bands of 485, 750, 950, 1250, 1550, and 2000 nm, respectively. |
3.2 Photometric properties of CE5 lunar soil
There are two phase functions, the two-term Legendre polynomial function and the HG function, widely used in lunar spectral analysis (Yang et al. 2019). The empirical parameters b = −0.40 and c = 0.25 of the two-term Legendre polynomial phase function, suggested by Lucey (1998) and derived from Mustard & Pieters (1989), are widely used for the unmixing analysis of lunar spectral data. However, the parameters b and c estimated by CE4 in situ photometric spectra are −0.17 and 0.70 (Yang et al. 2020). The photometric properties of the lunar surface materials at the CE4 landing site are substantially different from that represented by the empirical parameters (Fig. 5a), suggesting that the empirical values cannot be used for in situ spectral analysis.
In addition to returning samples, CE5 conducted in situ measurements on the Moon, enabling us to compare the laboratory analysis of samples and remote sensing explorations. We derived the photometric parameters from laboratory and in situ spectral data of CE5 using the two-term Legendre polynomial function and the HG function. For the Legendre polynomial function, the average values of parameters b and c of CE5 in situ data are −0.31 and 0.40. The CE5 landing site has similar b values to the CE4 landing site, while lower c values than the CE4 landing site, suggesting that the lunar surface material of CE5 has a similar forward scattering level to that of CE4. However, the average parameter values of the CE5 <45-μm fraction are b = −0.01 and c = 0.13, and the average values of the CE5 45–355-μm fraction are b = 0.12 and c = 0.13. The c values of <45-μm and 45–355-μm fractions are nearly the same and similar to the pure minerals from Yang et al. (2019). The standard deviations of b and c for the Legendre polynomial function are 0.040±0.007 and 0.035±0.008, respectively. The CE5 <45-μm fraction is mainly isotropic relative to the more backscattering 45–355-μm fraction, whereas the bulk soil is intermediate. The difference in photometric parameters of the 45–355-μm fraction and bulk soil sample may indicate that the c value reflects the degree of inhomogeneity of particle size, which was described as the degree of side scatter by Mustard & Pieters (1989).
Furthermore, the photometric properties represented by the HG function (Fig. 5b) are consistent with that derived by the Legendre polynomial function. The in situ data express forward scattering properties, and the <45-μm and 45–355-μm fractions express isotropic and back scattering properties, respectively. The standard deviations of b and c for the HG function are 0.018 ± 0.007 and 0.079 ± 0.029, respectively. The properties of parameters, shown as high b and low c, indicate that the CE4 lunar soil is narrowly forward scattering and much different from CE5 lunar soil. Considering the results from McGuire & Hapke (1995), the photometric properties of the CE5 samples indicate that they have the medium density of internal scatters. Nevertheless, the densities of internal scatters of the < 45-μm fraction and in situ samples should be lower than the 45–355-μm fraction and bulk soil samples. Both CE5 lunar soil photometric results indicate different scattering properties between in situ remote sensing data and laboratory experiment data. Therefore, the phase function parameters derived from laboratory experiment spectral data may not be used to calibrate in situ remote sensing spectral data. Photometric experiments are always required for spectral exploration at each site on the Moon.
In addition, our results show that the photometric properties of the lunar materials are highly dependent on their particle sizes. The scattering properties of the fine particle (<45 μm) are more representative of the pristine lunar soil. Fine particles smaller than 45 μm must be separated to perform another photometric experiment to check their scattering properties. Additionally, the parameters derived from laboratory experiment data are similar to those derived from ilmenite reported by Yang et al. (2019) on values and shapes. The ilmenite and other mineral samples reported by Yang et al. (2019) were ground and wet sieved to a size distribution of 45–75 μm. In this condition, the phase function behavior of ilmenite was very different from silicate minerals because ilmenite is a highly absorbing opaque mineral. Therefore, we suggest that the photometric properties of laboratory experiments could be affected by ilmenite significantly.
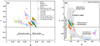 |
Fig. 5 Relationship between phase function parameters b and c. (a) shows the parameters derived from the two-term Legendre polynomial function, and (b) shows the parameters derived from the HG function. The b and c values of olivine, orthopyroxene, plagioclase, and ilmenite were obtained by Yang et al. (2019). The empirical b and c values were obtained from Lucey (1998). The CE4 in situ b and c values were obtained from Yang et al. (2020). The L-shaped region and the nature of its different parts were obtained from McGuire & Hapke (1995). “CE4 SWIR” means the short-wavelength infrared detector of the CE4 mission, and “CE4 CMOS” means the complementary metal-oxide semiconductor imager of CE4. |
3.3 Spectral slope and maturity of CE5 lunar soil
The spectral slope is a critical indicator of the degree of space weathering on the lunar surface (Pieters & Noble 2016). Figure 6 shows the spectral slopes expressed as the spectral ratio at 950–750nm (R950/R750) and the spectral ratio at 1600–700 nm (R1600/R700). The spectral ratio R950/R750 was not significantly affected by the phase angle and particle size for the <45-μm and 45–355-μm fractions, while the spectral ratio R1600/R700 was slightly affected by particle size. The R1600/R700 ratio of the bulk soil sample is similar to R1600/R700 of the <45-μm fraction, indicating that the fine sample could represent the characteristics of the bulk soil sample in the overall shape. The spectra of CE5 lunar soil detected in the laboratory are included in the spectral ratios of lunar analog soils JSC-1 from Johnson et al. (2013, Fig. 6c). For the phase behavior trend of spectral ratio R750/R450, the <45-μm fraction and bulk soil sample are similar to JSC-1, while the 45–355-μm fraction is opposite to JSC-1 at the phase angle of ~60° to 90°. These results indicate that the photometric properties can affect the spectral ratio.
The spectral ratios can be used to estimate the maturity of the lunar soil based on the Lunar Soil Characterization Consortium (LSCC) data (Taylor et al. 2001b). The spectral ratio increases with Is/FeO, and the reflectance decrease, as shown in Figs. 6d,e. According to maturity classification (Morris 1978), lunar soils with Is/FeO > 60 are mature. The submature lunar soil should have Is/FeO values of 30–60. Because the phase angle and particle size have less influence on the maturity reflected by the spectral ratio R950/R750 than R1600/R700 (Fig. 6), the relationship between R950/R750 and reflectance can be used to determine the maturity of the lunar soil. Although the phase angles significantly affect the spectral ratio R950/R750, the spectra can still reflect the maturity of CE5 lunar soil (Figs. 6d,e). Compared with the Apollo lunar soil samples, CE5 lunar soil falls within the overlapping field between submature and mature, consistent with the in situ measurements (Fig. 6d).
4 Conclusions
We measured the reflectance spectra of the bulk CE5 soil and two size fractions (< 45 and 45–355 μm) at various phase angles (41.3° to 101.3°) in the laboratory. The reflectance spectra exhibit an apparent absorption feature at around 1000 nm, and the shapes of the phase curves of spectra measured at different phase angles are consistent. There is a decrease in the absolute reflectance of the spectra for the phase angle increasing from 41.3° to 66.3° (±5°), while an increase in the absolute reflectance of the spectra occurs for the phase angle increasing from 66.3° (±5°) to 101.3°.
A comparison of laboratory and in situ reflectance spectra of CE5 lunar soil shows that the photometric properties measured in the laboratory are distinct from those measured in situ by the CE5 lander. Therefore, the spectral photometric properties derived from laboratory experiment data may not be used to calibrate remote sensing data, indicating that photometric experiments are always required for spectral exploration at each site on the Moon.
In addition, photometric properties show apparent differences between fine and coarse fractions. The <45-μm fraction is more isotropic than the 45–355-μm fraction and bulk soil sample, which are more back scattering. Our results show that the photometric properties of the lunar materials are highly dependent on their particle sizes. The scattering properties of the fine particle (< 45 μm) are more representative of the pristine lunar soil. The finer particles smaller than 45 μm should be separated to perform another photometric experiment to check their scattering properties.
Considering the effect of photometric properties on spectral ratio, the spectral ratio R950/R750 can still reflect the maturity of CE5 lunar soil. The maturity of CE5 lunar soil is estimated to be submature to mature.
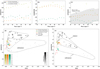 |
Fig. 6 Variation trends of the spectral ratio toward phase angle and spectral reflectance for the spectra of CE5 lunar soil. (a)–(c) are spectral ratios of R950/R750, R1600/R700, and R750/R450 versus phase angles, respectively. (d) and (e) are R950/R750 versus R750 and R1600/R700 versus R700, respectively. The spectral ratios of JSC-1 were derived from Johnson et al. (2013). The spectra of CE5 in situ data were derived from Lin et al. (2022). The division of the maturity range is based on the relationship between the spectral ratio and Is/FeO of the Apollo returned samples. The spectra of the Apollo lunar soil samples are from the Lunar Soil Characterization Consortium (LSCC) database. The LSCC spectra are all measured under standard geometry (i = 30°, e = 0°, g = 30°). |
Acknowledgements
The China National Space Administration provided the Chang’e-5 lunar samples and scientific data. This study was funded by the National Natural Science Foundation of China (42241103), the Strategic Priority Research Program of the Chinese Academy of Sciences (XDB 41000000), the Key Research Program of the Chinese Academy of Sciences (ZDBS-SSW-JSC00715), the key research program of the Institute of Geology and Geophysics, Chinese Academy of Sciences (IGGCAS-202101), Young Elite Scientists Sponsorship Program by CAST (2021QNRC001) and the Open Funding of Key Laboratory of Space Active Optical-electro Technology, CAS (2021-ZDKF-3).
References
- Bishop, J. L. 2019, Visible and Near-Infrared Reflectance Spectroscopy: Laboratory Spectra of Geologic Materials, eds. J. L. Bishop, J. F. Bell III, & J. E. Moersch, Cambridge Planetary Science (Cambridge University Press), 68 [Google Scholar]
- Cao, H., Wang, C., Chen, J., et al. 2022, Geophys. Res. Lett., 49, e99282 [NASA ADS] [Google Scholar]
- Clark, R., & Roush, T. 1984, J. Geophys. Res., 89, 6329 [NASA ADS] [CrossRef] [Google Scholar]
- Clark, R. N., King, T. V. V., Klejwa, M., Swayze, G. A., & Vergo, N. 1990, J. Geophys. Res. Solid Earth, 95, 12653 [CrossRef] [Google Scholar]
- Gueymard, C. A. 2004, Solar Energy, 76, 423 [NASA ADS] [CrossRef] [Google Scholar]
- Hapke, B. 1981, J. Geophys. Res. Solid Earth, 86, 3039 [NASA ADS] [CrossRef] [Google Scholar]
- Hapke, B. 2001, J. Geophys. Res. Planets, 106, 10039 [CrossRef] [Google Scholar]
- Hapke, B. 2012, Theory of Reflectance and Emittance Spectroscopy, 2nd edn. (Cambridge University Press) [Google Scholar]
- Hapke, B., Denevi, B., Sato, H., Braden, S., & Robinson, M. 2012, J. Geophys. Res. Planets, 117, E00H15 [Google Scholar]
- Johnson, J. R., Shepard, M. K., Grundy, W. M., Paige, D. A., & Foote, E. J. 2013, Icarus, 223, 383 [NASA ADS] [CrossRef] [Google Scholar]
- Joy, K. H., Crawford, I. A., Curran, N. M., et al. 2016, Earth Moon Planets, 118, 133 [NASA ADS] [CrossRef] [Google Scholar]
- Li, S., & Li, L. 2011, J. Geophys. Res. Planets, 116 [Google Scholar]
- Li, C., Hu, H., Yang, M.-F., et al. 2022, Natl. Sci. Rev., 9, nwab188 [CrossRef] [Google Scholar]
- Lin, H., Lin, Y., Yang, W., et al. 2020a, Geophys. Res. Lett., 47, e2020GL087949 [Google Scholar]
- Lin, H., Xu, R., Yang, W., et al. 2020b, J. Geophys. Res. Planets, 125, e2019JE006076 [CrossRef] [Google Scholar]
- Lin, H., Yang, Y., Lin, Y., et al. 2020c, A & A, 638, A35 [NASA ADS] [CrossRef] [EDP Sciences] [Google Scholar]
- Lin, H., Li, S., Xu, R., et al. 2022, Sci. Adv., 8, eabl9174 [NASA ADS] [CrossRef] [Google Scholar]
- Liu, J., Liu, B., Ren, X., et al. 2022, Nat. Commun., 13, 3119 [NASA ADS] [CrossRef] [Google Scholar]
- Lucey, P. 1998, J. Geophys. Res. Planets, 103, 1703 [NASA ADS] [CrossRef] [Google Scholar]
- McGuire, A. F., & Hapke, B. W. 1995, Icarus, 113, 134 [NASA ADS] [CrossRef] [Google Scholar]
- Morris, R. V. 1978, in Lunar and Planetary Science Conference, Lunar and Planetary Science Conference, 760 [Google Scholar]
- Mustard, J. F., & Pieters, C. M. 1989, J. Geophys. Res. Solid Earth, 94, 13619 [NASA ADS] [CrossRef] [Google Scholar]
- Pieters, C. M., & Englert, P. A. J. 1993, Remote Geochemical Analysis, Elemental and Mineralogical Composition (Cambridge University Press) [Google Scholar]
- Pieters, C. M., & Noble, S. K. 2016, J. Geophys. Res. Planets, 121, 1865 [CrossRef] [Google Scholar]
- Pieters, C., Head, J., Sunshine, J., et al. 1993, J. Geophys. Res. Planets, 98, 17127 [Google Scholar]
- Pieters, C. M., Stankevich, D., Shkuratov, Y., & Taylor, L. 2002, Icarus, 155, 285 [NASA ADS] [CrossRef] [Google Scholar]
- Sato, H., Robinson, M. S., Hapke, B., Denevi, B. W., & Boyd, A. K. 2014, J. Geophys. Res. Planets, 119, 1775 [NASA ADS] [CrossRef] [Google Scholar]
- Schröder, S., Grynko, Y., Pommerol, A., et al. 2014, Icarus, 239, 201 [CrossRef] [Google Scholar]
- Shkuratov, Y., & Bondarenko, N. 2001, Icarus, 149, 329 [NASA ADS] [CrossRef] [Google Scholar]
- Taylor, L. A., Pieters, C., Keller, L. P., et al. 2001a, Meteor. Planet. Sci., 36, 285 [NASA ADS] [CrossRef] [Google Scholar]
- Taylor, L. A., Pieters, C. M., Keller, L. P., Morris, R. V., & McKay, D. S. 2001b, J. Geophys. Res. Planets, 106, 27985 [NASA ADS] [CrossRef] [Google Scholar]
- Taylor, L. A., Pieters, C., Patchen, A., et al. 2010, J. Geophys. Res. Planets, 115, E02002 [Google Scholar]
- Tian, H.-C., Wang, H., Chen, Y., et al. 2021, Nature, 600, 59 [Google Scholar]
- Wang, Z., Wu, Y., Blewett, D. T., et al. 2017, Geophys. Res. Lett., 44, 3485 [NASA ADS] [CrossRef] [Google Scholar]
- Wu, Y., Wang, Z., Cai, W., & Lu, Y. 2018, AJ, 155, 213 [NASA ADS] [CrossRef] [Google Scholar]
- Xu, J., Wang, M., Lin, H., et al. 2022, Geophys. Res. Lett., 49, e2022GL099022 [Google Scholar]
- Yang, W., & Lin, Y. 2021, The Innovation, 2, 100070 [NASA ADS] [CrossRef] [Google Scholar]
- Yang, Y., Li, S., Milliken, R. E., et al. 2019, J. Geophys. Res. Planets, 124, 31 [Google Scholar]
- Yang, Y., Lin, H., Liu, Y., et al. 2020, Geophys. Res. Lett., 47, e2020GL087080 [Google Scholar]
- Zhang, H., Zhang, X., Zhang, G., et al. 2022, Sci. China-Phys. Mech. Astron., 65, 264613 [CrossRef] [Google Scholar]
- Zong, K., Wang, Z., Li, J., et al. 2022, Geochim. Cosmochim. Acta, 335, 284 [NASA ADS] [CrossRef] [Google Scholar]
All Figures
|
Fig. 1 Images and reflectance spectra of the CE5 samples. The images of the CE5 samples: (a) <45-μm fraction, (b) 45–355-μm fraction, and (c) bulk soil sample. The spectra: (d) <45-μm fraction, (e) 45–355-μm fraction, and (f) bulk soil sample. The gray plots represent the CE5 in situ multispectral reflectance obtained by LMS. The green plots represent CE5 in situ multispectra at the sampled locations. |
| In the text | |
|
Fig. 2 Photo of laboratory experiment conditions (a) and the analyzed surface of the sample (b). The yellow lines represent the path of light and the blue lines represent the path of the emission signal. |
| In the text | |
|
Fig. 3 Full-view scanning and multispectral observation map obtained by LMS at 750 nm (Liu et al. 2022). The black boxes indicate the multispectral detection areas related to the sampling sites. The yellow numbers (S1, S2, and S5) indicate the sampling sites. |
| In the text | |
|
Fig. 4 Phase curves of the <45-μm and 45–355-μm fractions, as well as the bulk soil sample. (a)–(f) are the phase curves at bands of 485, 750, 950, 1250, 1550, and 2000 nm, respectively. |
| In the text | |
|
Fig. 5 Relationship between phase function parameters b and c. (a) shows the parameters derived from the two-term Legendre polynomial function, and (b) shows the parameters derived from the HG function. The b and c values of olivine, orthopyroxene, plagioclase, and ilmenite were obtained by Yang et al. (2019). The empirical b and c values were obtained from Lucey (1998). The CE4 in situ b and c values were obtained from Yang et al. (2020). The L-shaped region and the nature of its different parts were obtained from McGuire & Hapke (1995). “CE4 SWIR” means the short-wavelength infrared detector of the CE4 mission, and “CE4 CMOS” means the complementary metal-oxide semiconductor imager of CE4. |
| In the text | |
|
Fig. 6 Variation trends of the spectral ratio toward phase angle and spectral reflectance for the spectra of CE5 lunar soil. (a)–(c) are spectral ratios of R950/R750, R1600/R700, and R750/R450 versus phase angles, respectively. (d) and (e) are R950/R750 versus R750 and R1600/R700 versus R700, respectively. The spectral ratios of JSC-1 were derived from Johnson et al. (2013). The spectra of CE5 in situ data were derived from Lin et al. (2022). The division of the maturity range is based on the relationship between the spectral ratio and Is/FeO of the Apollo returned samples. The spectra of the Apollo lunar soil samples are from the Lunar Soil Characterization Consortium (LSCC) database. The LSCC spectra are all measured under standard geometry (i = 30°, e = 0°, g = 30°). |
| In the text | |
Current usage metrics show cumulative count of Article Views (full-text article views including HTML views, PDF and ePub downloads, according to the available data) and Abstracts Views on Vision4Press platform.
Data correspond to usage on the plateform after 2015. The current usage metrics is available 48-96 hours after online publication and is updated daily on week days.
Initial download of the metrics may take a while.