Fig. 1
Download original image
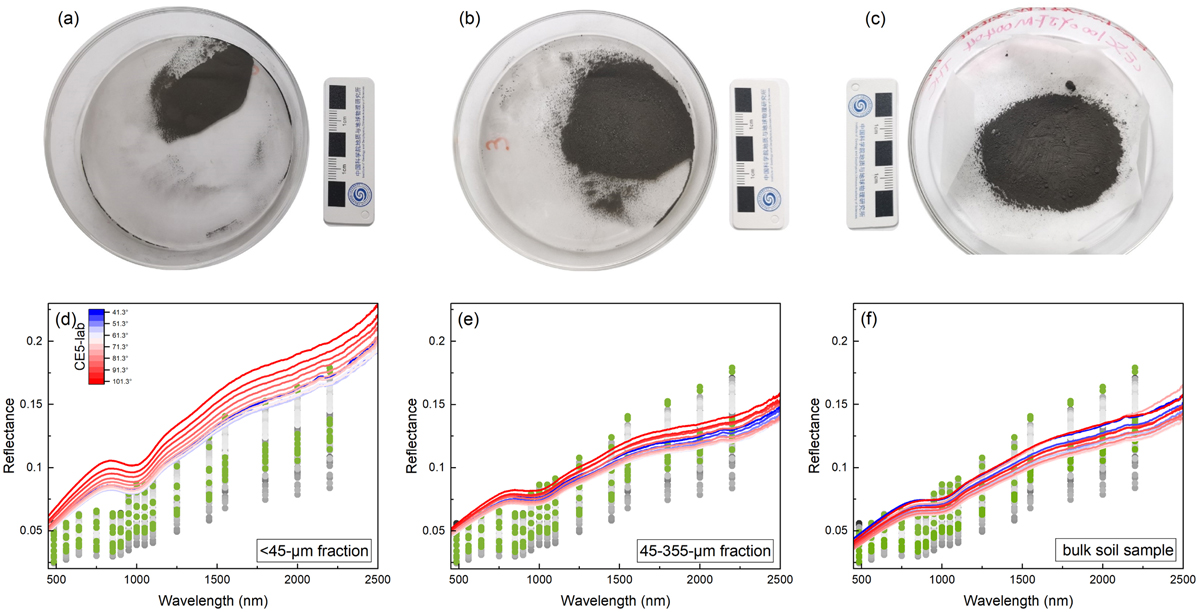
Images and reflectance spectra of the CE5 samples. The images of the CE5 samples: (a) <45-μm fraction, (b) 45–355-μm fraction, and (c) bulk soil sample. The spectra: (d) <45-μm fraction, (e) 45–355-μm fraction, and (f) bulk soil sample. The gray plots represent the CE5 in situ multispectral reflectance obtained by LMS. The green plots represent CE5 in situ multispectra at the sampled locations.
Current usage metrics show cumulative count of Article Views (full-text article views including HTML views, PDF and ePub downloads, according to the available data) and Abstracts Views on Vision4Press platform.
Data correspond to usage on the plateform after 2015. The current usage metrics is available 48-96 hours after online publication and is updated daily on week days.
Initial download of the metrics may take a while.