| Issue |
A&A
Volume 682, February 2024
|
|
|---|---|---|
| Article Number | A112 | |
| Number of page(s) | 7 | |
| Section | Planets and planetary systems | |
| DOI | https://doi.org/10.1051/0004-6361/202347577 | |
| Published online | 08 February 2024 | |
Visible and near-infrared spectral results of Chang’E-5 surficial and subsurface soils
1
Key Laboratory of Planetary Sciences, Purple Mountain Observatory, Chinese Academy of Sciences,
Nanjing, PR China
e-mail: This email address is being protected from spambots. You need JavaScript enabled to view it.
2
State Key Laboratory of Lunar and Planetary Sciences, Macau University of Science and Technology,
Macau, China
3
CAS Center for Excellence in Comparative Planetology, University of Science and Technology of China,
Hefei, PR China
4
School of Astronomy and Space Science, University of Science and Technology of China,
Hefei, PR China
5
Jiangsu Center for Collaborative Innovation in Geographical Information Resource Development and Application,
Nanjing, PR China
6
National Key Laboratory of Science and Technology on Remote Sensing Information and Image Analysis, Beijing Research Institute of Uranium Geology,
Beijing, PR China
Received:
27
July
2023
Accepted:
5
December
2023
Abstract
Aims. Studies on high-resolution and high-precision laboratory reflectance spectra of the Moon have historically been restricted to the analysis of old Apollo samples (>3.0 Ga). In contrast, studies of young lunar soils have exclusively relied on the analysis of remote sensing spectra. In this study, we present the results of a laboratory spectral investigation of young lunar soils (~2.0 Ga) obtained by the Chang’E-5 (CE-5) mission.
Methods. We analyzed surficial and subsurface soils collected through scooped and drilled sampling methods. The laboratory reflectance spectra of the CE-5 soils were compared with those of Apollo soils and orbital spectra. Two methods were employed for maturity inversion. The relationship between the UV-vis color and TiO2 content of young basalts was also investigated.
Results. The CE-5 samples exhibit much fresher spectral features, including higher reflectance, deeper absorption depths, and a smaller visible and near-infrared continuum slope (VNCS), compared to pristine regolith. The subsurface soils sampled from a depth of approximately 10 cm exhibit a slightly fresher spectral feature compared to the surficial soils. Our comparison revealed a rapid rate of space weathering at the lunar surface compared to the vertical overturn. Compared to older iron-rich soils, the CE-5 soils have a larger reflectance but similar UV-vis ratios. The UV-vis ratio alone could not accurately predict the TiO2 content of all mare basalts. The CE-5 samples provide a new ground truth for estimating the TiO2 content of young lunar basalts, which have the largest uncertainty in TiO2 content, as estimated from spectral parameters. We find that the samples returned by the CE-5 mission represent disturbed soils and that they exhibit significantly fresher characteristics compared to pristine regolith, a fact that should be kept in mind when using samples as ground truth for remote sensing research.
Key words: radiative transfer / methods: data analysis / Moon / planets and satellites: surfaces / infrared: planetary systems
© The Authors 2024
 Open Access article, published by EDP Sciences, under the terms of the Creative Commons Attribution License (https://creativecommons.org/licenses/by/4.0), which permits unrestricted use, distribution, and reproduction in any medium, provided the original work is properly cited.
This article is published in open access under the Subscribe to Open model. This email address is being protected from spambots. You need JavaScript enabled to view it. to support open access publication.
1 Introduction
The visible and near-infrared (VNIR; 350–2500 nm) reflectance spectra of the Moon help constrain the mineralogy, elements, and effects of space weathering on the lunar surface. Previous studies have analyzed the laboratory reflectance spectra of old lunar samples (>3.0 Ga) returned by the Apollo missions (e.g., Taylor et al. 2001, 2010; Pieters et al. 2006; Isaacson et al. 2011), while young lunar soils (<3.0 Ga) have only been studied with remote sensing spectra, which have coarser resolution and a relatively lower signal-to-noise ratio due to a lack of young lunar samples in our collections. The low resolution and S/N of remote sensing spectra make it difficult to characterize the precise absorption features of minerals.
In December 2020, the Chang’E-5 (CE-5) mission successfully landed in northern Oceanus Procellarum (43.06°N, 51.92°W) and collected a total of 1731 grams of lunar samples (Fig. 1). The landing zone was within one of the youngest lunar mare basalts (∽2.0 Ga; Che et al. 2021; Li et al. 2021), which represent the last major phase of lunar volcanism. These young basalts, well known as spectrally unique late-stage basalts, are characterized by clear 1 μm but weak 2 μm absorptions and blue ultraviolet to visible slopes, which were thought to be rich in olivine and titanium, respectively (Pieters 1978; Pieters et al. 1980; Lucey et al. 2000a; Staid et al. 2011; Zhang et al. 2016; Wu et al. 2018a).
To date, the VNIR reflectance spectroscopy studies conducted on the CE-5 samples have mainly included 1) mineral composition inversion (Liu et al. 2022; Lu et al. 2023b) and 2) maturity and space weathering (Chang et al. 2023; Lu et al. 2023a). The maturity of CE-5 soils was proposed to be submature to mature based on the Hapke radiative transfer model (Lu et al. 2023a) and spectral ratio (Chang et al. 2023). The CE-5 samples include both surficial and subsurface soils acquired through scooping and drilling sampling, providing an opportunity to emphasize variations in the soil profile and discrepancies between the spectra acquired in the laboratory and those obtained through remote sensing. In this study, we investigate the laboratory spectral characteristics of CE-5 surficial and subsurface samples and compare these sample spectra to remote sensing data. The samples have been disturbed by rocket exhaust of the spacecraft during landing, whereas remote sensing spectra represent the properties of undisturbed, pristine regolith. Our comprehensive study emphasizes the importance of considering the representativeness of the samples, including their state and spatial scale, when conducting regional geological studies using returned samples. In addition to a maturity analysis, this paper delves into the relationship between spectra and composition, particularly the TiO2 content. The motivation behind this lies in the scarcity of TiO2 content data obtained from young basalt samples, which in previous studies were only taken from old Apollo and Luna samples.
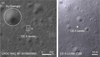 |
Fig. 1 Landing zone of CE-5 mission. (a) Lunar Reconnaissance Orbiter Camera (LROC) Narrow Angle Camera (NAC) image M1361560086R. The white circle indicates the Xu Guangqi crater. The white rectangle represents the area covered in (b). (b) CE-5 landing camera (LCAM) image 0389. |
2 Data and methods
The Chang’E-5 mission collected two types of samples, namely, surficial and subsurface samples through scooping and drilling, respectively. Two soil samples of 200 mg each were allocated to us by the China National Space Administration (CNSA). Sample 0600 (officially named CE5C0600) represents the scooped surficial soils, while sample 0906 (officially, CE5Z0906YJ) represents the drilled subsurface soils from a depth of approximately 10 cm. The grain size of the surficial soils was reported to range from 1.0 to 80.7 μm, with a mean of 26.2 μm, a median of 30.2 μηα, and a mode of 37.7 μηα. The grain size of the subsurface soils (~10 cm depth) ranges from 0.4 to 105.9 μm, with a mean of 42.9 μm, a median of 45.0 μm, and a mode of 52.6 μm (Zhao et al. 2023).
In this study, laboratory reflectance spectra of the CE-5 soils were compared with those of Apollo soils and orbital spectra (e.g., Moon Mineralogy Mapper, or M3). The reflectance spectra of the two CE-5 samples were measured at the same photometric angles as those typically used for measuring Apollo soils (incidence i = 30°, emergence e = 0°, and phase angle α = 30°) using an ASD FieldSpec 4 Hi-Res VNIR spectrometer. A white spectralon standard was used as the reflectance standard. Five spectra were collected for each sample, and the average value was utilized in this study. The spectra and maturity parameters of Apollo samples come from bulk soils <45 μm from the Lunar Soil Characterization Consortium (LSCC; Taylor et al. 2001; Pieters et al. 2006) from the RELAB dataset1. Among the four size fractions in the LSCC soils, the spectral absorption depths are the shallowest for the <10 μm size fraction and the deepest for the 20–45 μm size fraction, and the reflectance spectra of the bulk soil sample (<45 μm size fraction) closely resemble those of CE-5 bulk soils, which is consistent with the grain size distribution of CE-5 soils (Appendix A). The M3 spectra were collected at the CE-5 landing site. The spectrum was extracted from a single pixel of M3 Optical Period 2 (OP2C1) L2 data at the landing site, which have been photometrically corrected to the same geometry (30°, 0°, 30°) as the samples, and the average spectra from two orbits (M3G20090612T101600, M3G20090612T143522) passing the landing site were used as the mean reflectance. The spectra were smoothed by B spline fitting, and then the band center, band depth, and visible and near-infrared continuum slope (VNCS; Wu et al. 2019) were calculated using a straight-line continuum (e.g., an automatic algorithm as a tangent line to the target absorption; see Wu et al. 2018a for details).
The specific ferromagnetic resonance intensity normalized to the total iron content (Is/FeO) has been demonstrated to accurately indicate the degree of space weathering in lunar soil (Morris 1976, 1978b). It correlates with optical maturity indices, such as the near-infrared/visible ratio (Fischer & Pieters 1996) or the optical maturity parameter (OMAT; Lucey et al. 2000b). To determine the Is/FeO value of the CE-5 soils, we used Apollo mare soils with high FeO contents (FeO > 15 wt.%) and two methods: (1) 750/950 nm reflectance ratio and (2) OMAT. The standard deviation is defined by
 (1)
(1)
where N is the number of samples.
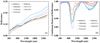 |
Fig. 2 Laboratory reflectance spectra of CE-5 and Apollo samples. (a) Reflectance spectra of CE-5 bulk soils. The spectra of Apollo mare bulk soils <45 μm are also shown for comparison. (b) Continuum removed spectra. Values in parentheses are the maturity parameter Is/FeO (<45 μm Taylor et al. 2001; Pieters et al. 2006). |
3 Results and discussion
3.1 Visible and near-infrared spectral characteristics
Figure 2 illustrates the VNIR bidirectional reflectance spectra of CE-5 bulk soils in comparison with the spectra of Apollo mare soils (10084, 15041, 15071, 71501, 79221). The comparison and analysis focus on the spectral parameters (e.g., absorption depth, slope, wavelength ratio) rather than the absolute reflectance value to mitigate potential discrepancies arising from variations in instruments, light sources, sample compaction situations, and other factors that might differ among different laboratory settings. Hence, it is important to bear these variations in mind when conducting comparisons based on absolute reflectance values.
The surficial and subsurface CE-5 soils appear quite similar, as both consist of aggregates of black-colored, sub-millimeter-sized fine powder. No substantial difference in reflectance value was observed between the two samples, particularly in the UV range (e.g., 350 nm), where the reflectance of the two samples converges to approximately the same value as those of Apollo soils. This supports the UV convergence phenomenon found for Apollo mare soils, which shows that the reflectance of all size fractions for mare soils converge at a similar value, around 350 nm (Pieters et al. 2000), and extends it to young mare soils. Table 1 lists the TiO2 content, calculated band center, band depth, and VNCS of CE-5 and Apollo samples. Compared with the subsurface soils, the surficial soils exhibit shallower depths in both the 1000 nm absorption (Band I) and the 2000 nm absorption (Band II), as well as a steeper VNCS, indicating that the surficial soils are slightly more mature than the subsurface soils. Another study of CE-5 soils has also indicated that the drilled soils are fresher than the scooped soils (Lu et al. 2023b). The differences in spectral parameters between the drilled soils and scooped soils in our study are smaller than those reported by Lu et al. (2023b), which is consistent with the fact that the depth of the drilled soils in Lu et al. (2023b) is approximately 50 cm, whereas ours is around 10 cm. The depths of Band I and Band II of CE-5 soils are deeper than those of 79221(91) and 10084(88), which also belong to high-iron and mid-high-titanium basalts but have larger Is/FeO values. This suggests that the CE-5 soils are less mature than 79221 and 10084. The absorption depths of CE-5 soils are also deeper than that of 71501(44), which has a low Is/FeO value, indicating the effect of TiO2 on the spectra. The high TiO2 abundance of 71501 (9.31 wt.%; Taylor et al. 2001) leads to a decrease in absorption depth. The highly mature soil, 15041, exhibits a similar Band I depth to that of 0600 due to its very low TiO2 content (1.83 wt.%; Taylor et al. 2001). The analyses above provide a comprehensive consideration of both the effects of compositions and maturity on the spectra, which is further supported by the VNCS. For example, 79221, which should theoretically have a smaller spectral slope than the CE-5 soils, due to its high TiO2 content, exhibits a larger slope that is consistent with its high maturity (Fig. 3).
A comparison between the laboratory spectra and remote sensing spectra is illustrated in Fig. 4. The laboratory reflectance at 1500 nm and 750 nm is 1.33 and 1.55 times higher than the OP2C1 M3 data, respectively. This finding confirms previous studies, demonstrating that laboratory reflectance measurements are 1.87 times higher at 415 nm (Hillier 1999), 1.78 times higher at 770 nm (Wu et al. 2018b), and 1.69 times higher at 950 nm (Saiki et al. 2008) than remote sensing measurements for the Apollo 16 site. The absorption depth of Band I is 12 and 16% for samples 0600 and 0906, respectively (Table 1), in contrast to the 10% band depth of M3 measurements. Both the reflectance values and the absorption depths show that the returned samples are less mature than the undisturbed regolith, indicating that the samples cannot represent the real surface of the Moon. This is consistent with previous studies, which have also showed that laboratory measurements cannot duplicate the photometric properties of the natural lunar surface (Shkuratov et al. 2000; Ohtake et al. 2010; Pieters et al. 2013).
Figure 5 shows the established correlations between the Is/FeO and 750/950 nm ratio and OMAT, respectively, based on which Is/FeO values of the two CE-5 samples are calculated. Interestingly, both methods yielded similar results. For sample 0600, the Is/FeO calculated using the 750/950 nm reflectance ratio and OMAT is 63 and 61, respectively, with an average of 62. For sample 0906, the values are 47 and 45, respectively, with an average of 46. The standard deviations for the two methods are 25 and 27, respectively. Our results are consistent with previous estimates using the Hapke radiative transfer model (Lu et al. 2023a) and spectral ratio (Chang et al. 2023).
Based on the calculated Is/FeO values and the corresponding Is/FeO ranges (<30, 30–60, and >60) used to categorize soil maturity as immature, submature, and mature (Morris 1976, 1978a), the CE-5 surficial soils are classified within the “mature” range, while the subsurface soils are categorized as “submature.” In situ spectra measured on the surface of the Moon have also shown that the regolith at the CE-5 landing site is less mature than the regolith at the Chang’E-4 landing site (Wu et al. 2022). In contrast, the extrapolation using the 750/950 nm ratio of M3 data yields an Is/FeO of 102, which represents pristine soils, significantly larger than that of surficial sample 0600. This suggests that the undisturbed surface soils of the CE-5 landing region are highly mature and that the apparent high freshness calculated from both the laboratory sample spectra and the in situ spectra is likely due to the surface regolith being disturbed by the rocket exhaust from the spacecraft. The finest fractions of the lunar surface soils are very mature and have been blown away by the rocket exhaust. This was evidenced by the substantial disparity between four in situ spectra acquired by the imaging spectrometer on board the Chang’E-3 “Yutu” rover concerning both the disturbed and undisturbed soils encountered along the rover’s route (Wu & Hapke 2018; Wu et al. 2019). A recent study based on the magnetic approaches has shown that the Is/FeO of CE-5 soils is  , and also proposed that the rocket exhaust removed the top mature soils and contributed to this maturity (Qian et al. 2023).
Apollo core samples indicate an average Is/FeO value alteration of approximately 10% within the initial 10 cm of the lunar regolith (Clegg et al. 2014). Our comparison between pristine undisturbed regolith, scooped regolith, and drilled regolith reveals more substantial variations. Our findings indicate a rapid rate of space weathering at the lunar surface compared to the vertical overturn. Due to their young ages (~2.0 Ga; Che et al. 2021; Li et al. 2021), the mixing depth of the CE-5 soils is not as deep as those of the old Apollos soils, that is, the Is/FeO value changes of CE-5 cores are larger than Apollo cores. Furthermore, the limited variation detected in the Apollo core samples can be attributed, in part, to the absence of undisturbed surficial samples in the collected soil samples, as pointed out by Clegg et al. (2014). In this study, we expanded our analysis by including orbital spectra obtained from undisturbed pristine soils for comparison.
It is important to note that the scale and representativeness of lunar samples can be a significant concern in this context. Each of our samples is only 200 mg, which is perhaps too small to adequately represent the broader CE-5 landing region. Additionally, analysis of Apollo cores has indicated that parameters such as maturity or chemical composition exhibit unsystematic variations with depth at specific locations. Lunar cores do not mirror continuous slow deposition, as in a terrestrial ocean environment. Instead, they reflect sporadic impact events interspersed with periods of relatively quiescent soil development (Korotev & Morris 1993). Further investigations with large-volume samples are needed.
TiO2 content, calculated band center, band depth, and VNCS of CE-5 and Apollo samples.
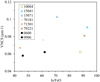 |
Fig. 3 Visible and near-infrared continuum slope versus Is/FeO for CE-5 soils and LSCC mare bulk soils <45 μm. |
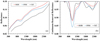 |
Fig. 4 Comparison of the reflectance spectra between the laboratory sample and orbital data (M3). (a) Reflectance spectra. (b) Continuum removed spectra. |
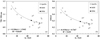 |
Fig. 5 Is/FeO versus 750/950 nm reflectance ratio (a) and OMAT (b) for mare soils. The logarithmic function shown by the dashed line is the one used in this study to estimate Is/FeO. Both plots give a similar estimation of Is/FeO. |
3.2 Relationship between UV-vis color and TiO2 content of young basalts
The lunar maria exhibit significant variations in the ratio of ultraviolet to visible wavelengths. The UV-vis color ratio, or variations thereof, has been widely used to estimate the TiO2 contents of mare basalts. Numerous studies have been conducted in the past to understand the relationship between the UV-vis color and TiO2 (known as the Charette Relation; Charette et al. 1974; Johnson et al. 1977, 1991a,b). Gillis-Davis et al. (2006) discovered that the relationship between the UV-vis ratio and TiO2 composition is best represented by a sigmoidal trend rather than a linear or curvilinear correlation. The greatest uncertainties in TiO2 prediction are evident in mare soils characterized by intermediate UV-vis ratio values ranging from 0.58 to 0.66 for Clementine data, which are prevalent across the majority of lunar maria (75%; Gillis-Davis et al. 2006). In this range of UV-vis ratios, the calculated TiO2 content can exhibit unpredictable variations, ranging from 0 to 7.4 wt.%. The young basalts in Oceanus Procellarum fall within the range associated with the highest TiO2 uncertainties and have thus been suggested as a high priority for future sample return missions (Gillis et al. 2003). The CE-5 samples provide a ground truth for establishing the correlation between UV-vis color and TiO2 content in young basalts, enhancing the accuracy of TiO2 content mapping.
The young basalts widely distributed in the western near side of the Moon are well known as high-Ti basalts (Pieters 1978; Lucey et al. 2000a; Staid et al. 2011). However, the TiO2 content measured in the CE-5 soil samples is 5.19 wt.% (Yao et al. 2022), indicating that the TiO2 content of young basalts has been overestimated in the past. The 415/750 nm reflectance ratio of the CE-5 soils is 0.61. Figure 6 shows that mature (Is/FeO > 60) soil samples from CE-5 (0600), Apollo 11 (10084), and Apollo 17 (79221) exhibit similar UV-vis ratios but significant variations in TiO2 content, underscoring the limitations of using the UV-vis ratio as an accurate predictor of TiO2 content. The CE-5 samples validate the sigmoidal relationship between the UV-vis ratio and TiO2 content (Gillis-Davis et al. 2006) and provide an float on the sigmoidal trend for late-stage basalts, which have the largest uncertainties in TiO2 estimation.
Gillis-Davis et al. (2006) reported that areas with enriched iron compositions coincide with regions that exhibit the largest predicted errors in TiO2 estimation of the whole Moon and concluded that the disproportionate reduction in visible reflectance compared to UV reflectance can be attributed to the presence of Fe. We conducted an analysis to test this hypothesis using CE-5 soils, which have the highest FeO content among all lunar samples returned from known locations (Fig. 7). The reflectance of CE-5 soils at 415 nm is the highest among all samples, while the reflectance at 750 nm is lower than that of Apollo 12 and Apollo 15 samples (Fig. 7). This finding supports the opinion of Gillis-Davis et al. (2006) that FeO disproportionately lowers the reflectance at 750 nm relative to 415 nm. Among the three most mafic soils (CE-5, Apollo 11, and Apollo 17; Taylor et al. 2001; Li et al. 2022), the CE-5 soils have the lowest TiO2 content, the highest FeO content, and the highest reflectance. This indicates that TiO2 composition has a more pronounced effect on reducing reflectance compared to FeO.
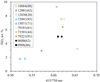 |
Fig. 6 TiO2 versus 415/750 ratio for CE-5 soils and LSCC mare bulk soils <45 μm. Values in parentheses are the maturity parameter Is/FeO. |
 |
Fig. 7 FeO versus 415 nm reflectance (a) and 750 nm reflectance (b) for CE-5 and LSCC mare bulk soils <45 μm. |
4 Conclusions
China’s CE-5 mission was the first mission to provide young lunar samples. In this study, we analyzed the laboratory spectra of CE-5 surficial and subsurface soil samples and compared them with that of Apollo samples as well as orbital data. The main conclusions are as follows:
- 1.
The collected samples are less mature than the undisturbed lunar regolith explored by remote sensing techniques. As such, the samples are less representative of the pristine lunar surface.
- 2.
The UV-vis ratio and TiO2 content of the CE-5 soils align more closely with the sigmoidal trend than a single regression model. The CE-5 samples provide an float on the sigmoidal trend for estimating TiO2 content for late-stage basalts.
Our results suggest that although CE-5 samples provide a new ground truth for young lunar basalts, caution should be exercised when using CE-5 samples as the ground truth for remote sensing applications.
Acknowledgements
We appreciate the helpful comments and suggestions from the anonymous referee. We gratefully thank the China National Space Administration (CNSA) for providing the CE-5 soil samples (CE5C0600 and CE5Z0906YJ). This research was funded by the Strategic Priority Research Program of Chinese Academy of Sciences (XDB 41000000), the National Natural Science Foundation of China (42050202, 42371383, 42303040), the Macau Science and Technology Development Fund (0109/2021/A2), the Fund of National Key Laboratory of Science and Technology on Remote Sensing Information and imagery Analysis, Beijing Research Institute of Uranium Geology (6142A01210201-2), the Minor Planet Foundation of Purple Mountain Observatory, and the Natural Science Foundation (BK20231105) and the Excellent Postdoctoral Program of Jiangsu Province.
Appendix A Comparison of the reflectance of the four size fractions
Figure A.1 shows the reflectance of CE-5 samples compared to the reflectance of the four size fractions of Apollo samples.
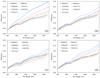 |
Fig. A.1 Comparison of the reflectance between CE-5 samples and the four size fractions of Apollo samples. (a) Size fraction of <10 μm. (b) Size fraction of 10–20 μm. (c) Size fraction of 20–45 μm. (d) Size fraction of <45 μm. |
References
- Chang, R., Lin, H., Yang, W., et al. 2023, A&A, 674, A68 [NASA ADS] [CrossRef] [EDP Sciences] [Google Scholar]
- Charette, M. P., McCord, T. B., Pieters, C., & Adams, J. B. 1974, J. Geophys. Res., 79, 1605 [NASA ADS] [CrossRef] [Google Scholar]
- Che, X., Nemchin, A., Liu, D., et al. 2021, Science, 374, 887 [NASA ADS] [CrossRef] [Google Scholar]
- Clegg, R. N., Jolliff, B. L., Robinson, M. S., Hapke, B. W., & Plescia, J. B. 2014, Icarus, 227, 176 [NASA ADS] [CrossRef] [Google Scholar]
- Fischer, E. M., & Pieters, C. M. 1996, J. Geophys. Res. Planets, 101, 2225 [NASA ADS] [CrossRef] [Google Scholar]
- Gillis, J. J., Jolliff, B. L., & Elphic, R. C. 2003, J. Geophys. Res. Planets, 108, E2 [CrossRef] [Google Scholar]
- Gillis-Davis, J. J., Lucey, P. G., & Hawke, B. R. 2006, Geochim. Cosmochim. Acta, 70, 6079 [NASA ADS] [CrossRef] [Google Scholar]
- Hillier, J. 1999, Icarus, 141, 205 [NASA ADS] [CrossRef] [Google Scholar]
- Isaacson, P., Basu, A., Pieters, C., et al. 2011, Meteor. Planet. Sci., 46, 228 [NASA ADS] [CrossRef] [Google Scholar]
- Johnson, J. R., Larson, S. M., & Singer, R. B. 1991a, Geophys. Res. Lett., 18, 2153 [NASA ADS] [CrossRef] [Google Scholar]
- Johnson, J. R., Larson, S. M., & Singer, R. B. 1991b, J. Geophys. Res. Planets, 96, 18861 [NASA ADS] [CrossRef] [Google Scholar]
- Johnson, T. V., Saunders, R. S., Matson, D., & Mosher, J. 1977, Lunar Planet. Sci. Conf. Proc., 8, 1029 [Google Scholar]
- Korotev, R. L., & Morris, R. V. 1993, Geochim. Cosmochim. Acta, 57, 4813 [NASA ADS] [CrossRef] [Google Scholar]
- Li, Q.-L., Zhou, Q., Liu, Y., et al. 2021, Nature, 600, 54 [CrossRef] [Google Scholar]
- Li, C., Hu, H., Yang, M.-F., et al. 2022, Nat. Sci. Rev., 9, 188 [CrossRef] [Google Scholar]
- Liu, D., Wang, X., Liu, J., et al. 2022, Nat. Commun., 13, 5965 [NASA ADS] [CrossRef] [Google Scholar]
- Lu, X., Chen, J., Ling, Z., et al. 2023a, Nat. Astron., 7, 142 [NASA ADS] [Google Scholar]
- Lu, X., Ling, Z., Chen, J., Cao, H., & Liu, C. 2023b, Lunar Planet. Sci., 54, 2035 [Google Scholar]
- Lucey, P. G., Blewett, D. T., & Jolliff, B. L. 2000a, J. Geophys. Res. Planets, 105, 20297 [CrossRef] [Google Scholar]
- Lucey, P. G., Blewett, D. T., Taylor, G. J., & Hawke, B. R. 2000b, J. Geophys. Res. Planets, 105, 20377 [NASA ADS] [CrossRef] [Google Scholar]
- Morris, R. V. 1976, Lunar Planet. Sci. Conf. Proc., 1, 315 [NASA ADS] [Google Scholar]
- Morris, R. V. 1978a, Lunar Planet. Sci. Conf. Proc., 2, 1801 [Google Scholar]
- Morris, R. V. 1978b, Lunar Planet. Sci. Conf. Proc., 2, 2287 [Google Scholar]
- Ohtake, M., Matsunaga, T., Yokota, Y., et al. 2010, Space Sci. Rev., 154, 57 [NASA ADS] [CrossRef] [Google Scholar]
- Pieters, C. M. 1978, Lunar Planet. Sci. Conf. Proc., 3, 2825 [Google Scholar]
- Pieters, C. M., Head, J. W., Adams, J. B., et al. 1980, J. Geophys. Res. Solid Earth, 85, 3913 [CrossRef] [Google Scholar]
- Pieters, C. M., Taylor, L. A., McKay, D., et al. 2000, Lunar Planet. Sci., 31, 1865 [Google Scholar]
- Pieters, C., Shkuratov, Y., Kaydash, V., Stankevich, D., & Taylor, L. 2006, Icarus, 184, 83 [NASA ADS] [CrossRef] [Google Scholar]
- Pieters, C., Boardman, J., Ohtake, M., et al. 2013, Icarus, 226, 951 [NASA ADS] [CrossRef] [Google Scholar]
- Qian, Y., Xiao, L., Zhao, J., et al. 2023, Icarus, 410, 115892 [Google Scholar]
- Saiki, K., Saito, K., Okuno, H., et al. 2008, Earth Planets Space, 60, 417 [NASA ADS] [CrossRef] [Google Scholar]
- Shkuratov, Y. G., Kaydash, V., Pieters, C., & Opanasenko, N. 2000, Lunar Planet. Sci., 31, 1165 [Google Scholar]
- Staid, M. I., Pieters, C. M., Besse, S., et al. 2011, J. Geophys. Res., 116, E00G10 [Google Scholar]
- Taylor, L., Pieters, C., Keller, L., Morris, R., & McKay, D. 2001, J. Geophys. Res., 106, 27985 [NASA ADS] [CrossRef] [Google Scholar]
- Taylor, L. A., Pieters, C., Patchen, A., et al. 2010, J. Geophys. Res. Planets, 115, E02002 [Google Scholar]
- Wu, Y., & Hapke, B. 2018, Earth Planet. Sci. Lett., 484, 145 [CrossRef] [Google Scholar]
- Wu, Y., Li, L., Luo, X., et al. 2018a, Icarus, 303, 67 [NASA ADS] [CrossRef] [Google Scholar]
- Wu, Y., Wang, Z., Cai, W., & Lu, Y. 2018b, AJ, 155, 213 [NASA ADS] [CrossRef] [Google Scholar]
- Wu, Y., Wang, Z., & Lu, Y. 2019, Res. Astron. Astrophys., 19, 52 [Google Scholar]
- Wu, X., Liu, Y., Yang, Y., et al. 2022, Earth Planet. Sci. Lett., 594, 117747 [CrossRef] [Google Scholar]
- Yao, Y., Xiao, C., Wang, P., Li, C., & Zhou, Q. 2022, J. Am. Chem. Soc., 144, 5478 [CrossRef] [Google Scholar]
- Zhang, X., Wu, Y., Ouyang, Z., et al. 2016, J. Geophys. Res. Planets, 121, 2063 [NASA ADS] [CrossRef] [Google Scholar]
- Zhao, S., Xiao, L., Qian, Y., et al. 2023, Icarus, 406, 115766 [NASA ADS] [CrossRef] [Google Scholar]
RELAB dataset:https://sites.brown.edu/relab/lscc/
All Tables
TiO2 content, calculated band center, band depth, and VNCS of CE-5 and Apollo samples.
All Figures
|
Fig. 1 Landing zone of CE-5 mission. (a) Lunar Reconnaissance Orbiter Camera (LROC) Narrow Angle Camera (NAC) image M1361560086R. The white circle indicates the Xu Guangqi crater. The white rectangle represents the area covered in (b). (b) CE-5 landing camera (LCAM) image 0389. |
| In the text | |
|
Fig. 2 Laboratory reflectance spectra of CE-5 and Apollo samples. (a) Reflectance spectra of CE-5 bulk soils. The spectra of Apollo mare bulk soils <45 μm are also shown for comparison. (b) Continuum removed spectra. Values in parentheses are the maturity parameter Is/FeO (<45 μm Taylor et al. 2001; Pieters et al. 2006). |
| In the text | |
|
Fig. 3 Visible and near-infrared continuum slope versus Is/FeO for CE-5 soils and LSCC mare bulk soils <45 μm. |
| In the text | |
|
Fig. 4 Comparison of the reflectance spectra between the laboratory sample and orbital data (M3). (a) Reflectance spectra. (b) Continuum removed spectra. |
| In the text | |
|
Fig. 5 Is/FeO versus 750/950 nm reflectance ratio (a) and OMAT (b) for mare soils. The logarithmic function shown by the dashed line is the one used in this study to estimate Is/FeO. Both plots give a similar estimation of Is/FeO. |
| In the text | |
|
Fig. 6 TiO2 versus 415/750 ratio for CE-5 soils and LSCC mare bulk soils <45 μm. Values in parentheses are the maturity parameter Is/FeO. |
| In the text | |
|
Fig. 7 FeO versus 415 nm reflectance (a) and 750 nm reflectance (b) for CE-5 and LSCC mare bulk soils <45 μm. |
| In the text | |
|
Fig. A.1 Comparison of the reflectance between CE-5 samples and the four size fractions of Apollo samples. (a) Size fraction of <10 μm. (b) Size fraction of 10–20 μm. (c) Size fraction of 20–45 μm. (d) Size fraction of <45 μm. |
| In the text | |
Current usage metrics show cumulative count of Article Views (full-text article views including HTML views, PDF and ePub downloads, according to the available data) and Abstracts Views on Vision4Press platform.
Data correspond to usage on the plateform after 2015. The current usage metrics is available 48-96 hours after online publication and is updated daily on week days.
Initial download of the metrics may take a while.