Open Access
Fig. 3
Download original image
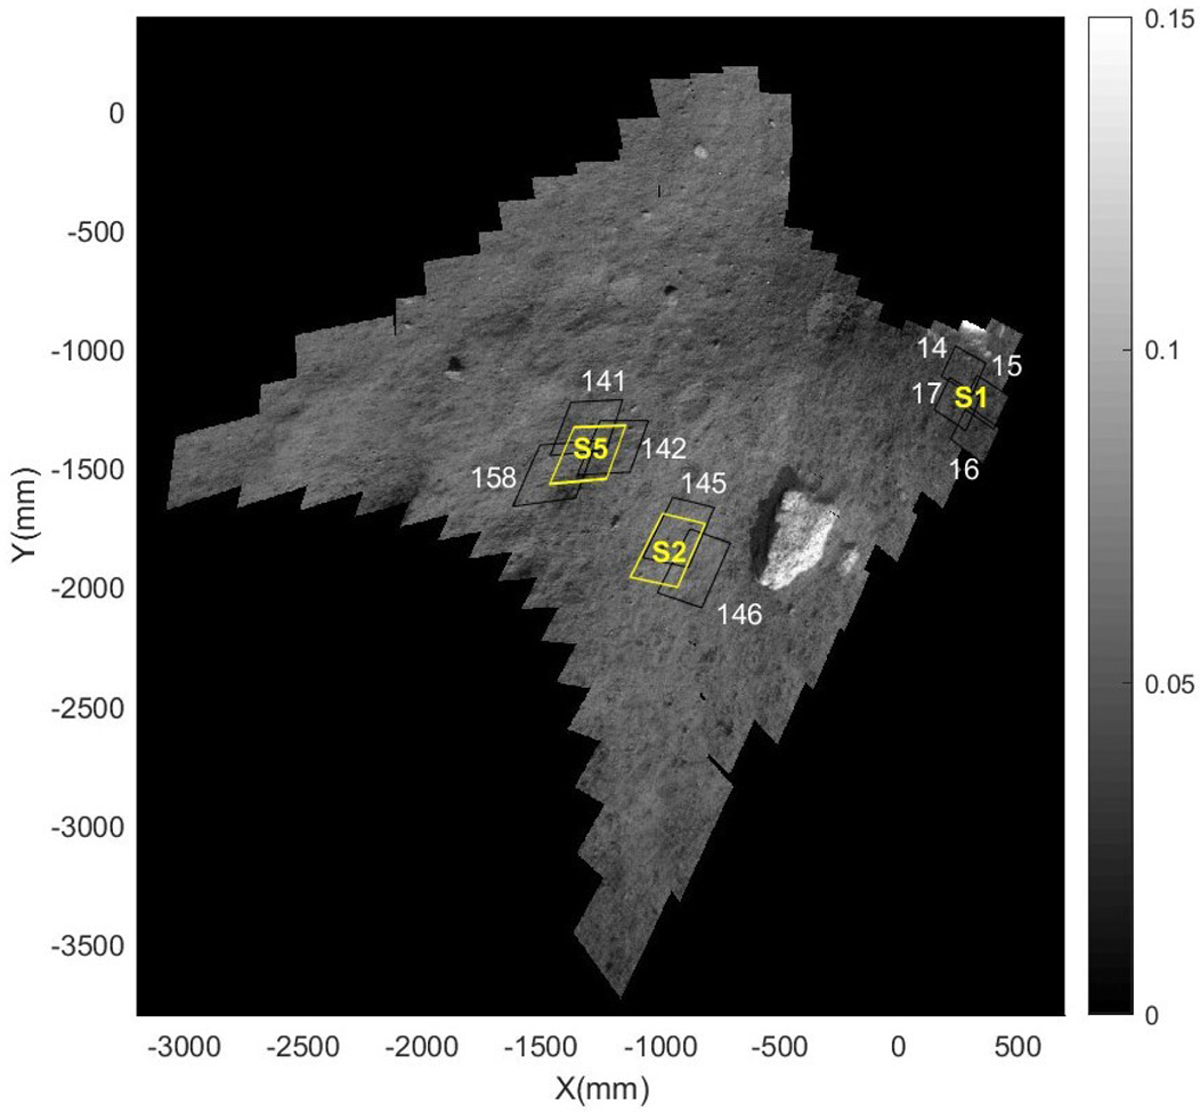
Full-view scanning and multispectral observation map obtained by LMS at 750 nm (Liu et al. 2022). The black boxes indicate the multispectral detection areas related to the sampling sites. The yellow numbers (S1, S2, and S5) indicate the sampling sites.
Current usage metrics show cumulative count of Article Views (full-text article views including HTML views, PDF and ePub downloads, according to the available data) and Abstracts Views on Vision4Press platform.
Data correspond to usage on the plateform after 2015. The current usage metrics is available 48-96 hours after online publication and is updated daily on week days.
Initial download of the metrics may take a while.