Fig. 13
Download original image
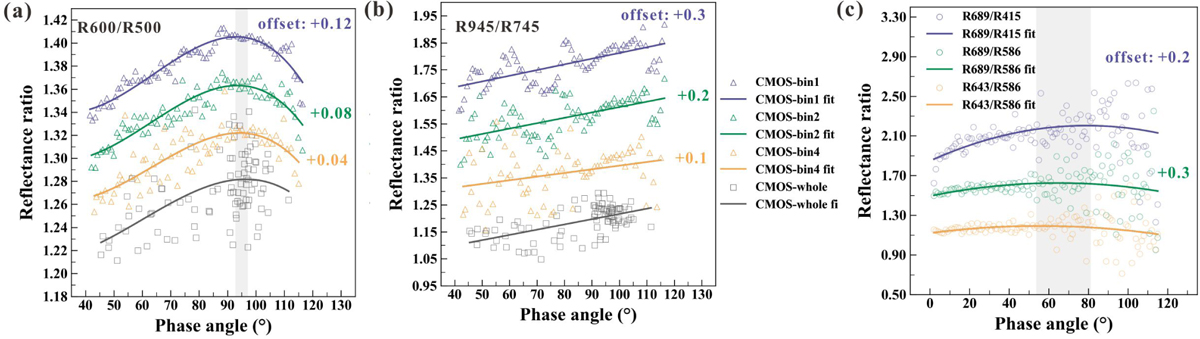
Colour ratio phase curves for different bands combinations. (a) and (b) were derived by our four datasets, while (c) was derived from Hapke et al. (2012). The lines in (a), (b), and (c) are the best-fit results with a third-order, first-order, and second-order polynomial, respectively. All spectra are vertically offset for clarity. The phase angles of the maximum ratio values are marked by the grey region.
Current usage metrics show cumulative count of Article Views (full-text article views including HTML views, PDF and ePub downloads, according to the available data) and Abstracts Views on Vision4Press platform.
Data correspond to usage on the plateform after 2015. The current usage metrics is available 48-96 hours after online publication and is updated daily on week days.
Initial download of the metrics may take a while.