Fig. 11
Download original image
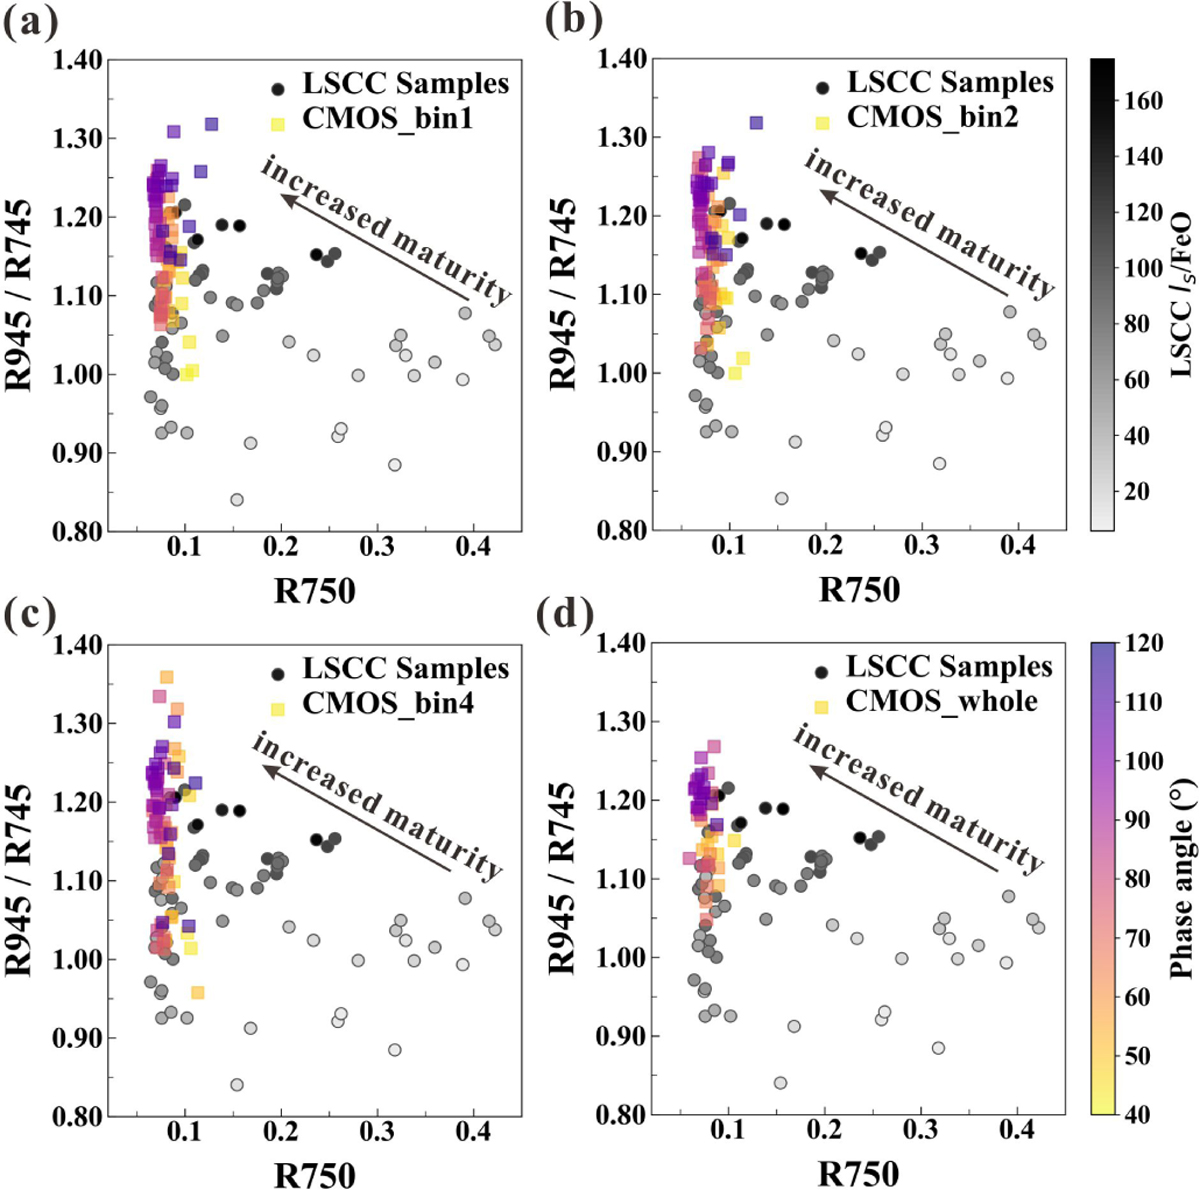
Distribution patterns of the R945/R745 values against reflectance at 745 nm. Panels ato d show the results for the CMOS-bin1, CMOS-bin2, CMOS-bin4, and CMOS-whole datasets, respectively. The squares represent the CMOS data and the circles represent the LSCC samples. Each square in these subfigures is the mean value within a 1° phase angle bin. The spectra of the Apollo returned lunar soil samples are from the LSCC database and are measured under the standard geometry (i = 30°, e = 0°, g = 30°). The Is /FeO values are from Pieters et al. (2006).
Current usage metrics show cumulative count of Article Views (full-text article views including HTML views, PDF and ePub downloads, according to the available data) and Abstracts Views on Vision4Press platform.
Data correspond to usage on the plateform after 2015. The current usage metrics is available 48-96 hours after online publication and is updated daily on week days.
Initial download of the metrics may take a while.