| Issue |
A&A
Volume 695, March 2025
|
|
|---|---|---|
| Article Number | A279 | |
| Number of page(s) | 22 | |
| Section | Extragalactic astronomy | |
| DOI | https://doi.org/10.1051/0004-6361/202451825 | |
| Published online | 26 March 2025 | |
New JWST redshifts for the host galaxies of CDF-S XT1 and XT2: Understanding their nature
1
Department of Astrophysics/IMAPP, Radboud University, PO Box 9010 6500 GL Nijmegen, The Netherlands
2
Instituto de Astrofísica, Pontificia Universidad Católica de Chile, Casilla 306, Santiago 22, Chile
3
Millennium Institute of Astrophysics (MAS), Nuncio Monseñor Sótero Sanz 100, Providencia, Santiago, Chile
4
Instituto de Alta Investigación, Universidad de Tarapacá, Casilla 7D, Arica, Chile
5
Department of Astronomy & Astrophysics, 525 Davey Laboratory, The Pennsylvania State University, University Park, PA 16802, USA
6
Institute for Gravitation and the Cosmos, The Pennsylvania State University, University Park, PA 16802, USA
7
Department of Physics, 104 Davey Laboratory, The Pennsylvania State University, University Park, PA 16802, USA
8
Indian Institute of Astrophysics, Koramangala, Bengaluru, 560034 Karnataka, India
9
CAS Key Laboratory for Research in Galaxies and Cosmology, Department of Astronomy, University of Science and Technology of China, Hefei 230026, China
10
School of Astronomy and Space Science, University of Science and Technology of China, Hefei 230026, China
11
Key Laboratory for Research in Galaxies and Cosmology, Shanghai Astronomical Observatory, Chinese Academy of Sciences, 80 Nandan Road, Shanghai 200030, PR China
⋆ Corresponding author; This email address is being protected from spambots. You need JavaScript enabled to view it.
Received:
7
August
2024
Accepted:
31
January
2025
Abstract
Aims. CDF-S XT1 and XT2 are considered two “canonical” extragalactic fast X-ray transients (FXTs). In this work, we report new constraints on both FXTs, based on recent JWST NIRCam and MIRI photometry, as well as NIRspec spectroscopy for CDF-S XT2 that allow us to improve our understanding of their distances, energetics, and host galaxy properties compared to the pre-JWST era.
Methods. We use the available HST and JWST archival data to determine the host properties and constrain the energetics of each FXT based on spectral energy distribution (SED) photometric fitting.
Results. The host of CDF-S XT1 is now constrained to lie at zphot = 2.76+2.21-0.13, implying a host absolute magnitude MR = −19.14 mag, stellar mass M* ≈ 2.8 × 10⁸ M⊙, and star formation rate SFR ≈ 0.62 M⊙ yr−1. These properties lie at the upper end of previous estimates, leaving CDF-S XT1 with a peak X-ray luminosity of LX, peak ≈ 2.8 × 1047 erg s−1. We argue that the best progenitor scenario for XT1 is a low-luminosity gamma-ray burst (GRB), although we do not fully rule out a proto-magnetar association or a jetted tidal disruption event involving a white dwarf and an intermediate-massive black hole. In the case of CDF-S XT2, JWST imaging reveals a new highly obscured component of the host galaxy, previously missed in HST images, while NIRspec spectroscopy securely places the host at zspec = 3.4598 ± 0.0022. The new redshift implies a host with MR = −21.76 mag, M* ≈ 5.5 × 10¹⁰ M⊙, SFR ≈ 160 M⊙ yr−1, and FXT LX, peak ≈ 1.4 × 1047 erg s−1. The revised energetics, similarity to X-ray flash event light curves, small host offset, and high host SFR favor a low-luminosity collapsar progenitor for CDF-S XT2. Although a magnetar model is not ruled out, it appears improbable.
Conclusions. While these HST and JWST observations shed light on the host galaxies of XT1 and XT2, and by extension, on the nature of FXTs, a unique explanation for both sources remains elusive. Rapid discovery, for instance, with the Einstein Probe satellite, and contemporaneous multiwavelength detections of FXTs remain essential for clarifying the nature of FXTs.
Key words: X-rays: bursts / X-rays: individuals: CDF-S XT1 / X-rays: individuals: XT2
© The Authors 2025
 Open Access article, published by EDP Sciences, under the terms of the Creative Commons Attribution License (https://creativecommons.org/licenses/by/4.0), which permits unrestricted use, distribution, and reproduction in any medium, provided the original work is properly cited.
This article is published in open access under the Subscribe to Open model. This email address is being protected from spambots. You need JavaScript enabled to view it. to support open access publication.
1. Introduction
Extragalactic fast X-ray transients (FXTs) are singular bursts of X-ray photons (in the ∼0.3−10 keV band) with durations of seconds to hours (Heise & in’t Zand 2010). Our knowledge of FXTs has increased substantially during the last two decades via the identification and characterization of sources detected by the Swift-XRT (e.g., Soderberg et al. 2008), Chandra X-ray Observatory (e.g., Jonker et al. 2013; Glennie et al. 2015; Bauer et al. 2017; Xue et al. 2019; Lin et al. 2022; Eappachen et al. 2022, 2023; Quirola-Vásquez et al. 2022, 2023), the X-ray Multi-mirror Mission – Newton telescope (XMM-Newton, e.g., Novara et al. 2020; Alp & Larsson 2020; De Luca et al. 2021; Eappachen et al. 2024), or the recently launched Einstein Probe Telescope (e.g., Liu et al. 2025; Levan et al. 2024; Gillanders et al. 2024; van Dalen et al. 2024). Despite these efforts, the relative numbers of confirmed FXTs remain low (≈34 FXTs), and hence, their nature and physical processes are still uncertain. Their properties strongly overlap with the theoretical parameter space occupied by core-collapse supernova (CC-SN) shock breakout events (SBOs; e.g., Soderberg et al. 2008; Alp & Larsson 2020; Sun et al. 2022; Scully et al. 2023), white dwarf-intermediate-mass black hole jetted tidal disruption events (WD-IMBH TDEs; e.g., Jonker et al. 2013; MacLeod et al. 2014; Glennie et al. 2015; Peng et al. 2019; Maguire et al. 2020; Saxton et al. 2021), gamma-ray bursts (GRBs; e.g., Zhang 2013; Bauer et al. 2017; Xue et al. 2019; Sarin et al. 2021; Ai & Zhang 2021; Lin et al. 2022; Levan et al. 2024; Wichern et al. 2024), and binary neutron star mergers (BNS; e.g., Bauer et al. 2017; Xue et al. 2019; Quirola-Vásquez et al. 2024).
Two “canonical” FXTs have been detected in the Chandra Deep Field-South (CDF-S; Luo et al. 2017; Xue 2017), denoted as CDF-S XT1 (Luo et al. 2014; Bauer et al. 2017) and CDF-S XT2 (Zheng et al. 2017; Xue et al. 2019), enabling detailed studies due to the large amount of multiwavelength ancillary data available there. Several attempts have been made to identify a unique progenitor (e.g., Bauer et al. 2017; Xue et al. 2019; Peng et al. 2019; Sun et al. 2019; Lü et al. 2019; Xiao et al. 2019; Sarin et al. 2021; Quirola-Vásquez et al. 2024), but it has not been possible for either object. Moreover, despite constraints from a wide variety of powerful telescopes spanning radio to X-ray wavelengths (e.g., Chandra, HST, MUSE, VLT, ALMA, Spitzer; Xue et al. 2016; Guo et al. 2013; Skelton et al. 2014; Aravena et al. 2016; Inami et al. 2017; Herenz et al. 2017), the available data have not permitted detailed characterization of their host galaxies. For instance, in the case of CDF-S XT1, despite the Hubble Space Telescope (HST) observations of the host, its photometric redshift shows large uncertainties (zphoto ≈ 0.4 − 3.2; Bauer et al. 2017), which have left large uncertainties on its energetics and hence its progenitor. The revolutionary launch of the James Webb Space Telescope (JWST; Gardner et al. 2006, 2023) has brought new life to various deep survey fields in the 0.6 − 25 μm range, with aims to study the formation of the first galaxies (even in the first 300 Myr) and (metal-free) stellar populations, and the formation and evolution of massive black holes (MBHs). In the CDF-S, for instance, the JWST Advanced Deep Extragalactic Survey (JADES) (Bunker et al. 2024; Rieke et al. 2023b; Eisenstein et al. 2023a,b) provides Near-Infrared Camera (NIRCam; Rieke et al. 2023a) and Mid-Infrared Instrument (MIRI; Wright et al. 2023) imaging as well as Near-Infrared Spectrograph (NIRSpec; Böker et al. 2023) spectroscopy. These new data can help to shed light on the nature of FXTs like CDF-S XT1 and XT2 and, by extension, allow us to understand better the overall FXT population, which is especially relevant for the ongoing detections being made by the Einstein Probe Telescope (Yuan et al. 2022).
In this paper, we combine new JWST data with archival data from other telescopes to study the host galaxies of FXTs CDF-S XT1 and XT2. Our main goals are to (re)characterize their host galaxies, refine their distances and energetics, and ultimately revise our interpretations of both FXTs. The paper is organized as follows. Sects. 2 and 3 introduce the JWST data that we are using in this work and the spectral energy distribution (SED) models and packages taken into account for deriving host properties, respectively. In Sect. 4, we explain the methods and results of the Chandra X-ray analysis under the new distances. Finally, in Sects. 5 and 6, we discuss the results and offer some conclusions in light of the nature of these transients, respectively. Throughout the paper, a concordance cosmology with parameters H0 = 70 km s−1 Mpc−1, ΩM = 0.30, and ΩΛ = 0.70 is adopted. Magnitudes are quoted in the AB system. Unless otherwise stated, all errors are quoted at a 1σ confidence level.
2. Data
This work aims to update and improve the host-galaxy characterization for CDF-S XT1 and XT2 (see their X-ray properties in Table 1) using newly available JWST data in conjunction with archival data products and, by extension, refine the properties of the transients themselves. Below, we explain the photometric and spectroscopic data used in this work1.
X-ray properties taken from the literature of the two extragalactic FXTs considered in this work.
2.1. JWST-NIRCam and HST-WFC3/ACS
We consider here the reduced NIRCam imaging data from the public medium and deep tiers of the JADES Origins Field (JOF; Eisenstein et al. 2023a; Bunker et al. 2024; Rieke et al. 2023b; D’Eugenio et al. 2024), and in particular, we incorporate nine JWST filters: F090W, F115W, F150W, F200W, F277W, F335M, F356W, F410M, and F444W. We additionally consider images from the Hubble Legacy Field (HST/ACS F435W, F606W, F775W, and F814W and HST/WFC3 F105W, F125W, F140W, and F160W mosaics; Illingworth et al. 2016; Whitaker et al. 2019), which have been uniformly assessed and assimilated into the JADES photometric catalogs. The JADES JWST images were reduced with the JWST Calibration Pipeline (including some modifications which are explained in detail by Rieke et al. 2023b). They were aligned to the HST F160W image (or F850LP when F160W was lacking), which was itself registered to Gaia DR2 (Gaia Collaboration 2018; Rieke et al. 2023b). Source positions were determined based on the SEP (Barbary 2018) implementation of the SExtractor (Bertin & Arnouts 1996) package, applied to a combination of F150W and F200W images. Given the elongated shapes of both host galaxies, we adopted the Kron photometry derived by JADES, where the Kron radius was established using Photutils (Bradley et al. 2023). Photometry from the HST images was derived in a consistent manner. JADES also provides photometric-redshift estimates for the resulting source catalog using the template-fitting code EAZY (which we use for comparison; Brammer et al. 2008).
The host galaxies of XT1 and XT2 are identified with IDs 180371 and 283332, respectively, in the JADES catalog. For CDF-S XT1, the revised position of its host galaxy is  and
and  , while the host galaxy of CDF-S XT2 is now centered at
  and
and  . Figures 1 and 2 depict a sub-sample of HST and JWST images of the fields of CDF-S XT1 and XT2, respectively. The red circles denote the 1-σ positional uncertainty of the Chandra detections, while the cyan dot represents the host centroid (see Sect. 4 for more details). Tables B.1 and B.2 list the JWST and HST host photometry of XT1 and XT2, respectively.
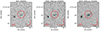 |
Fig. 1. HST and JWST imaging of CDF-S XT1 at three different filters (one per panel) for illustration. The red circle depicts the 2σ X-ray position uncertainty of CDF-S XT1, while the cyan dot shows the position of the host according to JADES. Figure A.1 shows the complete version of this figure. |
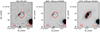 |
Fig. 2. HST and JWST imaging of CDF-S XT2 at three different filters (one per panel) for illustration. The red circle depicts the 2σ X-ray position uncertainty of CDF-S XT1, while the cyan dot shows the position of the host according to JADES. Figure A.2 shows the complete version of this figure. |
2.2. JWST-NIRSpec
Recently, Barrufet et al. (2024) shows the first results from the Cycle-1 JWST-NIRSpec program (#2198, Barrufet & Oesch PIs) that focuses specifically on determining the potential quiescent or dusty nature for a sample of 23 “HST-dark” galaxies, using low-resolution NIRSpec-MSA PRISM spectra (with resolving power of R ∼ 100), covering wavelengths of 0.6−5.3 μm. The host galaxy of CDF-S XT2 turned out to be one of these targets. The observations consist of two NIRSpec pointings (allowing the targeting of 140 galaxies) with three slitlets per target and dithered along the three shutters. Each spectrum thus received a total exposure time of 2451 s. The spectra were reduced and extracted with msaexp2, a JWST NIRSpec MSA data tool. A robust spectroscopic redshift of z = 3.4588 was derived using the msaexp tool (Brammer 2019; Heintz et al. 2024) for the host of CDF-S XT2, which surprisingly contradicts the redshift of z = 0.738 originally reported by Balestra et al. (2010) and quoted by Xue et al. (2019). A detailed discussion surrounding the cause of this large shift appears in Appendix B. Figure 3 shows the NIRSpec spectra of XT2’s host, with the most important emission lines identified. Unfortunately, NIRSpec did not observe the host galaxy of CDF-S XT1. To confirm the reported redshift by Barrufet et al. (2024), we fitted the emission lines Hαλ6563, [Si III]λλ9069,9531, and [He I]λ10,830 using multiple Gaussian functions, and obtained the best-fitting central wavelengths and their associated errors. The derived redshift is zspec = 3.4598 ± 0.0022, consistent with the reported value in the literature (Barrufet et al. 2024).
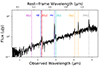 |
Fig. 3. JWST spectrum of the host galaxy of CDF-S XT2 in the observed and rest frames. Dashed vertical lines depict the most important emission lines. According to the emission lines, this galaxy is consistent with a redshift of zspec = 3.4598. |
2.3. JWST-MIRI
JADES provides some redder mid-infrared (MIR) coverage via coordinated parallels with the MIRI instrument, featuring ∼9 arcmin2 with 43 hours of exposure at 7.7 μm and twice that area with 2−6.5 hours of exposure at 12.8 and 15.0 μm. The fields were designed to overlap with some NIRCam mosaics (especially deep MIRI F770W imaging; Eisenstein et al. 2023a,b). That being said, the public MIRI data have not been incorporated into any published catalogs as yet, so we developed our own method to subtract the photometry of the host galaxies. Unfortunately, the MIRI coverage only extends to CDF-S XT2. Using the MAST JWST Search tool2, we download all available public, product level 3 MIRI imaging in the filters F770W, F1280W, and F1500W (#1180, Eisenstein PI). The level 3 data are already calibrated, astrometrically, and photometrically corrected, and finally, combined. An elliptical aperture was defined from the Kron parameters reported by JADES to perform comparable aperture photometry. The ellipse was centered in the XT2’s host position, with semi-major and minor axes of 8 and 5 pixels, respectively, while an empty background region 4″ away was chosen to avoid contamination from the nearby AGN-elliptical galaxy (CANDELS #4210; Santini et al. 2015). The subtraction was done using the package Photutils (Bradley et al. 2023). Table B.2 lists the JWST-MIRI photometry of XT2 host galaxy.
3. Spectral energy distribution fitting
We constrain the host properties of both FXTs through SED fitting of their HST+JWST photometry. We consider a star-formation history (SFH) model described by an exponentially decreasing function (SFH ∝ e−t/τ, which is probably the most commonly applied SFH model; Simha et al. 2014; Carnall et al. 2019) with a timescale parameter defined by the e-folding factor τ3, constructed using the Kroupa initial mass function (IMF; Kroupa & Boily 2002), and including the effects of nebular emission and line strengths through a nebular emission model (using the latest version of the Cloudy photoionization code; Byler et al. 2017; Ferland et al. 2017). Moreover, to model the dust attenuation in the SEDs, we used the theoretical framework developed by Calzetti et al. (2000), where AV is the dust attenuation and is a free parameter. The free parameters of the model and their priors are listed in Table B.3. In the case of CDF-S XT1, due to the fact that we do not know its distance, the redshift (z) is a free parameter determined from the SED fitting. Meanwhile, for CDF-S XT2, the redshift was fixed to the spectroscopic value obtained by the JWST of zspec = 3.4598. The other fitted free parameters are the mass formed (MF)4, age of the galaxy at the time of observation (tage), the SFH e-folding factor τ, dust attenuation (AV, dust), gas ionization parameter (log(U)) and stellar metallicity log(Z/Z⊙) (see Table B.3).
We use two SED fitting packages to derive host properties: (i) Prospector (Leja et al. 2017, 2018; Johnson et al. 2021) and (ii) Bagpipes (Bayesian Analysis of Galaxies for Physical Inference and Parameter EStimation; Carnall et al. 2018, 2019). For fitting the available photometric data, both SED packages use the same set of free parameters and prior distributions (see Table B.3). Moreover, after fitting the SED and constraining the SFH, we derive commonly used physical properties of galaxies to enable direct comparisons with other transients (see Table B.3). For instance, we get the current star formation rate (SFR) using the posteriors on tage, τ, and MF through the equation
 (1)
(1)
We also use the posterior distributions of tage and τ to derive the posterior on the mass-weighted age (tm) in Gyr as
 (2)
(2)
which is more physically meaningful than tage (which simply measures the time at which star formation started). Figure 4 shows the best-fit SED models obtained by Prospector and Bagpipes; both are consistent with the HST+JWST photometric detections and upper limits.
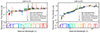 |
Fig. 4. Best-fitting SED models from Bagpipes and Prospector for the hosts associated with CDF-S XT1 (left) and XT2 (right). The photometric data and their 1-σ uncertainties are marked by the blue markers, while the triangle depicts 3-σ upper limits. Moreover, the relative transmission functions of the different filters are in the bottom panels (colored curves). |
Table 2 depicts the host galaxy properties of both FXTs, as well as a comparison with the literature (Bauer et al. 2017; Xue et al. 2019). For each host, we report the median and 68% credible interval of the posteriors in several relevant stellar population properties. Moreover, Fig. 5 shows the cumulative distribution function (CDF) of posteriors of CDF-S XT1 (top panels) and XT2 (bottom panels) obtained by Bagpipes and Prospector. In the case of CDF-S XT1, the ratios between mean values of host parameters such as SFR, stellar mass, and sSFR from Prospector and Bagpipes lie between factors of ≈0.4 and 1.4; some parameters (photometric redshift and stellar mass) match at 68% confidence level (see Fig. 5), while others remain somewhat less consistent. Meanwhile, for CDF-S XT2, the posterior CDFs cover a relatively small region in the parameter space (see Fig. 5), with ratios between Prospector and Bagpipes mean values being ∼0.9 and 1.1; aside from the SFR prediction, the two SED-fitting code CDFs are inconsistent at high confidence. Given the small but significant discrepancies between results, we adopt the mean values from 5000 randomly selected posteriors selected equally from Prospector and Bagpipes. Finally, it is important to mention that the redshifts of both FXTs are consistent with the photometric redshifts reported by JADES using EAZY (Brammer et al. 2008).
Comparison of host parameters obtained from the literature and by our SED fitting using the Bagpipes (Carnall et al. 2018) and Prospector (Leja et al. 2017) packages.
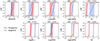 |
Fig. 5. CDFs of the posterior distributions of CDF-S XT1 (top panels) and XT2 (bottom panels) for photometric redshift (just CDF-S XT1), log(M*/M⊙), log(SFR) in M⊙ yr−1, log(sSFR) in yr−1, and AV in mag. The different colors depict the posterior distribution from Prospector (red) or Bagpipes (blue), respectively, while the color regions depict the 68% confidence level. |
4. Revised Chandra X-ray constraints
We recompute the X-ray positions and spectral parameters (which depend on the new redshifts) of CDF-S XT1 and XT2. We reprocess and analyze the data from the two respective ObsIDs where the transients are detected with the CIAO 4.16 software developed by the Chandra X-Ray Center employing CALDB version 4.11.1. We identify all X-ray sources on the ACIS-I detector and determine their positions and associated uncertainties using the CIAO source detection tool wavdetect (Freeman et al. 2002), which employs a series of “Mexican Hat” wavelet functions to account for the varying point spread function (PSF) size across the detector. To improve the Chandra astrometric solution, we cross-match the positions of the X-ray sources with those of their respective counterparts in the JADES catalog (Eisenstein et al. 2023a) located within the Chandra 90% error regions. For this, we use the wcs_match script in CIAO. The astrometrically corrected position for CDF-S XT1 is RA , Dec
, Dec , with a 1σ uncertainty position of
  . Meanwhile, for CDF-S XT2 its position is RA
 , Dec
, Dec , with a 1σ uncertainty position of
  . The quoted uncertainty of both transients considers the X-ray positional errors derived by wavdetect and the alignment dispersion between Chandra observations and the reference catalog.
We extract the spectra with the specextract package in CIAO. For this, we include the X-ray counts within a circular region centered at the X-ray position with a radius corresponding to an encircled energy fraction of ≈98% (R98;  and
and  for CDF-S XT1 and XT2, respectively, and using the method of Vito et al. 2016) given their instrumental off-axis angle (
 and
and  for CDF-S XT1 and XT2, respectively). For the background regions, we consider an annulus region (centered on the transient’s position) with an internal and external radius of R98 and R98 + 20 pixels, respectively5. To obtain the X-ray spectral parameters, we use the Bayesian X-ray Astronomy package (BXA; Buchner et al. 2014), within the fitting environment of XSPEC version 12.14 (Arnaud 1996), and considering the Cash statistic (Cash 1979) to account for the low number of detected counts for the FXTs under study. We fit an absorbed power-law model (phabs*zphabs*pow model in XSPEC) to the binned spectra (requiring at least one photon per bin), where phabs and zphabs describe the Galactic and the combined intrinsic plus host galaxy absorption, respectively. For the extraction of the X-ray spectral parameters, we fix the Galactic hydrogen column density (NH, Gal) to 2.0 × 1020 cm−2 (taken from Kalberla et al. 2005; Kalberla & Haud 2015), while the combined intrinsic plus host galaxy hydrogen column density (NH) is a free parameter in our fit. Redshifts remain fixed parameters in the fitting process, adopting values of 2.76 (mean photometric redshift from Prospector and Bagpipes combined) and 3.4598 (spectroscopic redshift from JWST) for CDF-S XT1 and XT2, respectively. The absorbed fluxes are computed using the standard XSPEC tasks, while the unabsorbed fluxes are derived by the XSPEC convolution model cflux. Figure 6 depicts the best BXA fitted model of both transients (with CDF-S XT1 and XT2 in the top and bottom panels, respectively), while Table 3 represents the best X-ray spectral parameters of both FXTs obtained by the posterior distribution of BXA.
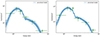 |
Fig. 6. BXA fit of the phabs*zphabs*pow model to the Chandra X-ray data of CDF-S XT1 (left) and XT2 (right), where the darker (lighter) blue-filled bands enclose 68% (98%) of the posterior. The Galactic hydrogen column density and redshift are fixed parameters during the fitting process (see Table 3). |
Results of the 0.5−7 keV X-ray spectral fits for CDF-S XT1 and XT2.
5. Results and interpretations
Below, we report the host-galaxy parameters obtained from the SED fitting, revised X-ray spectral parameters, and possible interpretations to explain the progenitors of CDF-S XT1 and XT2. Finally, we derive the event rate density of both FXTs.
5.1. CDF-S XT1
The serendipitous detection of this FXT by Chandra (ObsID 16454, ≈50 ks exposure) in the CDF-S was first reported by Luo et al. (2014) and analyzed in detail by Bauer et al. (2017). XT1 shows a light curve with a fast rise (with a duration of ≈100 s) followed by a power-law decay (∝t−1.5; Bauer et al. 2017) without a clear spectral evolution. As explained above, we consider HST + JWST data to recompute the parameters of both transients and their host galaxies (see Table 2). Firstly, the random alignment probability of XT1 and the host galaxy is 0.467%, reconfirming an association. The new data improve the photometric redshift from  (Bauer et al. 2017) to
  , refining the peak luminosity (LX, peak) and projected physical offset (δR) of CDF-S XT1 to be LX, peak ≈ 2.8 × 1047 erg s−1 and δR = 1.2 ± 2.4 kpc, respectively. Figure 7 compares the X-ray light curves with other X-ray transients such as SN SBOs (XRF 080109-SN 2008D), X-ray flashes (XRF 060218-SN 2006aj and XRF 100316D-SN 2010bh), GRB afterglows, and jetted TDEs (Swift J1644+57).
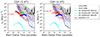 |
Fig. 7. 0.3−10 keV light curves of CDF-S XT1 and XT2 in luminosity units (marked in red). Also shown are the X-ray afterglow light curves of 64 LGRBs plus 32 SGRBs (Bernardini et al. 2012; Lü et al. 2015), as well as several individual transients are overplotted: the shock-breakout supernova XRF 080109-SN 2008D (cyan line, 27 Mpc), the X-ray flashes XRF 060218-SN 2006aj (blue line, 145 Mpc) and XRF 100316D-SN 2010bh (green line, 263 Mpc; Barniol Duran et al. 2015; Starling et al. 2011; Modjaz et al. 2009; Evans et al. 2007, 2009; Soderberg et al. 2008; Campana et al. 2006), and the relativistically beamed TDE Swift J1644+57 (black line, z = 0.3543; Bloom et al. 2011; Levan et al. 2011). The reference time for both FXTs is the arrival time of the first photon to the detector, while for GRBs, Swift J1644+57, and X-ray flashes their reference time are based on their initial gamma-ray detections. |
The source position of CDF-S XT1 was serendipitously observed ≈80 minutes after the X-ray trigger by the VIsible MultiObject Spectrograph (VIMOS) instrument mounted in the VLT (Bauer et al. 2017), but no contemporaneous optical transient was detected at the location of the CDF-S XT1 (MR > −21.1 mag). This field was imaged on three subsequent occasions, by VLT/FORS2, Gemini-South/GMOS-S, and HST/WFC3 at ≈18, 27, and 111 days after the X-ray trigger, respectively, with no counterpart detection to MR > −19.8, −20.8, and −18.0 (or −17.4) mag6, respectively. Finally, the Australian Telescope Compact Array (ATCA), using five different frequencies (2.1, 5, 9, 17, and 19 GHz), observed the source position ≈7 days after the X-ray onset, all resulting in non-detections (Lν ≲ 4 × 1031 − 1032 erg s−1 Hz−1; Bauer et al. 2017). Unfortunately, the gamma-ray instruments Swift-BAT and Fermi were not covering the position of CDF-S XT1 during the transient trigger. However, the field was covered by the Interplanetary Network, with no counterpart detected (peak flux upper limit of 1.4 × 10⁻⁷ erg cm−2 s−1 in the energy range 25 − 150 keV; Bauer et al. 2017), i.e., an upper limit of Lγ, peak < 4.8 × 1052 erg s−1 (at z = 2.76) in the energy range of 1 − 104 keV7.
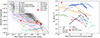 |
Fig. 8. Left: R-band optical light curves of CDF-S XT1 (red) compared to long and short GRBs (Kann et al. 2006, 2010, 2011; Nicuesa Guelbenzu et al. 2012), the SBO SN 2008D (Soderberg et al. 2008), the low-luminosity events XRF 060218-SN 2006aj and XRF 100316D-SN 2010BH, the relativistic Ic-BL SN 2018gep (Ho et al. 2019), LFBOT AT2018cow (Xiang et al. 2021), and Type II-pec SN 1987A (50 kpc), SN 1999br (7.1 Mpc) and Type II-P SN 2005cs (8.6 Mpc). The HST F110W constraint at 111 days is displayed for the range mR − mF110W ≈ 0.4 − 1.0 mag typical of GRBs (Kann et al. 2006, 2010, 2011). Right: 9 GHz upper limit of CDF-S XT1 (red) compared to low-frequency (1−10 GHz) light curves of different classes of energetic explosions such as TDEs (Zauderer et al. 2011, 2013; Berger et al. 2012; Alexander et al. 2016; Eftekhari et al. 2018), SNe exploding in dense circumstellar medium (Soderberg et al. 2005; Salas et al. 2013) and normal SNe (Weiler et al. 1986), relativistic Ic-BL SNe (Kulkarni et al. 1998; Soderberg et al. 2010), LGRBs (GRB 030329A, GRB 111209A, and GRB 130427A; Berger et al. 2003; Hancock et al. 2012; Perley et al. 2014; van der Horst et al. 2014), and luminous fast blue optical objects (LFBOTs; Margutti et al. 2019; Coppejans et al. 2020; Ho et al. 2020a). |
Inside the CDF-S XT1 error position, an extended source is located with an absolute magnitude of MR = −19.14 mag considering a redshift of z = 2.76. At this distance, the angular half-light radius of  (defined from the JWST F200W image using Sextractor; Bertin & Arnouts 1996) converts to a projected half-light radius of ∼1.1 kpc. The luminosity-size relation of the XT1 host shows that the galaxy is not consistent with dwarf galaxies and globular clusters (see for instance, Taylor et al. 2018; Simon 2019). The best-fitted host-galaxy parameters of CDF-S XT1 are
  ,
,  and
and  , which permit the classification of the host as a star-forming galaxy based on its location relative to regarding the galaxy main sequence (Santini et al. 2017), and following the standard star-forming scheme classification of Tacchella et al. (2022). A comparison between host-galaxy properties of different transients and both FXTs is presented in Fig. 9. Below, we analyze the potential scenarios associated with CDF-S XT1.
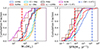 |
Fig. 9. Comparison of the host-galaxy properties of CDF-S XT1 and XT2 with the cumulative distributions of galaxy stellar mass (left panel) and star-formation rate (right panel) for LGRBs (Li et al. 2016; Blanchard et al. 2016), SGRBs (Fong et al. 2010, 2012, 2014; Margutti et al. 2012; Sakamoto et al. 2013; Berger et al. 2013; Fong et al. 2022; Nugent et al. 2022), FRBs (Heintz et al. 2020), CC-SNe and Ia-SNe (Tsvetkov & Bartunov 1993; Prieto et al. 2008; Galbany et al. 2014), low-luminosity LGRBs (GRB 980425, GRB 020903, GRB 030329, GRB 031203, GRB 050826, GRB 060218, GRB 100316D, GRB 111005A, and GRB 171205A; Christensen et al. 2008; Michałowski et al. 2014; Levesque 2014; Krühler et al. 2017; Wiersema et al. 2007; Izzo et al. 2017; Wang et al. 2018; MichałowskI et al. 2018; Arabsalmani et al. 2019), and SLSNe (Schulze et al. 2021). The dashed vertical lines depict the mean values of CDF-S XT1 (red vertical lines) and XT2 (blue vertical lines). |
5.1.1. CDF-S XT1: SN SBO scenario
One possible scenario is that the X-ray burst could be related to an SN SBO, such as the most studied SBO XRF 080109 (serendipitously discovered during Swift-XRT observations of SN 2007uy in NGC 2770; Soderberg et al. 2008). This was initially rejected by Bauer et al. (2017) because the optical/NIR constraints excluded a substantial portion of SN phase space. With the revised redshift, the peak luminosity of CDF-S XT1 now appears to be ≈3−4 dex higher than XRF 080109 (with LX, peak ∼ 1043 erg s−1, see Fig. 7) and the SBO theoretical limits (LX, peak ≈ 1042 − 1044 erg s−1; Waxman & Katz 2017; Goldberg et al. 2022), allowing us to discard SBOs as a potential progenitor of XT1 more conclusively.
5.1.2. CDF-S XT1: standard GRB afterglow scenario
Another scenario for CDF-S XT1 is associated with the X-ray afterglow of a GRB. The Swift and Fermi satellites did not cover the area of CDF-S XT1 at the time of the burst (Bauer et al. 2017, and reference inside). However, the field was covered by the Interplanetary Network, with no counterpart detected (Bauer et al. 2017), excluding any association with a strong GRB but still allowing for faint GRBs or orphan afterglows (Ghirlanda et al. 2015). Figure 7 compares CDF-S XT1 and the X-ray afterglows of on-axis short and long GRBs (SGRBs and LGRBs, hereafter; Evans et al. 2007, 2009; Bernardini et al. 2012; Lü et al. 2015). It is clear that CDF-S XT1’s luminosities lie well below the range of afterglows for normal LGRBs and near the lower bound of known SGRBs. Although the decay rate after the peak matches those of normal X-ray afterglows ( ; Zhang et al. 2006; Evans et al. 2009; Racusin et al. 2009), XT1’s initial fast rise phase is not consistent with the typical X-ray afterglows of on-axis GRBs observed at such early times. In Fig. 8 (left panel), we compare R-band light curves derived from a database of optical measurements of ∼160 GRBs with known redshifts (Kann et al. 2006, 2010, 2011; Nicuesa Guelbenzu et al. 2012), nearby SNe (SN 1987A, SN 1999br, and SN 2005cs), low-luminous events XRF 060218-SN 2006aj and 100316D-SN 2010BH, the SN SBO SN 2008D-XRF 080109, the relativistic Ic-BL SN 2018gep, the luminous fast blue optical objects (LFBOTs) AT2018cow, and the optical upper limits of CDF-S XT1. These upper limits are inconsistent with the majority of long GRBs (consistency remains only with a few long GRBs at z ≲ 0.2), especially the earliest upper limit (≈80 min. after the X-ray trigger). Similarly, only a small fraction of short GRB afterglows appear consistent with the upper limits. The strong X-ray and optical limits in combination with the deep gamma-ray upper limit from the Interplanetary Network disfavors a typical on-axis GRB scenario. The lack of a gamma-ray counterpart opens the possibility of off-axis GRBs, which might be accompanied by a weak optical emission (Lazzati et al. 2017). We will explore the off-axis scenario in more detail. Finally, Fig. 8 (right panel) shows the 9 GHz upper limit for XT1 compared with other transients. The weak limit fails to exclude any of the objects shown, leaving the nature of XT1 at radio wavelengths largely unconstrained.
One consideration is that the rising and decaying phases of XT1 could mimic an X-ray flaring episode, which has been seen in some afterglows (Chincarini et al. 2007, 2010; Margutti et al. 2011). To compare the pulse shape of XT1 with the X-ray flaring episodes in GRBs’ afterglows, we fitted a fast rise exponential decay function (see Norris et al. 2005, for more details) to the light curve of CDF-S XT1 (in counts rate units and a time bin of 50 s to be consistent with Chincarini et al. 2010), and derived the observed width of the pulse (w ≈ 320 s) and its peak time (τpeak ≈ 100 s). The peak time and the width of CDF-S XT1 remain marginally consistent with GRB flares (Chincarini et al. 2007, 2010), although the spectral slope and decay time slope lie on the hard and slow ends of their respective distributions (Chincarini et al. 2007, 2010). The ratio log(w/τpeak) of CDF-S XT1 lies outside the expected transition for GRBs (see Chincarini et al. 2010, Fig. 3), with similar inconsistencies identified in the LX, peak − τpeak and LX, peak − w relations (Chincarini et al. 2010). Finally, the total duration of XT1 is longer than GRB X-ray flares (i.e., ∼10−300 s). Thus, the GRB flaring episode afterglow scenario is not considered viable.
Based on the rise and decay light curve of the transient, an additional possibility related to the on-axis scenario is an early afterglow emission caused by the deceleration of a GRB jet (e.g., Sari 1999; Molinari et al. 2007), where the early afterglow might peak on a time-scale similar to the deceleration time of the jet (tdec; Sari 1999)8. To explore this scenario, we assume that CDF-S XT1 does not have any contribution from the low-energy tail of the prompt emission of any potentially associated GRB (e.g., due to the long-lasting central engine activity; Ghisellini et al. 2007; Genet et al. 2007; Ioka et al. 2006; Toma et al. 2006; Panaitescu 2008; Nardini et al. 2010) or any flaring episodes caused by the late-time central engine (Margutti et al. 2010; Ghirlanda et al. 2018). We compute the deceleration time of the jet (using the formalism of Sari 1999; Ghirlanda et al. 2018; Zhang 2018), considering that the deceleration is caused by the interaction of the jet with the interstellar medium (ISM9; see Appendix A for more details about the methodology). We assume typical values for the kinetic energy (Ek ∼ 1050 − 1053 erg) and the initial Lorentz factor (Γ0 ∼ 50 − 1000) of GRBs, and a number density of the ISM of n ∼ 10−2 − 10 cm−3 to cover the entire parameter space of GRBs. If the origin of CDF-S XT1 is related to the early afterglow, we expect that the deceleration time should be similar to the peak time of the transient (Sari 1999), i.e., tdec = tX, peak ≈ 110 s Figure A.3 shows the deceleration time covering a wide parameter space of Γ0 and Ek, where we found that tdec ≈ tX, peak in the range Γ0 ≈ 60 − 600. Under the condition n ≤ 1 cm−3, we obtain Γ0 ≳ 100, which is consistent with the distribution of Lorentz factors of normal GRBs (e.g., Racusin et al. 2011; Ghirlanda et al. 2018); however, at n > 1 cm−3, the early afterglow interpretation favors a lower Lorentz factor Γ0 ≈ 70 − 200. This Lorentz factor range is covered by standard GRBs, which can be excluded based on the gamma-ray upper limit obtained by Konus Wind (i.e., Fγ, peak < 1.4 × 10⁻⁷ erg s−1 cm−2, in the range 25−150 keV; Tsvetkova et al. 2017), leaving this scenario as an unlikely possibility, and favoring other possibilities such as faint GRBs and/or off-axis GRBs.
Next, we consider an association with off-axis GRBs (e.g., Granot et al. 2002; Ryan et al. 2020; Perley et al. 2025). The early rise phase of CDF-S XT1 lasts ∼100 s, which a slightly off-axis afterglow could explain; note that the short duration and observed luminosity of XT1 immediately rule out comparisons to higher off-axis angles (hence longer rise) scenarios such as GRB 170817A- or SN 2020bvc-like events (e.g., Nynka et al. 2018; D’Avanzo et al. 2018; Troja et al. 2020, 2022; Izzo et al. 2020). Notably, XT1’s decay rate is comparable to the normal decay of GRBs. Sarin et al. (2021) suggested an association of an X-ray afterglow produced by a relativistic structured jet viewed off-axis with a viewing angle of θobs ≈ 10 deg and an ultra-relativistic jet core of θcore ≈ 4.4 deg, explaining the early and later optical limits. On the other hand, Wichern et al. (2024), using off-axis uniform and Gaussian-structured jet afterglow models from Ryan et al. (2020), explored the link between FXTs and the afterglows of off-axis merger-induced GRBs. They found that in the particular case of CDF-S XT1, the early and high peak X-ray luminosity of CDF-S XT1 are consistent with a relatively on-axis viewing angle, while the deep optical upper limits imply a highly off-axis viewing angle, leading them to conclude that the overall properties of CDF-S XT1 are not self-consistent with any off-axis scenario for a normal merger-induced GRB. Unfortunately, our host galaxy SED-fitting constraints do not shed much additional light on the nature of XT1. Although the moderate SFR is consistent with LGRB and SGRB hosts, its low stellar mass lies at the lower bounds (≲10 and 5% of LGRBs and SGRBs, respectively; having lower stellar masses; see Fig. 9). As the reader can appreciate, this scenario cannot be completely excluded.
Finally, we consider a dirty fireball scenario, which describes GRBs with a higher baryon load (a proton content as small as ≳10−4 M⊙; Cenko et al. 2013) than typical events. Here, the fireball accelerates more slowly due to the greater inertia of the baryons, producing a low initial Lorentz factor Γ0 ≪ 100 (Dermer et al. 1999; Huang et al. 2002). This model predicts afterglow emission, but inhibits any high-energy emission via e− − e+ pair production (Dermer et al. 1999; Huang et al. 2002; Rhoads 2003; Ghirlanda et al. 2012). For instance, the transients PTF11agg, AT 2019pim, and AT 2021any (without gamma-ray counterparts; Cenko et al. 2013; Xu et al. 2023; Perley et al. 2025) can be explained by a dirty fireball model considering lower Lorentz factors of Γ0 ∼ 10 − 50. The light curve of a dirty fireball will take longer to rise to a peak, being set by the time it takes the shock to sweep up the material (i.e., the deceleration time; Ho et al. 2020b). For a uniform-density medium (assuming n ∼ 1, 10, and 30 cm−3), using Eq. (A.1), no outflow (with a kinetic energy of EK ∼ 1049 − 1054 erg) with Γ0 ≲ 40 can produce an afterglow that rises to a peak on a time scale similar to the peak time of CDF-S XT1. Thus, we conclude that this scenario does not adequately explain the timing properties of XT1.
5.1.3. CDF-S XT1: TDE scenario
Given that the decay time slope of CDF-S XT1 appears fully consistent with the predictions for TDEs (i.e., ∝t−5/3; Rees 1988; Phinney 1989; Burrows et al. 2011), a comparison to this class of transient is warranted. However, the high peak luminosity reached by XT1 implies that only a jetted TDE scenario remains possible.
In the case of an SMBH-TDE, we note that SwJ1644+57 reaches comparable luminosities to XT1 at multiple points in its light curve (see Fig. 7; Bloom et al. 2011; Levan et al. 2011), and presents a radio luminosity (Berger et al. 2012) consistent with the radio upper limits of XT1 (see Fig. 8, right panel). However, the fast rise time, hard X-ray flux, lack of strong variability, and overall duration of CDF-S XT1 remain strongly inconsistent with the few known jetted SMBH-TDEs, leading us to exclude this scenario.
Considering instead a jetted WD-IMBH TDE, this could potentially explain not only the high luminosity but also the fast rise to the peak (≈minutes) and duration of XT1 (Krolik & Piran 2011; Haas et al. 2012; Kawana et al. 2018). We explored this scenario by adopting a simple model developed by Peng et al. (2019). Once the tidal forces disrupt the WD, the bound debris stream falls back to the disruption site (fallback timescale, tfb). However, the returned debris stream is not immediately digested by the BH, as some time is required to form an accretion disk and swirl inward until it reaches the IMBH (accretion timescale, tacc). The fast rise of CDF-S XT1 can then be explained in terms of short fallback and accretion timescales of ∼30 and 70 s, respectively. The low tfb implies a relatively heavy and compact WD. Assuming a WD mass of MWD = 1.4 M⊙ (and using Eq. (5) of Peng et al. 2019), the BH mass should be MBH ∼ 6 × 10² M⊙. However, the thermal accretion disk emission would be limited by the Eddington luminosity, producing an X-ray luminosity of ∼1042 − 1044 erg s−1, which is ≳3 dex below the peak luminosity of CDF-S XT1. Nevertheless, many of WD-IMBH TDE systems are also predicted to launch relativistic jets (Strubbe & Quataert 2009; Zauderer et al. 2011; De Colle et al. 2012), powered by rapid IMBH spin (which has been estimated in some IMBH candidates, e.g., Wen et al. 2021; Cao et al. 2023) and high magnetic flux (e.g., from a magnetic WD; Cenko et al. 2012; Brown et al. 2015; Sądowski et al. 2016) via the Blandford & Znajek (1977) mechanism. For instance, MacLeod et al. (2016) shows typical peak jet luminosities between∼1047 − 1050 erg s−1 and rise timescales of ∼102 − 104 s, matching with CDF-S XT1. Furthermore, the early VIMOS-VLT R-band and radio upper limits are consistent with the expected thermonuclear emission of IMBH TDE and the radio afterglow, respectively (see Figs. 4 and 12 of MacLeod et al. 2016).
In terms of host-galaxy properties, WD-IMBH TDEs are predicted to occur in irregular dwarf galaxies, globular clusters, and hyper-compact stellar clusters (e.g., Merritt et al. 2009; Jonker et al. 2012; Reines et al. 2013), resulting in substantial offsets from the center of their host galaxy. While the host galaxy of XT1 appears consistent with irregular dwarf galaxies, the large positional uncertainty does not permit confirmation of any physical offset. Overall, a jetted WD-IMBH TDE remains plausible to explain the X-ray light curve shape, duration, and luminosity, the multiwavelength early upper limits, and the host properties of CDF-S XT1.
5.1.4. CDF-S XT1: proto-magnetar scenario
This scenario has been explored previously for CDF-S XT1 (e.g., Sun et al. 2019; Quirola-Vásquez et al. 2024), using the mean photometric redshift reported by Bauer et al. (2017) of ≈2.23. This model assumed that after a BNS merger, a massive magnetar could be formed (Zhang & Mészáros 2001), emitting isotropic X-ray emission by the internal dissipation of the magnetar wind with a characteristic spin-down luminosity (e.g., Metzger & Piro 2014). For relatively on-axis viewing angles, an observer may detect this magnetar X-ray emission as a plateau superimposed with the expected on-axis gamma-rays and/or short GRB afterglow (e.g., Rowlinson et al. 2010, 2013; Lü et al. 2015; Gompertz et al. 2014). However, in directions far from the SGRB jet, it may be possible to observe directly the more isotropic X-ray magnetar emission or a version obscured by the neutron-rich ejecta material residing around the remnant (for more details see Yu et al. 2013; Sun et al. 2017; Quirola-Vásquez et al. 2024). The last case has been proposed to explain CDF-S XT1, wherein the X-ray luminosity of CDF-S XT1 is produced by a magnetar (characterized by a magnetic field, Bp, and an initial rotational period, Pi), while the initial fast rise is a consequence of time-dependent obscuration produced by the expanding neutron-rich ejecta material (characterized by the mass of the ejecta, Mej, and its opacity, κ).
We explore this scenario using the new redshift-corrected X-ray light curve of XT1, considering the formalism of Quirola-Vásquez et al. (2024, and references within). The derived magnetar properties (Bp ≈ 3.2 × 10¹⁵ G and Pi ≈ 0.7 − 2.0 ms) and ejecta (Mej ≈ 10−4 M⊙ and κ ≈ 1 cm2 g−1) are consistent with previous works (Lü et al. 2019; Quirola-Vásquez et al. 2024). However, it is important to realize that Pi is close to the ∼1.0 ms breakup limit of rotating neutron stars (Lattimer & Prakash 2004), and could trigger the disruption of the massive magnetar. Nevertheless, this limit is unclear because it depends on several poorly-constrained neutron star parameters such as the equation-of-state and loss-energy mechanism (e.g., Lin et al. 2020). Finally, the low stellar mass of the host of XT1 is uncommon among SGRBs, with just < 5% of SGRB hosts having equal or lower stellar masses (see Fig. 9). As such, this scenario for CDF-S XT1 remains viable.
5.1.5. CDF-S XT1: low-luminousity LGRB scenario
Another scenario considered to explain FXTs is low-luminosity (LL)-LGRBs, which are typically characterized by longer durations, lower energetics, and lower collimation levels. LL-LGRBs are thought to differ from normal LGRBs due to their partial or complete inability to launch a successful jet (Wang et al. 2007; Bromberg et al. 2011; Nakar & Sari 2012). Two notable examples of LL-LGRBs are XRF 060218 (z = 0.033; Pian et al. 2006; Campana et al. 2006) and XRF 100316D (z = 0.0591; Starling et al. 2011), which both have similar peak luminosities to CDF-S XT1 (see Fig. 7). However, the light curve of XT1 has a different shape, especially during the fast-rise phase. Some explanations for XRFs suggest that they may be related to shock breakout from choked GRB jets (Campana et al. 2006; Bromberg et al. 2012; Nakar & Sari 2012; Irwin & Chevalier 2016), which produce lower-energy emission (fainter by about four orders of magnitude compared to typical LGRBs, i.e., 1046 − 1048 erg s−1; Nakar 2015), which, at high redshift, could mean a fainter or absent of γ-ray signal. The lack of a γ-ray counterpart of CDF-S XT1 is consistent with this idea, while the radio upper limits of XT1 remain compatible with the radio luminosity of XRF 060218 and XRF 100316D (see Margutti et al. 2013a, Fig. 3).
Regarding the X-ray evolution, XRF 060218 and XRF 100316D show significant X-ray soft thermal components (kT ∼ 0.1 − 0.2 keV), which cool, and in the case of XRF 060218 also shifts into the optical/UV band at later epochs (Campana et al. 2006; Starling et al. 2011; Barniol Duran et al. 2015). This behavior is usually interpreted as the break out of a shock driven by a mildly relativistic shell into the dense wind surrounding the progenitor star (Campana et al. 2006). However, CDF-S XT1 does not show a softening trend in the X-ray spectra, although this could result from the low number of counts in the FXT rather than intrinsic differences. Furthermore, both XRF 060218 and XRF 100316D were associated with supernovae days later (called SN 2006aj and SN 2010bh, respectively), which also are consistent with the optical upper limits of CDF-S XT1 (see Fig. 8, left panel). The low stellar mass and moderate SFR of XT1’s host galaxy are consistent with the host properties of LL-LGRBs (see Fig. 9). Overall, an origin related to LL-LGRB, and thus with massive stars, remains plausible for CDF-S XT1.
5.2. CDF-S XT2
This X-ray transient was also detected serendipitously by Chandra (ObsID 16453, ≈70 ks observation) in the CDF-S field, identified by Zheng et al. (2017) and studied in detail by Xue et al. (2019). This FXT shows a light curve with a ≈2 ks plateau phase followed by a power-law decay (∝t−2; Xue et al. 2019), as well as a mild spectral softening evolution (the photon indices before and after the end of the plateau are Γbefore = 1.40 ± 0.36 and  , respectively, at 90% confidence level10). This FXT was in the field-of-view (FoV) of Fermi-GBM for ∼1000 s around the FXT detection time, but no γ-ray counterpart was found (Xue et al. 2019). Unfortunately, the field was not observed by optical and NIR instruments on dates around the X-ray detection. A host galaxy was identified by Xue et al. (2019) with an apparent magnitude of mF160W ≈ 24 AB mag11, with a random match probability of only ≈1%. In light of the new JWST data, which includes a revised redshift, we recompute all relevant FXT and host-galaxy parameters below.
5.2.1. New spectroscopic redshift, energetics, and host properties
As we explain in Sect. 2.2, the host galaxy of CDF-S XT2 was observed by JWST-NIRSpec, resulting in the identification of numerous emission lines and a robust spectroscopic redshift of zspec = 3.4598 (see Fig. 3). Although the JWST-NIRSpec spectrum by itself is irrefutable proof of the new redshift for the host galaxy, it is important to understand the nature of the previous misidentification. Interested readers can find a forensic assessment and detailed investigation into the origin of the redshift discrepancy in Appendix B. We summarize the most salient details below.
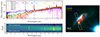 |
Fig. 10. JWST-NIRSpec 2D and 1D spectra per pixel of the host galaxy of CDF-S XT2. Top-left panel: Single-pixel row-extraction spectra through resolved spatial regions of the XT2 host galaxy. Bottom-left panel: 2D spectra in pixel units of the host galaxy of CDF-S XT2. Horizontal dashed lines depict the pixel positions of the single row-extraction spectra shown in the top-left panel. The 2D is compared to the right panel (North is up). Right panel: RGB (F090W, F200W, and F444W) image of the host of CDF-S XT2, identical in size to Fig. 2, indicating the NIRSpec slit position. The magenta rectangle denotes the region of dispersed spectra shown in the bottom-left panel, while the white rectangles are regions to assess the background and the red circle depicts 1-σ X-ray positional uncertainty of CDF-S XT2. |
A “robust” spectroscopic redshift of z = 0.7382 for the host galaxy of CDF-S XT2 was first reported by Balestra et al. (2010), based on VLT-VIMOS observations taken on 2004-11-17 (Cesarsky PI), which was subsequently adopted in Xue et al. (2019) and thereafter. However, no emission lines appear in a spectral extraction of more recent VLT-Multi Unit Spectroscopic Explorer (MUSE) data (Wisotzki PI; Inami et al. 2017; Herenz et al. 2017) at the position of XT2’s host between 4500−9500 Å (see Fig. B.2, as well as Appendix B for further technical details), despite similar sensitivities. This, in conjunction with the new high-quality, spatially resolved JWST spectra, suggests that the initial VLT-VIMOS spectral extraction was contaminated by the primary target in the slit mask, an X-ray AGN (CANDELS #4210) in an elliptical galaxy at z = 0.7396, lying  to the southwest. Notably, the non-detection of the XT2 host in VLT-VIMOS U-band imaging (see Fig. A.2) can be interpreted as a drop-out beyond the Lyman limit, consistent with zspec = 3.4598. The Lyman-α line is not identified in the MUSE spectra (the MUSE spectrum of XT2 host and the collapsed image of the Ly-α emission line are shown in Figs. B.1 and B.2, respectively). Unfortunately, the available Spitzer-InfraRed Array Camera (IRAC) imaging between 3.6 and 8.0 μm is not sufficiently informative due to the strong blending between the bright emission from the host of XT2 and the nearby AGN CANDELS #4210 (IRAC has a pixel scale of
  pix−1; Fazio et al. 2004).
Adopting this new spectroscopic redshift, the peak luminosity and projected physical offset of CDF-S XT2 are LX, peak ≈ 1.4 × 1047 erg s−1 and δR = 0.96 ± 2.13 kpc, respectively. The former has increased by a factor of ∼45 compared to the value reported by Xue et al. (2019), while the latter is now consistent with arising from the central, obscured portion of the complex host galaxy (see Figs. 2 and A.2). On the other hand, the random match probability between CDF-S XT2 and its host is 0.091%. The new host galaxy parameters of CDF-S XT2 are  ,
,  and
and  , indicating that it is a powerful, obscured star-forming galaxy. Compared with the previous values (Santini et al. 2015; Xue et al. 2019), the stellar mass and SFR have increased by factors of ∼45 and 200, respectively. Comparisons of the X-ray light curves and host-galaxy properties between XT2 and several different transients are depicted in Figs. 7 and 9, respectively. Below, we first examine the unique properties of the host and then explore potential progenitor scenarios for CDF-S XT2 based on the X-ray and host properties. Notably, the association of XT2 with a dust-obscured, strongly star-forming galaxy lends support to progenitor channels involving massive stars. This is also indirectly supported by the high intrinsic hydrogen column density from X-ray data, which implies a high extinction of
  mag (considering a SMC-like environment).
5.2.2. One or two galaxies
Figure A.2 highlights the strong color gradient observed across the host of CDF-S XT2, as well as the clumpy nature of newly detected emission probed by the NIR-MIR bands of JWST. Figure 10 (left panel) shows the 2D dispersed spectra across this color gradient (approximately consistent with the galaxy minor axis), along with a comparison of the 1D single-row extracted spectra of this spatially resolved region. It is clear from both the individual HST, NIRCam, and MIRI filter image cutouts and the spatially-resolved spectra that the host galaxy exhibits a diverse distribution of stellar populations and/or variable dust extinction. In particular, the single-row spectra reveal two fairly distinct components, one bluer (spectra for pixels 13 and 14) and another redder (spectra for pixels 15–17). However, it is clear that both components exhibit the same emission lines at ≳2 μm (the redder component does not show a robust [OII] line), i.e., even though both components might arise from different stellar populations, they share a common redshift. We do not see any unidentified emission lines, implying galaxies at two distinct redshifts. The R ∼ 100 spectral resolution of the NIRSpec data does not provide strong constraints (≲2500 km s−1 for Hα) on differences between nearby overlapping galaxies or expected galaxy-scale velocity gradients, which might provide additional insight into the dynamical evolution of the host. Considering the overall morphology of the host, we can now reinterpret the bluer (HST) filters, where only one side appears and the emission appears clumpy. In the NIR-MIR filters from JWST, on the other hand, the host takes on a somewhat more symmetrical form, albeit also with stronger clumps. The fact that an unambiguous galaxy core in MIRI images at JWST suggests that both components belong to the same obscured galaxy. We calculate an offset of  (i.e., ∼2 kpc) between the blue and red star-forming components, which also have been seen in other high-redshift dusty galaxies such as GN20 (Carilli et al. 2011; Hodge et al. 2015; Colina et al. 2023) and A2744-ID02 (Kokorev et al. 2023). These offsets are often interpreted as the result of gravitational encounters or mergers, although that interpretation is not ironclad.
To demonstrate the different stellar properties of both components, we carry out SED fitting (using Bagpipes) on the JWST single-row spectra from pixels 13 to 17 (the same as Fig. 10) considering the same SFH model and parameters as Table B.3. Figure 11 shows the derived SFR, stellar mass and mass-weighted age, and dust attenuation obtained per JWST single-pixel spectra with 99.9% confidence uncertainties. We observe strong gradients in the parameters – i.e., the SFR, stellar mass, and dust attenuation evolve from lower values in the bluer component to higher for the redder component – although the errors (at > 99.9% confidence) on the individual measurements remain large, due in part to the limited wavelength coverage of the spectra. The variations in both AV and stellar mass are significant, implying that the host galaxy SFR and stellar population age remain relatively consistent across the minor axis, and that the strong color gradient is likely driven by inhomogeneous dust attenuation and a possible clumpy stellar mass distribution12. The AV attenuation in the red component is comparable with the high attenuation in other HST and JWST-dark or optically faint and dark galaxies (Wang et al. 2019; Smail et al. 2021; Jin et al. 2022; Xiao et al. 2023; Barrufet et al. 2024).
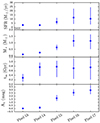 |
Fig. 11. JWST single-pixel spectral parameters obtained by our SED fitting using the Bagpipes package (Carnall et al. 2018, 2019) from pixel 13 to pixel 17 assuming the SED model from Table B.3. The figure depicts the star-formation rate (top panel), stellar mass (2nd panel, in units of 1010 M⊙), mass-weighted age (third panel), and dust attenuation (bottom panel) per pixel. The uncertainties were computed from the posterior distributions at a 99.9% confidence level. |
5.2.3. CDF-S XT2: SN SBO scenario
Similar to CDF-S XT1, the peak X-ray luminosity inferred for XT2 in this work is LX, peak ∼ 1047 erg s−1. Its peak luminosity is ≈4 order of magnitudes higher than the expected for SBOs (Waxman & Katz 2017; Goldberg et al. 2022) and the well-known SBO XRF 080109-SN 2008D (LX, peak ∼ 1043 erg s−1, see Fig. 7; Soderberg et al. 2008). As such, we rule out the SBO progenitor scenario.
5.2.4. CDF-S XT2: GRB afterglow scenario
Several LGRBs (e.g., Lyons et al. 2010; Beniamini et al. 2020) and SGRBs (e.g., Rowlinson et al. 2010, 2013; Gompertz et al. 2014) show a plateau in their X-ray afterglow. However, only < 10% have plateau luminosities ≲1047 erg s−1 (consistent with CDF-S XT2). Some authors claim that the plateau origin is related to some engine activity, which we discuss below. The power-law decay after the plateau remains crudely consistent with the expected X-ray afterglow of GRBs (∝t−1.2; Evans et al. 2009), while the spectral softening in XT2 also has been seen in some GRB afterglows (e.g., GRB 130925A; Zhao & Shao 2014).
It is important to discuss here the implications of the gamma-ray upper limits as they relate to an on-axis scenario. Xue et al. (2019) was unable to find any significant source-like gamma-ray emission signal above the background in the Fermi-GBM instrument (using the detectors n4, n5, and b0) around the X-ray trigger, with a 1 − 104 keV peak flux upper limit of ≈6 × 10⁻⁷ erg cm−2 s−1. In light of the new redshift, this implies an isotropic rest-frame peak luminosity of < 1.7 × 1052 erg s−1. This upper limit lies near the ≈25 percentile of the distribution of isotropic peak luminosities for a sample of 150 GRBs (spanning a range of 0.1 < z < 5, including 12 short-hard bursts) detected by Konus-Wind (Tsvetkova et al. 2017), suggesting a potential association with that population. However, if we consider only the GRBs with similar redshifts (i.e., 12 GRBs with z > 3), our gamma-ray upper limit lies well outside the distribution, but it could be an observational bias. Similarly, comparing the gamma-ray upper limit and the X-ray luminosity with GRBs (e.g., D’Avanzo et al. 2012; Rossi et al. 2022), we identify that both parameters are consistent with moderate to low-luminous GRBs. This, along with the lack of a gamma-ray detection (Xue et al. 2019; Quirola-Vásquez et al. 2023) appears poorly consistent with the bright on-axis afterglow scenario. Although it is not possible to discard this scenario completely, we believe it unlikely, leaving us to consider more likely an off-axis one and low-luminous GRBs. On the other hand, the relatively high luminosity and plateau duration of XT2 effectively exclude high off-axis afterglows such as LGRB SN 2020bvc (with viewing angle θobs ≈ 23 deg; Izzo et al. 2020), and SGRB GRB 170817A (with viewing angle θobs ≈ 23 deg; Nynka et al. 2018; D’Avanzo et al. 2018; Troja et al. 2020, 2022), both of which are substantially fainter (LX, peak ≈ 3 × 1041 erg s−1) than CDF-S XT2. Recently, Wichern et al. (2024) explored an association between FXTs and off-axis SGRB afterglows and concluded that it is difficult to reproduce the luminosity, temporal indices, and durations of FXTs in the off-axis SGRB afterglow interpretation in a self-consistent way (i.e., at the same viewing angle), with the closest fits arising from only slightly off-axis angle models. A mildly off-axis LGRB scenario remains an open possibility to explore, especially given the high star-formation rate of its host galaxy, which reinforces a collapsar origin (over a merger one).
5.2.5. CDF-S XT2: TDE scenario
Another potential progenitor channel is TDEs. Based on arguments similar to those of the XT1 case (i.e., luminosity, event duration, and lack of variability), we discard scenarios involving normal and jetted SMBH-TDEs. In the case of WD-IMBH TDEs, the simple model developed by Peng et al. (2019) can mimic the XT2 light curve for fallback and accretion timescale parameters of ∼2 and 500 s, respectively. However, the high luminosity remains impossible to explain with a thermal accretion model. Thus, the only viable option is a jetted WD-IMBH TDE, which can potentially accommodate the high luminosity (MacLeod et al. 2014, 2016). Unfortunately, the lack of contemporaneous multiwavelength constraints does not permit us to explore this channel in more detail. One point against a jetted WD-IMBH TDE is the properties of XT2’s host, which implies a link to massive stars. In contrast, WDs require considerable time to form and gravitationally couple with IMBHs, which should occur more often in irregular dwarf galaxies, globular clusters, and hyper-compact (older) stellar clusters (Merritt et al. 2009; Jonker et al. 2012; Reines et al. 2013). As such, we consider the jetted WD-IMBH TDE scenario to remain possible but improbable.
5.2.6. CDF-S XT2: proto-magnetar scenario
Similar to CDF-S XT1, the proto-magnetar scenario can be applied to XT2, where its light curve suggests an association with a proto-magnetar emission formed after the BNS merger (Zhang 2013; Xue et al. 2019; Sun et al. 2019), viewed along a direction without neutron-rich ejecta material in the line-of-sight (or a low amount of ejecta material, e.g., Mej ≲ 10−4 M⊙; Sun et al. 2019; Quirola-Vásquez et al. 2024). Indeed, Xue et al. (2019) considered this interpretation as the most plausible for CDF-S XT2. However, the updated redshift leads to an increase in the peak luminosity by a factor of ≈45 and a decrease in the plateau duration by a factor of ≈4.5. Thus, we reexamine this model (following the method developed by Yu et al. 2013; Quirola-Vásquez et al. 2024), which requires new magnetic field and initial period parameters of Bp ∼ 1.3 × 10¹⁵ G and Pi ∼ 1 ms, respectively, to fit the light curve. Although these parameters allow the model to still mimic XT2’s light curve reasonably well, the magnetic field is now a factor of ∼1.5 lower, while the rotation rate is ∼3 faster. Those values could lead to tensions with the forbidden ranges discussed in the literature (e.g., Sun et al. 2019; Quirola-Vásquez et al. 2024), in particular, the initial period necessary to achieve a stable magnetar (Lattimer & Prakash 2004); however, our current knowledge about neutron star physics does not permit us to rule out this channel. Xue et al. (2019) pointed to the physical offset as a key argument in support of the magnetar model and its association with SGRBs. Nevertheless, the new JWST observations place XT2 near the center of its host galaxy (see Fig. A.2), and potentially aligned with the strongest star-forming clumps (see Fig. 10, right panel). This smaller offset provides less clarity about the progenitor of XT2. While the host properties (especially the high SFR) remain within the bounds of known SGRB galaxies (see Fig. 9), just a small portion of the SGRB hosts have equal or higher SFR (≲5%) and stellar mass (≲10%) compared to XT2’s host. We thus view the scenario wherein the FXT arises from a proto-magnetar that formed after the BNS merger with a lower likelihood than before. It may also be interesting to explore a magnetar model related to collapsars (based on the properties of its host).
5.2.7. CDF-S XT2: low-luminousity-LGRB scenario
Based on Figure 7, the X-ray light curve of CDF-S XT2 now appears to share some similarities with X-ray flashes (XRFs). XRFs are interpreted as the shock breakout from choked GRB jets (Campana et al. 2006; Bromberg et al. 2012; Nakar & Sari 2012; Barniol Duran et al. 2015; Irwin & Chevalier 2016), leading to the production of less luminous and/or energetic emission compared to typical LGRBs (they lie in the lower left corner in the Amati relation; Amati 2006; Willingale & Mészáros 2017; Martone et al. 2017) and a general absence of any highly relativistic (i.e., γ-ray) emission. The lack of a bright γ-ray counterpart of CDF-S XT2 (Xue et al. 2019) would be consistent with this scenario. Comparing X-ray light curves, XRF 100316D produced a plateau with duration and luminosity of ≈1 ks and ≈1046 erg s−1, respectively, interpreted as either quasi-spherical breakout emission (Nakar & Sari 2012) or synchrotron emission from a dissipating Poynting flux-dominated outflow powered by a magnetar (Pi ∼ 10 ms and Bp ∼ 3 × 10¹⁵ G) once the gravitational collapse occurs (Fan et al. 2011). XRF 080109 also exhibited a plateau phase, albeit somewhat longer (≈3 ks) and less luminous [≈(3 − 7)×1046 erg s−1] than XRF 100316D. Notably, XRF 100316D’s plateau phase is nearly identical to that of XT2 in duration and luminosity (see Fig. 7). Unfortunately, the low number of counts of CDF-S XT2 does not permit us to explore the possibility of a thermal component in the X-ray spectra, as observed in XRFs 060218 and 100316D. In terms of spectral evolution, XRF 060218 shows an X-ray thermal softening evolution (kT ∼ 0.1 − 0.2 keV) (Campana et al. 2006; Soderberg et al. 2006; Fan et al. 2006), while XRF 100316D does not present a significant thermal softening at early epochs (although some softening does appear at > 104 s; Starling et al. 2011; Fan et al. 2011; Margutti et al. 2013b). CDF-S XT2 also exhibits mild softening, but only at the 90% confidence level. Both XRFs 060218 and 100316D were found to have associated SNe at later times. There are no contemporaneous constraints for CDF-S XT2, although, at its distance, we would not expect any detection with current facility sensitivities.
The high SFR of the host galaxy of CDF-S XT2 implies that massive stars are plausible progenitors, thus favoring the LL-LGRB scenario. However, the host parameters of XT2 lie near the upper bound of the distribution among known LL-LGRB hosts (see Fig. 9). This could be a selection effect, as LL-LGRBs produce lower luminosity and/or energy emission, which has restricted detections to the relatively nearby universe to date, and hence CDF-S XT2 could be the first high redshift LL-LGRB detected. Overall, this scenario remains one of the most plausible ones.
5.3. Event rate density
In this section we estimate the event rate density of the XT1- and XT2-like objects (considering all Chandra observations between 2000 and 2022), assuming that both FXTs originate from the same progenitor channel based on the similar peak luminosities. A systematic search for FXTs in two decades of Chandra data, developed by Quirola-Vásquez et al. (2022, 2023), identified 22 FXTs: (i) five associated with nearby galaxies (≲100 Mpc) and (ii) 17 FXTs with further away galaxies (including CDF-S XT1 and XT2). We exclude the former group, which is likely related to low-luminosity (≲1039 erg s−1) objects such as X-ray binaries, and work only with higher luminosity events (Quirola-Vásquez et al. 2022). For computing the event rate, we consider not only CDF-S XT1 and XT2 but also FXTs with similar features to both FXTs: light curve shape, duration, and optically faint hosts (i.e., mr ≳ 24.5 mag) because of the stronger potential association with similar high redshifts. We identified seven additional FXTs (XRT 030511, XRT 100831 and XRT 110919 from Quirola-Vásquez et al. 2022 and XRT 140507, XRT 191127, XRT 170901 and XRT 210423 from Quirola-Vásquez et al. 2023) that share such similarities with CDF-S XT1 and XT2; therefore, we consider a total of nine XT1- and XT2-like FXTs (i.e., ∼53% of the aforementioned Chandra distant FXTs).
The event rate density, in general, evolves with cosmic time as ρ(z) = ρ0f(z) (Sun et al. 2015), where ρ0 is the local event rate density and f(z) is a normalized function that describes the cosmic evolution. The estimated local event density could be derived from N = ρ0VmaxΩT/4π (Zhang et al. 2018; Sun et al. 2019), where Vmax represents the maximum co-moving volume at which XT1- or XT2-like objects could be detected by Chandra, Ω and T depict the Chandra FoV and on-sky exposure time, respectively, and N is the number of sources. The factor ΩT is derived as ΩT = Σiωiti, where ωi and ti are the ACIS-I/S FoV and exposure time per individual observation, respectively, taken from 2000 to 2022 (analyzed by Quirola-Vásquez et al. 2022, 2023). Chandra can detect and identify FXT events as faint as FX, peak ∼ 2.5 × 10⁻¹³ erg cm−2 s−1 (based on the simulations by Quirola-Vásquez et al. 2022). Adopting a peak luminosity of LX, peak ∼ 1047 erg s−1, Chandra can then detect XT1 and XT2-like objects to redshifts up to zmax = 5.8, equating to a maximum co-moving volume of Vmax ∼ 2300 Gpc3. This translates to an estimated local density rate of  Gpc−3 yr−1 (at 99% confidence level).
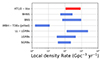 |
Fig. 12. Estimated local density rate comparison between XT1- and XT2-like objects (derived in this work) and the merger rate of neutron star and BH systems ( |
Figure 12 compares the estimated local volumetric density rate derived for XT1- and XT2-like objects and other transients: the merger rates of NS-BH (Abbott et al. 2021a) and BNS (Abbott et al. 2021b) systems; the rate of jetted (beamed) versions of WD-IMBH TDE systems (Malyali et al. 2019; Tanikawa et al. 2022), the rates of off-axis LL-LGRBs (Liang et al. 2007; Zhang 2018), LGRBs (Wanderman & Piran 2010), and SGRBs (Wanderman & Piran 2015). To convert beamed objects to off-axis versions, or isotropic objects to beamed ones, we adopt a beaming correction factor, fb, the values of which are taken from the literature as indicated in Fig. 12. Given the large uncertainties in these beaming factors, which effectively establish the ranges shown in Fig. 12, we do not factor in other errors. We do not consider SBOs or unbeamed WD-IMBH TDEs here, since they have already been strongly excluded based on their low luminosities (they are shown in Quirola-Vásquez et al. 2023). The rate of XT1+XT2-like objects appears compatible with at least a portion of the phase space of all the possible progenitor channels considered, aside from jetted WD-IMBH TDEs. We caveat here that the predicted rate of IMBH TDEs shows large uncertainties in the literature (e.g., MacLeod et al. 2016; Maguire et al. 2020; Malyali et al. 2019; Tanikawa et al. 2022), such that rejecting this channel is not possible.
6. Conclusions and future work
We report new constraints on the FXTs CDF-S XT1 (Luo et al. 2014; Bauer et al. 2017) and XT2 (Zheng et al. 2017; Xue et al. 2019), based on recent JWST NIRCam and MIRI photometry, as well as NIRspec spectroscopy in the case of CDF-S XT2, of their host galaxies.
The host of CDF-S XT1 is now constrained to lie at  (greatly reducing the uncertainty of the previous photometric redshift of
  ; Bauer et al. 2017), implying a host absolute magnitude MR = −19.14 mag, M* ≈ 2.8 × 10⁸ M⊙, SFR ≈ 0.62 M⊙ yr−1. These properties lie at the upper end of previous estimates (Bauer et al. 2017), leaving CDF-S XT1 with a peak X-ray luminosity of LX, peak ≈ 2.8 × 1047 erg s−1 and projected physical offset of δR = 1.2 ± 2.4 kpc. At this redshift, the early (≈80 min post X-ray trigger) upper limit from VLT-VIMOS translates to MR > −21.1 mag (which is inconsistent with the majority of on-axis GRB afterglows). We argue that the best progenitor scenario for XT1 is a low-luminosity GRB, where the X-rays are associated with the shock breakout of a choked jet, although we cannot fully rule out a proto-magnetar interpretation (formed after the merger of two neutron stars) and jetted WD-IMBH TDE channels.
In the case of CDF-S XT2, JWST imaging reveals a new highly obscured component of the host galaxy, previously absent from HST imaging, while NIRspec spectroscopy now securely places the host at zspec = 3.4598 ± 0.0022. The discrepancy with the previously measured redshift (first reported by Balestra et al. 2010) came from a contaminated VLT-VIMOS spectral extraction due to an X-ray AGN elliptical galaxy at z = 0.7396 (CANDELS #4210) lying ∼2″ to the southwest of XT2’s host. The new spectroscopic redshift combined with SED-fitting yields a FXT peak luminosity LX, peak ≈ 1.4 × 1047 erg s−1, host absolute magnitude of MR = −21.76 mag, M* ≈ 5.5 × 10¹⁰ M⊙, SFR ≈ 160 M⊙ yr−1, and mass-weighted stellar age of 0.38 ± 0.02 Gyr. The spatially resolved NIRSpec spectra probe the strong aforementioned HST-to-JWST color gradient across a projected offset of ∼0.2 kpc. Based on SED-fitting, the gradient appears to arise primarily from variable dust extinction, potentially as the result of gravitational encounters or mergers. Based on the revised X-ray and host properties, the similarity to X-ray flash event light curves, small host offset, and high, dusty SFR of the host (consistent with the large hydrogen column density observed toward the transient), a low-luminosity collapsar progenitor appears to be a good fit for CDF-S XT2. Nonetheless, based on our current knowledge of the physics of neutron stars, a proto-magnetar model is not ruled out.
Although the current HST and JWST observations push the boundaries of what is currently possible to understand the hosts of CDF-S XT1 and XT2, they are not enough to obtain a complete understanding of both objects. Finding similar objects to CDF-S XT1 and XT2 with sensitive time-domain observatories such as the new Einstein Probe satellite, especially at closer distances where contemporaneous multiwavelength (and perhaps multi-messenger) constraints can be obtained, remains essential to differentiate emission mechanisms and provide the last word on their nature.
Data availability
Additional data are available at https://zenodo.org/records/14844380
The data used in this work is available in the next link: https://zenodo.org/records/14844380
The model assumes that star formation jumps from zero to its maximum value at some time, after which star formation declines exponentially with a timescale τ.
MF is different than the current stellar mass because stellar mass loss during evolution (e.g., AGN emission and SN explosions) depends on metallicity, SFH, and IMF.
Formally, in the case of CDF-S XT2, the nearby AGN CANDELS #4210 (Santini et al. 2015) will contaminate our aperture and background, however, it should contribute on average only ≈0.5 photons within this aperture within the ≈70 ks exposure; as this represents only ≈0.4% of the total photons, we opt not to mask it out, since it would remove a much larger percentage of photons associated with CDF-S XT2.
Assuming a color dependence of mR − mF110W ≈ 0.4 − 0.7 mag based on GRB afterglow power-law spectral slopes in the range of −0.6 to −1.1 (Kann et al. 2010, 2011) and 0.4−1.0 mag for CCSNe between z = 0.0 and 1.0 (Poznanski et al. 2007; Drout et al. 2011; Bianco et al. 2014).
Considering a k-correction factor of k ≈ 5.2, assuming a power-law function given by the photon index Γ = 1.74.
We note that the deceleration jet scenario also predicts an afterglow emission with an optical peak, which is usually used to constrain the initial Lorentz factor of GRBs. High intrinsic extinction from the host galaxy could explain the lack of strong optical emission for CDF-S XT1. Extrapolating an AV estimate from the hydrogen column density (i.e., NH ≈ 2 × 1022 cm−2) yields  mag (Güver & Özel 2009) for the Galactic gas-to-dust ratio. Assuming a gas-to-dust ratio for a Small-Magallanic (SMC) environment (GRBs are well described by an SMC-type extinction curve with moderate to low extinction; Zafar et al. 2011) yields
  mag, which is more consistent with a galaxy with a moderate SFR similar to the host of CDF-S XT1. Both values can easily explain the optical non-detection.
The ISM is described by the number density medium n0 in units of cm−3.
To compute spectral slopes, we split the event file regarding the time when the plateau ends (Quirola-Vásquez et al. 2023), and extract and fit the spectra using the value for the absorption derived from the fit to the full spectrum (see Table 3). We fit both spectral intervals together assuming fixed NH, Gal, NH, and redshift.
Source #4167 in the CANDELS F160W DR1 catalog of Guo et al. (2013) and #7699 in the 3D-HST v4.1 catalog of Skelton et al. (2014).
Some caution is warranted here to not overinterpret these results, due to known degeneracies between age, mass, and AV, which appear as larger parameter error bars associated with the redder spectra.
The raw slit imaging data is available in the ESO Observational Raw Data Archive: http://archive.eso.org/eso/eso_archive_main.html
The VIMOS/VLT data are bias subtracted, flat-field corrected, wavelength calibrated, sky subtracted, and flux calibrated, and made available in the ESO Science Portal: http://archive.eso.org/scienceportal/home
This data cube is bias subtracted, flat-field corrected, wavelength calibrated, sky subtracted, flux calibrated, stacked, and made available in the ESO Science Portal.
ZAP uses principle component analysis combined with filtering to construct a sky residual for each spaxel which is subtracted from the original data cube.
Acknowledgments
We thank Fengwu Sun and Gabriel Brammer for helpful early discussions about available JWST imaging and photometric redshifts for the hosts of CDF-S XT1 and XT2. The scientific results reported in this article are based on observations made by the Chandra X-ray Observatory, the ESO Science Archive Facility, and the JADES – JWST Advanced Deep Extragalactic Survey. This research has made use of software provided by the Chandra X-ray Center (CXC). We acknowledge support from: the European Research Council (ERC) under the European Union’s Horizon 2020 research and innovation programme Grant agreement No. 101095973 (JQ-V, PGJ); the IAU-Gruber foundation fellowship (JQ-V); ANID – Millennium Science Initiative Program – ICN12_009 (FEB, JQ-V), CATA-BASAL – FB210003 (FEB), FONDECYT Regular – 1241005 (FEB), the Penn State Eberly Endowment (WNB), and the NSFC 12025303 (YQX).
References
- Abbott, R., Abbott, T. D., Abraham, S., et al. 2021a, ApJ, 915, L5 [NASA ADS] [CrossRef] [Google Scholar]
- Abbott, R., Abbott, T. D., Abraham, S., et al. 2021b, Phys. Rev. X, 11, 021053 [Google Scholar]
- Ai, S., & Zhang, B. 2021, ApJ, 915, L11 [NASA ADS] [CrossRef] [Google Scholar]
- Alexander, K. D., Berger, E., Guillochon, J., Zauderer, B. A., & Williams, P. K. G. 2016, ApJ, 819, L25 [NASA ADS] [CrossRef] [Google Scholar]
- Alp, D., & Larsson, J. 2020, ApJ, 896, 39 [NASA ADS] [CrossRef] [Google Scholar]
- Amati, L. 2006, MNRAS, 372, 233 [Google Scholar]
- Arabsalmani, M., Roychowdhury, S., Starkenburg, T. K., et al. 2019, MNRAS, 485, 5411 [NASA ADS] [CrossRef] [Google Scholar]
- Aravena, M., Decarli, R., Walter, F., et al. 2016, ApJ, 833, 68 [Google Scholar]
- Arnaud, K. A. 1996, ASP Conf. Ser., 101, 17 [Google Scholar]
- Balestra, I., Mainieri, V., Popesso, P., et al. 2010, A&A, 512, A12 [NASA ADS] [CrossRef] [EDP Sciences] [Google Scholar]
- Barbary, K. 2018, Astrophysics Source Code Library [record ascl:1811.004] [Google Scholar]
- Barniol Duran, R., Nakar, E., Piran, T., & Sari, R. 2015, MNRAS, 448, 417 [NASA ADS] [CrossRef] [Google Scholar]
- Barrufet, L., Oesch, P., Marques-Chaves, R., et al. 2024, ArXiv e-prints [arXiv:2404.08052] [Google Scholar]
- Bauer, F. E., Treister, E., Schawinski, K., et al. 2017, MNRAS, 467, 4841 [NASA ADS] [CrossRef] [Google Scholar]
- Beniamini, P., Duque, R., Daigne, F., & Mochkovitch, R. 2020, MNRAS, 492, 2847 [NASA ADS] [CrossRef] [Google Scholar]
- Berger, E. 2014, ARA&A, 52, 43 [CrossRef] [Google Scholar]
- Berger, E., Kulkarni, S. R., Pooley, G., et al. 2003, Nature, 426, 154 [NASA ADS] [CrossRef] [Google Scholar]
- Berger, E., Zauderer, A., Pooley, G. G., et al. 2012, ApJ, 748, 36 [Google Scholar]
- Berger, E., Zauderer, B. A., Levan, A., et al. 2013, ApJ, 765, 121 [NASA ADS] [CrossRef] [Google Scholar]
- Bernardini, M. G., Margutti, R., Mao, J., Zaninoni, E., & Chincarini, G. 2012, A&A, 539, A3 [NASA ADS] [CrossRef] [EDP Sciences] [Google Scholar]
- Bertin, E., & Arnouts, S. 1996, A&AS, 117, 393 [NASA ADS] [CrossRef] [EDP Sciences] [Google Scholar]
- Bianco, F. B., Modjaz, M., Hicken, M., et al. 2014, ApJS, 213, 19 [Google Scholar]
- Blanchard, P. K., Berger, E., & Fong, W.-F. 2016, ApJ, 817, 144 [Google Scholar]
- Blandford, R. D., & Znajek, R. L. 1977, MNRAS, 179, 433 [NASA ADS] [CrossRef] [Google Scholar]
- Bloom, J. S., Giannios, D., Metzger, B. D., et al. 2011, Science, 333, 203 [CrossRef] [PubMed] [Google Scholar]
- Böker, T., Beck, T. L., Birkmann, S. M., et al. 2023, PASP, 135, 038001 [CrossRef] [Google Scholar]
- Bradley, L., Sipőcz, B., Robitaille, T., et al. 2023, https://doi.org/10.5281/zenodo.7946442 [Google Scholar]
- Brammer, G. 2019, Astrophysics Source Code Library [record ascl:1905.001] [Google Scholar]
- Brammer, G. B., van Dokkum, P. G., & Coppi, P. 2008, ApJ, 686, 1503 [Google Scholar]
- Bromberg, O., Nakar, E., & Piran, T. 2011, ApJ, 739, L55 [NASA ADS] [CrossRef] [Google Scholar]
- Bromberg, O., Nakar, E., Piran, T., & Sari, R. 2012, ApJ, 749, 110 [NASA ADS] [CrossRef] [Google Scholar]
- Brown, G. C., Levan, A. J., Stanway, E. R., et al. 2015, MNRAS, 452, 4297 [NASA ADS] [CrossRef] [Google Scholar]
- Buchner, J., Georgakakis, A., Nandra, K., et al. 2014, A&A, 564, A125 [NASA ADS] [CrossRef] [EDP Sciences] [Google Scholar]
- Bunker, A. J., Cameron, A. J., Curtis-Lake, E., et al. 2024, A&A, 690, A288 [NASA ADS] [CrossRef] [EDP Sciences] [Google Scholar]
- Burrows, D. N., Kennea, J. A., Ghisellini, G., et al. 2011, Nature, 476, 421 [NASA ADS] [CrossRef] [Google Scholar]
- Byler, N., Dalcanton, J. J., Conroy, C., & Johnson, B. D. 2017, ApJ, 840, 44 [Google Scholar]
- Calzetti, D., Armus, L., Bohlin, R. C., et al. 2000, ApJ, 533, 682 [NASA ADS] [CrossRef] [Google Scholar]
- Campana, S., Mangano, V., Blustin, A. J., et al. 2006, Nature, 442, 1008 [NASA ADS] [CrossRef] [Google Scholar]
- Cao, Z., Jonker, P. G., Wen, S., Stone, N. C., & Zabludoff, A. I. 2023, MNRAS, 519, 2375 [Google Scholar]
- Carilli, C. L., Hodge, J., Walter, F., et al. 2011, ApJ, 739, L33 [NASA ADS] [CrossRef] [Google Scholar]
- Carnall, A. C., McLure, R. J., Dunlop, J. S., & Davé, R. 2018, MNRAS, 480, 4379 [Google Scholar]
- Carnall, A. C., Leja, J., Johnson, B. D., et al. 2019, ApJ, 873, 44 [Google Scholar]
- Cash, W. 1979, ApJ, 228, 939 [Google Scholar]
- Cenko, S. B., Krimm, H. A., Horesh, A., et al. 2012, ApJ, 753, 77 [NASA ADS] [CrossRef] [Google Scholar]
- Cenko, S. B., Kulkarni, S. R., Horesh, A., et al. 2013, ApJ, 769, 130 [NASA ADS] [CrossRef] [Google Scholar]
- Chincarini, G., Moretti, A., Romano, P., et al. 2007, ApJ, 671, 1903 [NASA ADS] [CrossRef] [Google Scholar]
- Chincarini, G., Mao, J., Margutti, R., et al. 2010, MNRAS, 406, 2113 [NASA ADS] [CrossRef] [Google Scholar]
- Christensen, L., Vreeswijk, P. M., Sollerman, J., et al. 2008, A&A, 490, 45 [NASA ADS] [CrossRef] [EDP Sciences] [Google Scholar]
- Colina, L., Crespo Gómez, A., Álvarez-Márquez, J., et al. 2023, A&A, 673, L6 [NASA ADS] [CrossRef] [EDP Sciences] [Google Scholar]
- Coppejans, D. L., Margutti, R., Terreran, G., et al. 2020, ApJ, 895, L23 [NASA ADS] [CrossRef] [Google Scholar]
- D’Avanzo, P., Salvaterra, R., Sbarufatti, B., et al. 2012, MNRAS, 425, 506 [CrossRef] [Google Scholar]
- D’Avanzo, P., Campana, S., Salafia, O. S., et al. 2018, A&A, 613, L1 [NASA ADS] [CrossRef] [EDP Sciences] [Google Scholar]
- De Colle, F., Guillochon, J., Naiman, J., & Ramirez-Ruiz, E. 2012, ApJ, 760, 103 [NASA ADS] [CrossRef] [Google Scholar]
- De Luca, A., Salvaterra, R., Belfiore, A., et al. 2021, A&A, 650, A167 [NASA ADS] [CrossRef] [EDP Sciences] [Google Scholar]
- Dermer, C. D., Chiang, J., & Böttcher, M. 1999, ApJ, 513, 656 [CrossRef] [Google Scholar]
- D’Eugenio, F., Cameron, A. J., Scholtz, J., et al. 2024, ArXiv e-prints [arXiv:2404.06531] [Google Scholar]
- Drout, M. R., Soderberg, A. M., Gal-Yam, A., et al. 2011, ApJ, 741, 97 [NASA ADS] [CrossRef] [Google Scholar]
- Eappachen, D., Jonker, P. G., Fraser, M., et al. 2022, MNRAS, 514, 302 [NASA ADS] [CrossRef] [Google Scholar]
- Eappachen, D., Jonker, P. G., Levan, A. J., et al. 2023, ApJ, 948, 91 [NASA ADS] [CrossRef] [Google Scholar]
- Eappachen, D., Jonker, P. G., Quirola-Vásquez, J., et al. 2024, MNRAS, 527, 11823 [Google Scholar]
- Eftekhari, T., Berger, E., Zauderer, B. A., Margutti, R., & Alexander, K. D. 2018, ApJ, 854, 86 [Google Scholar]
- Eisenstein, D. J., Willott, C., Alberts, S., et al. 2023a, ArXiv e-prints [arXiv:2306.02465] [Google Scholar]
- Eisenstein, D. J., Johnson, B. D., Robertson, B., et al. 2023b, ArXiv e-prints [arXiv:2310.12340] [Google Scholar]
- Evans, P. A., Beardmore, A. P., Page, K. L., et al. 2007, A&A, 469, 379 [NASA ADS] [CrossRef] [EDP Sciences] [Google Scholar]
- Evans, P. A., Beardmore, A. P., Page, K. L., et al. 2009, MNRAS, 397, 1177 [Google Scholar]
- Fan, Y.-Z., Piran, T., & Xu, D. 2006, JCAP, 2006, 013 [CrossRef] [Google Scholar]
- Fan, Y.-Z., Zhang, B.-B., Xu, D., Liang, E.-W., & Zhang, B. 2011, ApJ, 726, 32 [Google Scholar]
- Fazio, G. G., Hora, J. L., Allen, L. E., et al. 2004, ApJS, 154, 10 [Google Scholar]
- Ferland, G. J., Chatzikos, M., Guzmán, F., et al. 2017, Rev. Mexicana Astron. Astrofis., 53, 385 [Google Scholar]
- Fong, W., Berger, E., & Fox, D. B. 2010, ApJ, 708, 9 [NASA ADS] [CrossRef] [Google Scholar]
- Fong, W., Berger, E., Margutti, R., et al. 2012, ApJ, 756, 189 [NASA ADS] [CrossRef] [Google Scholar]
- Fong, W., Berger, E., Metzger, B. D., et al. 2014, ApJ, 780, 118 [Google Scholar]
- Fong, W., Berger, E., Margutti, R., & Zauderer, B. A. 2015, ApJ, 815, 102 [NASA ADS] [CrossRef] [Google Scholar]
- Fong, W.-F., Nugent, A. E., Dong, Y., et al. 2022, ApJ, 940, 56 [NASA ADS] [CrossRef] [Google Scholar]
- Freeman, P. E., Kashyap, V., Rosner, R., & Lamb, D. Q. 2002, ApJS, 138, 185 [Google Scholar]
- Gaia Collaboration (Brown, A. G. A., et al.) 2018, A&A, 616, A1 [NASA ADS] [CrossRef] [EDP Sciences] [Google Scholar]
- Galbany, L., Stanishev, V., Mourão, A. M., et al. 2014, A&A, 572, A38 [NASA ADS] [CrossRef] [EDP Sciences] [Google Scholar]
- Gardner, J. P., Mather, J. C., Clampin, M., et al. 2006, Space Sci. Rev., 123, 485 [Google Scholar]
- Gardner, J. P., Mather, J. C., Abbott, R., Abell, J. S., & Abernathy, M. 2023, PASP, 135, 068001 [NASA ADS] [CrossRef] [Google Scholar]
- Genet, F., Daigne, F., & Mochkovitch, R. 2007, MNRAS, 381, 732 [NASA ADS] [CrossRef] [Google Scholar]
- Ghirlanda, G., Nava, L., Ghisellini, G., et al. 2012, MNRAS, 420, 483 [NASA ADS] [CrossRef] [Google Scholar]
- Ghirlanda, G., Salvaterra, R., Campana, S., et al. 2015, A&A, 578, A71 [NASA ADS] [CrossRef] [EDP Sciences] [Google Scholar]
- Ghirlanda, G., Nappo, F., Ghisellini, G., et al. 2018, A&A, 609, A112 [NASA ADS] [CrossRef] [EDP Sciences] [Google Scholar]
- Ghisellini, G., Ghirlanda, G., Nava, L., & Firmani, C. 2007, ApJ, 658, L75 [NASA ADS] [CrossRef] [Google Scholar]
- Gillanders, J. H., Rhodes, L., Srivastav, S., et al. 2024, ApJ, 969, L14 [NASA ADS] [CrossRef] [Google Scholar]
- Glennie, A., Jonker, P. G., Fender, R. P., Nagayama, T., & Pretorius, M. L. 2015, MNRAS, 450, 3765 [NASA ADS] [CrossRef] [Google Scholar]
- Goldberg, J. A., Jiang, Y.-F., & Bildsten, L. 2022, ApJ, 933, 164 [NASA ADS] [CrossRef] [Google Scholar]
- Gompertz, B. P., O’Brien, P. T., & Wynn, G. A. 2014, MNRAS, 438, 240 [NASA ADS] [CrossRef] [Google Scholar]
- Granot, J., Panaitescu, A., Kumar, P., & Woosley, S. E. 2002, ApJ, 570, L61 [NASA ADS] [CrossRef] [Google Scholar]
- Guetta, D., & Piran, T. 2005, A&A, 435, 421 [NASA ADS] [CrossRef] [EDP Sciences] [Google Scholar]
- Guo, Y., Ferguson, H. C., Giavalisco, M., et al. 2013, ApJS, 207, 24 [NASA ADS] [CrossRef] [Google Scholar]
- Güver, T., & Özel, F. 2009, MNRAS, 400, 2050 [Google Scholar]
- Haas, R., Shcherbakov, R. V., Bode, T., & Laguna, P. 2012, ApJ, 749, 117 [NASA ADS] [CrossRef] [Google Scholar]
- Hancock, P. J., Murphy, T., Gaensler, B., & Zauderer, A. 2012, GRB Coordinates Network, 12804, 1 [NASA ADS] [Google Scholar]
- Heintz, K. E., Prochaska, J. X., Simha, S., et al. 2020, ApJ, 903, 152 [NASA ADS] [CrossRef] [Google Scholar]
- Heintz, K. E., Watson, D., Brammer, G., et al. 2024, Science, 384, 890 [NASA ADS] [CrossRef] [Google Scholar]
- Heise, J., & in’t Zand, J. 2010, Compact Stellar X-ray Sources (Cambridge: Cambridge University Press), 267 [Google Scholar]
- Herenz, E. C., Urrutia, T., Wisotzki, L., et al. 2017, A&A, 606, A12 [NASA ADS] [CrossRef] [EDP Sciences] [Google Scholar]
- Ho, A. Y. Q., Goldstein, D. A., Schulze, S., et al. 2019, ApJ, 887, 169 [Google Scholar]
- Ho, A. Y. Q., Perley, D. A., Kulkarni, S. R., et al. 2020a, ApJ, 895, 49 [NASA ADS] [CrossRef] [Google Scholar]
- Ho, A. Y. Q., Perley, D. A., Beniamini, P., et al. 2020b, ApJ, 905, 98 [NASA ADS] [CrossRef] [Google Scholar]
- Hodge, J. A., Riechers, D., Decarli, R., et al. 2015, ApJ, 798, L18 [Google Scholar]
- Huang, Y. F., Dai, Z. G., & Lu, T. 2002, MNRAS, 332, 735 [NASA ADS] [CrossRef] [Google Scholar]
- Illingworth, G., Magee, D., Bouwens, R., et al. 2016, ArXiv e-prints [arXiv:1606.00841] [Google Scholar]
- Inami, H., Bacon, R., Brinchmann, J., et al. 2017, A&A, 608, A2 [NASA ADS] [CrossRef] [EDP Sciences] [Google Scholar]
- Ioka, K., Toma, K., Yamazaki, R., & Nakamura, T. 2006, A&A, 458, 7 [NASA ADS] [CrossRef] [EDP Sciences] [Google Scholar]
- Irwin, C. M., & Chevalier, R. A. 2016, MNRAS, 460, 1680 [NASA ADS] [CrossRef] [Google Scholar]
- Izzo, L., Thöne, C. C., Schulze, S., et al. 2017, MNRAS, 472, 4480 [Google Scholar]
- Izzo, L., Auchettl, K., Hjorth, J., et al. 2020, A&A, 639, L11 [EDP Sciences] [Google Scholar]
- Jin, S., Daddi, E., Magdis, G. E., et al. 2022, A&A, 665, A3 [NASA ADS] [CrossRef] [EDP Sciences] [Google Scholar]
- Johnson, B. D., Leja, J., Conroy, C., & Speagle, J. S. 2021, ApJS, 254, 22 [NASA ADS] [CrossRef] [Google Scholar]
- Jonker, P. G., Heida, M., Torres, M. A. P., et al. 2012, ApJ, 758, 28 [NASA ADS] [CrossRef] [Google Scholar]
- Jonker, P. G., Glennie, A., Heida, M., et al. 2013, ApJ, 779, 14 [NASA ADS] [CrossRef] [Google Scholar]
- Kalberla, P. M. W., & Haud, U. 2015, A&A, 578, A78 [NASA ADS] [CrossRef] [EDP Sciences] [Google Scholar]
- Kalberla, P. M. W., Burton, W. B., Hartmann, D., et al. 2005, A&A, 440, 775 [NASA ADS] [CrossRef] [EDP Sciences] [Google Scholar]
- Kann, D. A., Klose, S., & Zeh, A. 2006, ApJ, 641, 993 [NASA ADS] [CrossRef] [Google Scholar]
- Kann, D. A., Klose, S., Zhang, B., et al. 2010, ApJ, 720, 1513 [Google Scholar]
- Kann, D. A., Klose, S., Zhang, B., et al. 2011, ApJ, 734, 96 [NASA ADS] [CrossRef] [Google Scholar]
- Kawana, K., Tanikawa, A., & Yoshida, N. 2018, MNRAS, 477, 3449 [NASA ADS] [CrossRef] [Google Scholar]
- Kokorev, V., Jin, S., Magdis, G. E., et al. 2023, ApJ, 945, L25 [NASA ADS] [CrossRef] [Google Scholar]
- Krolik, J. H., & Piran, T. 2011, ApJ, 743, 134 [NASA ADS] [CrossRef] [Google Scholar]
- Kroupa, P., & Boily, C. M. 2002, MNRAS, 336, 1188 [Google Scholar]
- Krühler, T., Kuncarayakti, H., Schady, P., et al. 2017, A&A, 602, A85 [NASA ADS] [CrossRef] [EDP Sciences] [Google Scholar]
- Kulkarni, S. R., Frail, D. A., Wieringa, M. H., et al. 1998, Nature, 395, 663 [NASA ADS] [CrossRef] [Google Scholar]
- Lattimer, J. M., & Prakash, M. 2004, Science, 304, 536 [NASA ADS] [CrossRef] [Google Scholar]
- Lazzati, D., Deich, A., Morsony, B. J., & Workman, J. C. 2017, MNRAS, 471, 1652 [NASA ADS] [CrossRef] [Google Scholar]
- Leja, J., Johnson, B. D., Conroy, C., van Dokkum, P. G., & Byler, N. 2017, ApJ, 837, 170 [NASA ADS] [CrossRef] [Google Scholar]
- Leja, J., Johnson, B. D., Conroy, C., & van Dokkum, P. 2018, ApJ, 854, 62 [NASA ADS] [CrossRef] [Google Scholar]
- Levan, A. J., Tanvir, N. R., Cenko, S. B., et al. 2011, Science, 333, 199 [NASA ADS] [CrossRef] [Google Scholar]
- Levan, A. J., Jonker, P. G., Saccardi, A., et al. 2024, ArXiv e-prints [arXiv:2404.16350] [Google Scholar]
- Levesque, E. M. 2014, PASP, 126, 1 [NASA ADS] [CrossRef] [Google Scholar]
- Li, Y., Zhang, B., & Lü, H.-J. 2016, ApJS, 227, 7 [NASA ADS] [CrossRef] [Google Scholar]
- Liang, E., Zhang, B., Virgili, F., & Dai, Z. G. 2007, ApJ, 662, 1111 [NASA ADS] [CrossRef] [Google Scholar]
- Lin, J., Lu, R.-J., Lin, D.-B., & Wang, X.-G. 2020, ApJ, 895, 46 [Google Scholar]
- Lin, D., Irwin, J. A., Berger, E., & Nguyen, R. 2022, ApJ, 927, 211 [NASA ADS] [CrossRef] [Google Scholar]
- Liu, Y., Sun, H., Xu, D., et al. 2025, ArXiv e-prints [arXiv:2404.16425] [Google Scholar]
- Lü, H.-J., Zhang, B., Lei, W.-H., Li, Y., & Lasky, P. D. 2015, ApJ, 805, 89 [CrossRef] [Google Scholar]
- Lü, H.-J., Yuan, Y., Lan, L., et al. 2019, RAA, 21, 047 [Google Scholar]
- Luo, B., Brandt, N., & Bauer, F. 2014, ATel, 6541, 1 [NASA ADS] [Google Scholar]
- Luo, B., Brandt, W. N., Xue, Y. Q., et al. 2017, ApJS, 228, 2 [Google Scholar]
- Lyons, N., O’Brien, P. T., Zhang, B., et al. 2010, MNRAS, 402, 705 [NASA ADS] [CrossRef] [Google Scholar]
- MacLeod, M., Goldstein, J., Ramirez-Ruiz, E., Guillochon, J., & Samsing, J. 2014, ApJ, 794, 9 [NASA ADS] [CrossRef] [Google Scholar]
- MacLeod, M., Guillochon, J., Ramirez-Ruiz, E., Kasen, D., & Rosswog, S. 2016, ApJ, 819, 3 [NASA ADS] [CrossRef] [Google Scholar]
- Maguire, K., Eracleous, M., Jonker, P. G., MacLeod, M., & Rosswog, S. 2020, Space Sci. Rev., 216, 39 [NASA ADS] [CrossRef] [Google Scholar]
- Malyali, A., Rau, A., & Nandra, K. 2019, MNRAS, 489, 5413 [NASA ADS] [CrossRef] [Google Scholar]
- Margutti, R., Guidorzi, C., Chincarini, G., et al. 2010, MNRAS, 406, 2149 [NASA ADS] [CrossRef] [Google Scholar]
- Margutti, R., Bernardini, G., Barniol Duran, R., et al. 2011, MNRAS, 410, 1064 [NASA ADS] [CrossRef] [Google Scholar]
- Margutti, R., Berger, E., Fong, W., et al. 2012, ApJ, 756, 63 [NASA ADS] [CrossRef] [Google Scholar]
- Margutti, R., Zaninoni, E., Bernardini, M. G., et al. 2013a, MNRAS, 428, 729 [NASA ADS] [CrossRef] [Google Scholar]
- Margutti, R., Soderberg, A. M., Wieringa, M. H., et al. 2013b, ApJ, 778, 18 [NASA ADS] [CrossRef] [Google Scholar]
- Margutti, R., Metzger, B. D., Chornock, R., et al. 2019, ApJ, 872, 18 [Google Scholar]
- Martone, R., Izzo, L., Della Valle, M., et al. 2017, A&A, 608, A52 [NASA ADS] [CrossRef] [EDP Sciences] [Google Scholar]
- Merritt, D., Schnittman, J. D., & Komossa, S. 2009, ApJ, 699, 1690 [NASA ADS] [CrossRef] [Google Scholar]
- Metzger, B. D., & Piro, A. L. 2014, MNRAS, 439, 3916 [NASA ADS] [CrossRef] [Google Scholar]
- Michałowski, M. J., Hunt, L. K., Palazzi, E., et al. 2014, A&A, 562, A70 [NASA ADS] [CrossRef] [EDP Sciences] [Google Scholar]
- MichałowskI, M. J., Xu, D., Stevens, J., et al. 2018, A&A, 616, A169 [CrossRef] [EDP Sciences] [Google Scholar]
- Modjaz, M., Li, W., Butler, N., et al. 2009, ApJ, 702, 226 [NASA ADS] [CrossRef] [Google Scholar]
- Molinari, E., Vergani, S. D., Malesani, D., et al. 2007, A&A, 469, L13 [NASA ADS] [CrossRef] [EDP Sciences] [Google Scholar]
- Nakar, E. 2015, ApJ, 807, 172 [Google Scholar]
- Nakar, E., & Sari, R. 2012, ApJ, 747, 88 [CrossRef] [Google Scholar]
- Nardini, M., Ghisellini, G., Ghirlanda, G., & Celotti, A. 2010, MNRAS, 403, 1131 [NASA ADS] [CrossRef] [Google Scholar]
- Nicuesa Guelbenzu, A., Klose, S., Greiner, J., et al. 2012, A&A, 548, A101 [NASA ADS] [CrossRef] [EDP Sciences] [Google Scholar]
- Norris, J. P., Bonnell, J. T., Kazanas, D., et al. 2005, ApJ, 627, 324 [NASA ADS] [CrossRef] [Google Scholar]
- Novara, G., Esposito, P., Tiengo, A., et al. 2020, ApJ, 898, 37 [Google Scholar]
- Nugent, A. E., Fong, W.-F., Dong, Y., et al. 2022, ApJ, 940, 57 [NASA ADS] [CrossRef] [Google Scholar]
- Nynka, M., Ruan, J. J., Haggard, D., & Evans, P. A. 2018, ApJ, 862, L19 [NASA ADS] [CrossRef] [Google Scholar]
- Ott, T. 2012, Astrophysics Source Code Library [record ascl:1210.019] [Google Scholar]
- Palmerio, J. T., & Daigne, F. 2021, A&A, 649, A166 [NASA ADS] [CrossRef] [EDP Sciences] [Google Scholar]
- Panaitescu, A. 2008, MNRAS, 383, 1143 [Google Scholar]
- Peng, Z.-K., Yang, Y.-S., Shen, R.-F., et al. 2019, ApJ, 884, L34 [NASA ADS] [CrossRef] [Google Scholar]
- Perley, D. A., Cenko, S. B., Corsi, A., et al. 2014, ApJ, 781, 37 [NASA ADS] [CrossRef] [Google Scholar]
- Perley, D. A., Ho, A. Y. Q., Fausnaugh, M., et al. 2025, MNRAS, 537, 1 [NASA ADS] [Google Scholar]
- Pessa, I., Tejos, N., & Moya, C. 2018, ArXiv e-prints [arXiv:1803.05005] [Google Scholar]
- Phinney, E. S. 1989, IAU Symp., 136, 543 [Google Scholar]
- Pian, E., Mazzali, P. A., Masetti, N., et al. 2006, Nature, 442, 1011 [Google Scholar]
- Piran, T. 2004, Rev. Mod. Phys., 76, 1143 [Google Scholar]
- Poznanski, D., Maoz, D., & Gal-Yam, A. 2007, AJ, 134, 1285 [Google Scholar]
- Prieto, J. L., Stanek, K. Z., & Beacom, J. F. 2008, ApJ, 673, 999 [NASA ADS] [CrossRef] [Google Scholar]
- Quirola-Vásquez, J., Bauer, F. E., Jonker, P. G., et al. 2022, A&A, 663, A168 [NASA ADS] [CrossRef] [EDP Sciences] [Google Scholar]
- Quirola-Vásquez, J., Bauer, F. E., Jonker, P. G., et al. 2023, A&A, 675, A44 [NASA ADS] [CrossRef] [EDP Sciences] [Google Scholar]
- Quirola-Vásquez, J., Bauer, F. E., Jonker, P. G., et al. 2024, A&A, 683, A243 [NASA ADS] [CrossRef] [EDP Sciences] [Google Scholar]
- Racusin, J. L., Liang, E. W., Burrows, D. N., et al. 2009, ApJ, 698, 43 [NASA ADS] [CrossRef] [Google Scholar]
- Racusin, J. L., Oates, S. R., Schady, P., et al. 2011, ApJ, 738, 138 [Google Scholar]
- Rees, M. J. 1988, Nature, 333, 523 [Google Scholar]
- Reines, A. E., Greene, J. E., & Geha, M. 2013, ApJ, 775, 116 [Google Scholar]
- Rhoads, J. E. 2003, ApJ, 591, 1097 [Google Scholar]
- Rieke, M. J., Kelly, D. M., Misselt, K., et al. 2023a, PASP, 135, 028001 [CrossRef] [Google Scholar]
- Rieke, M. J., Robertson, B., Tacchella, S., et al. 2023b, ApJS, 269, 16 [NASA ADS] [CrossRef] [Google Scholar]
- Rossi, A., Frederiks, D. D., Kann, D. A., et al. 2022, A&A, 665, A125 [NASA ADS] [CrossRef] [EDP Sciences] [Google Scholar]
- Rowlinson, A., O’Brien, P. T., Tanvir, N. R., et al. 2010, MNRAS, 409, 531 [NASA ADS] [CrossRef] [Google Scholar]
- Rowlinson, A., O’Brien, P. T., Metzger, B. D., Tanvir, N. R., & Levan, A. J. 2013, MNRAS, 430, 1061 [NASA ADS] [CrossRef] [Google Scholar]
- Ryan, G., van Eerten, H., Piro, L., & Troja, E. 2020, ApJ, 896, 166 [CrossRef] [Google Scholar]
- Sądowski, A., Tejeda, E., Gafton, E., Rosswog, S., & Abarca, D. 2016, MNRAS, 458, 4250 [CrossRef] [Google Scholar]
- Sakamoto, T., Troja, E., Aoki, K., et al. 2013, ApJ, 766, 41 [NASA ADS] [CrossRef] [Google Scholar]
- Salafia, O. S., & Ghirlanda, G. 2022, Galaxies, 10, 93 [NASA ADS] [CrossRef] [Google Scholar]
- Salas, P., Bauer, F. E., Stockdale, C., & Prieto, J. L. 2013, MNRAS, 428, 1207 [NASA ADS] [CrossRef] [Google Scholar]
- Santini, P., Ferguson, H. C., Fontana, A., et al. 2015, ApJ, 801, 97 [Google Scholar]
- Santini, P., Fontana, A., Castellano, M., et al. 2017, ApJ, 847, 76 [NASA ADS] [CrossRef] [Google Scholar]
- Sari, R. 1999, ApJ, 524, L43 [CrossRef] [Google Scholar]
- Sarin, N., Ashton, G., Lasky, P. D., et al. 2021, ArXiv e-prints [arXiv:2105.10108] [Google Scholar]
- Saxton, R., Komossa, S., Auchettl, K., & Jonker, P. G. 2021, Space Sci. Rev., 217, 18 [NASA ADS] [CrossRef] [Google Scholar]
- Schulze, S., Klose, S., Björnsson, G., et al. 2011, AIP Conf. Ser., 1358, 165 [Google Scholar]
- Schulze, S., Yaron, O., Sollerman, J., et al. 2021, ApJS, 255, 29 [NASA ADS] [CrossRef] [Google Scholar]
- Scully, B., Matzner, C. D., & Yalinewich, A. 2023, MNRAS, 525, 1562 [NASA ADS] [Google Scholar]
- Simha, V., Weinberg, D. H., Conroy, C., et al. 2014, ArXiv e-prints [arXiv:1404.0402] [Google Scholar]
- Simon, J. D. 2019, ARA&A, 57, 375 [NASA ADS] [CrossRef] [Google Scholar]
- Skelton, R. E., Whitaker, K. E., Momcheva, I. G., et al. 2014, ApJS, 214, 24 [Google Scholar]
- Smail, I., Dudzevičiūtė, U., Stach, S. M., et al. 2021, MNRAS, 502, 3426 [NASA ADS] [CrossRef] [Google Scholar]
- Soderberg, A. M., Kulkarni, S. R., Berger, E., et al. 2005, ApJ, 621, 908 [NASA ADS] [CrossRef] [Google Scholar]
- Soderberg, A. M., Kulkarni, S. R., Nakar, E., et al. 2006, Nature, 442, 1014 [CrossRef] [Google Scholar]
- Soderberg, A. M., Berger, E., Page, K. L., et al. 2008, Nature, 454, 246 [NASA ADS] [CrossRef] [Google Scholar]
- Soderberg, A. M., Chakraborti, S., Pignata, G., et al. 2010, Nature, 463, 513 [NASA ADS] [CrossRef] [Google Scholar]
- Soto, K. T., Lilly, S. J., Bacon, R., Richard, J., & Conseil, S. 2016, MNRAS, 458, 3210 [Google Scholar]
- Starling, R. L. C., Wiersema, K., Levan, A. J., et al. 2011, MNRAS, 411, 2792 [NASA ADS] [CrossRef] [Google Scholar]
- Strubbe, L. E., & Quataert, E. 2009, MNRAS, 400, 2070 [NASA ADS] [CrossRef] [Google Scholar]
- Sun, H., Zhang, B., & Li, Z. 2015, ApJ, 812, 33 [NASA ADS] [CrossRef] [Google Scholar]
- Sun, H., Zhang, B., & Gao, H. 2017, ApJ, 835, 7 [NASA ADS] [CrossRef] [Google Scholar]
- Sun, H., Li, Y., Zhang, B.-B., et al. 2019, ApJ, 886, 129 [NASA ADS] [CrossRef] [Google Scholar]
- Sun, H., Liu, H.-Y., Pan, H.-W., et al. 2022, ApJ, 927, 224 [NASA ADS] [CrossRef] [Google Scholar]
- Tacchella, S., Conroy, C., Faber, S. M., et al. 2022, ApJ, 926, 134 [NASA ADS] [CrossRef] [Google Scholar]
- Tanikawa, A., Giersz, M., & Arca Sedda, M. 2022, MNRAS, 515, 4038 [NASA ADS] [CrossRef] [Google Scholar]
- Taylor, M. A., Eigenthaler, P., Puzia, T. H., et al. 2018, ApJ, 867, L15 [NASA ADS] [CrossRef] [Google Scholar]
- Toma, K., Ioka, K., Yamazaki, R., & Nakamura, T. 2006, ApJ, 640, L139 [NASA ADS] [CrossRef] [Google Scholar]
- Troja, E., van Eerten, H., Zhang, B., et al. 2020, MNRAS, 498, 5643 [NASA ADS] [CrossRef] [Google Scholar]
- Troja, E., O’Connor, B., Ryan, G., et al. 2022, MNRAS, 510, 1902 [Google Scholar]
- Tsvetkov, D. Y., & Bartunov, O. S. 1993, Bulletin d’Information du Centre de Données Stellaires, 42, 17 [Google Scholar]
- Tsvetkova, A., Frederiks, D., Golenetskii, S., et al. 2017, ApJ, 850, 161 [NASA ADS] [CrossRef] [Google Scholar]
- van Dalen, J. N. D., Levan, A. J., Jonker, P. G., et al. 2024, ArXiv e-prints [arXiv:2409.19056] [Google Scholar]
- van der Horst, A. J., Paragi, Z., de Bruyn, A. G., et al. 2014, MNRAS, 444, 3151 [NASA ADS] [CrossRef] [Google Scholar]
- Vito, F., Gilli, R., Vignali, C., et al. 2016, MNRAS, 463, 348 [NASA ADS] [CrossRef] [Google Scholar]
- Wanderman, D., & Piran, T. 2010, MNRAS, 406, 1944 [NASA ADS] [Google Scholar]
- Wanderman, D., & Piran, T. 2015, MNRAS, 448, 3026 [NASA ADS] [CrossRef] [Google Scholar]
- Wang, X.-Y., Li, Z., Waxman, E., & Mészáros, P. 2007, ApJ, 664, 1026 [Google Scholar]
- Wang, J., Zhu, Z. P., Xu, D., et al. 2018, ApJ, 867, 147 [NASA ADS] [CrossRef] [Google Scholar]
- Wang, T., Schreiber, C., Elbaz, D., et al. 2019, Nature, 572, 211 [Google Scholar]
- Waxman, E., & Katz, B. 2017, in Handbook of Supernovae, eds. A. W. Alsabti, & P. Murdin, 967 [CrossRef] [Google Scholar]
- Weiler, K. W., Sramek, R. A., Panagia, N., van der Hulst, J. M., & Salvati, M. 1986, ApJ, 301, 790 [CrossRef] [Google Scholar]
- Wen, S., Jonker, P. G., Stone, N. C., & Zabludoff, A. I. 2021, ApJ, 918, 46 [NASA ADS] [CrossRef] [Google Scholar]
- Whitaker, K. E., Ashas, M., Illingworth, G., et al. 2019, ApJS, 244, 16 [CrossRef] [Google Scholar]
- Wichern, H. C. I., Ravasio, M. E., Jonker, P. G., et al. 2024, A&A, 690, A101 [NASA ADS] [CrossRef] [EDP Sciences] [Google Scholar]
- Wiersema, K., Savaglio, S., Vreeswijk, P. M., et al. 2007, A&A, 464, 529 [NASA ADS] [CrossRef] [EDP Sciences] [Google Scholar]
- Willingale, R., & Mészáros, P. 2017, Space Sci. Rev., 207, 63 [NASA ADS] [CrossRef] [Google Scholar]
- Wright, G. S., Rieke, G. H., Glasse, A., et al. 2023, PASP, 135, 048003 [NASA ADS] [CrossRef] [Google Scholar]
- Xiang, D., Wang, X., Lin, W., et al. 2021, ApJ, 910, 42 [NASA ADS] [CrossRef] [Google Scholar]
- Xiao, D., Zhang, B.-B., & Dai, Z.-G. 2019, ApJ, 879, L7 [NASA ADS] [CrossRef] [Google Scholar]
- Xiao, M. Y., Elbaz, D., Gómez-Guijarro, C., et al. 2023, A&A, 672, A18 [NASA ADS] [CrossRef] [EDP Sciences] [Google Scholar]
- Xu, F., Huang, Y.-F., & Geng, J.-J. 2023, A&A, 679, A103 [NASA ADS] [CrossRef] [EDP Sciences] [Google Scholar]
- Xue, Y. Q. 2017, New Astron. Rev., 79, 59 [Google Scholar]
- Xue, Y. Q., Luo, B., Brandt, W. N., et al. 2016, ApJS, 224, 15 [Google Scholar]
- Xue, Y. Q., Zheng, X. C., Li, Y., et al. 2019, Nature, 568, 198 [NASA ADS] [CrossRef] [Google Scholar]
- Yu, Y.-W., Zhang, B., & Gao, H. 2013, ApJ, 776, L40 [CrossRef] [Google Scholar]
- Yuan, W., Zhang, C., Chen, Y., & Ling, Z. 2022, in Handbook of X-ray and Gamma-ray Astrophysics, eds. C. Bambi, & A. Sangangelo, 86 [Google Scholar]
- Zafar, T., Watson, D., Fynbo, J. P. U., et al. 2011, A&A, 532, A143 [CrossRef] [EDP Sciences] [Google Scholar]
- Zauderer, B. A., Berger, E., Soderberg, A. M., et al. 2011, Nature, 476, 425 [NASA ADS] [CrossRef] [Google Scholar]
- Zauderer, B. A., Berger, E., Margutti, R., et al. 2013, ApJ, 767, 152 [NASA ADS] [CrossRef] [Google Scholar]
- Zhang, B. 2013, ApJ, 763, L22 [NASA ADS] [CrossRef] [Google Scholar]
- Zhang, B. 2018, The Physics of Gamma-Ray Bursts (Cambridge: Cambridge Univeristy Press) [Google Scholar]
- Zhang, B., & Mészáros, P. 2001, ApJ, 552, L35 [CrossRef] [Google Scholar]
- Zhang, B., Fan, Y. Z., Dyks, J., et al. 2006, ApJ, 642, 354 [Google Scholar]
- Zhang, B. B., Zhang, B., Sun, H., et al. 2018, Nat. Commun., 9, 447 [NASA ADS] [CrossRef] [Google Scholar]
- Zhao, Y.-N., & Shao, L. 2014, ApJ, 789, 74 [NASA ADS] [CrossRef] [Google Scholar]
- Zheng, X. C., Xue, Y. Q., Brandt, W. N., et al. 2017, ApJ, 849, 127 [NASA ADS] [CrossRef] [Google Scholar]
Appendix A: early afterglow in the on-axis scenario
We consider whether CDF-S XT1 could be related to an on-axis early afterglow, supported by the shape of its X-ray light curve, which matches some model predictions (e.g., Sari 1999). Under this scenario, the early afterglow should come from the deceleration of the jet emission by the interaction with the circumburst medium. Furthermore, we assume that the X-ray emission does not have contamination from GRB prompt emission or flaring episodes from any central engine (Ghirlanda et al. 2018). The deceleration time, considering the fireball model and a constant-density hydrogen medium, is defined as (Sari 1999; Ghirlanda et al. 2018):
 (A.1)
(A.1)
where Ek, Γ0, n0, and z are the kinetic energy, initial Lorentz factor, number density of the ISM, and redshift, respectively. Here, the parameter space covered by LGRBs and SGRBs is Ek ∼ 1050 − 1053 erg (Piran 2004; Fong et al. 2015; Berger 2014), Γ0 ∼ 50 − 1000 (Racusin et al. 2011), and an ISM number density of n ∼ 10−2 − 10 cm−3 (Schulze et al. 2011; Berger 2014; Salafia & Ghirlanda 2022). Figure A.3 shows the color-coded deceleration time as a function of the initial Lorentz factor and kinetic energy, assuming three different ISM densities.
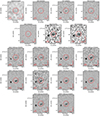 |
Fig. A.1. The complete version of Fig. 1. HST and JWST imaging of CDF-S XT1 at different filters (one per panel). The red circle depicts the 2σ X-ray position uncertainty of CDF-S XT1, while the cyan dot shows the position of the host according to JADES. |
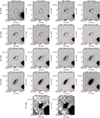 |
Fig. A.2. The complete version of Fig. 2. HST and JWST imaging of CDF-S XT2 at different filters (one per panel). The red circle depicts the 2σ X-ray position uncertainty of CDF-S XT2, while the cyan dot shows the position of the host according to JADES. |
Appendix B: redshift discrepancy for CDF-S XT2
The redshift z = 0.7382 reported by Balestra et al. (2010) for the host of CDF-S XT2 is clearly in conflict with the new redshift from JWST, shown in Fig. 3. Here, we investigate the veracity of the previous redshift, which was regarded as of high quality. We began by examining the VLT-VIMOS (three exposures taken between 04:03:10.24 and 04:10:12.50 on 2004-11-17; PI Cesarsky) slit position and slit images to ascertain how the data reported by Balestra et al. (2010) were taken.13 Notably, the slits in the three images are all  , centered on an elliptical galaxy (CANDELS #4210) hosting an X-ray AGN at z = 0.7396 (see Fig. B.1, left panel). This galaxy lies ≈2″ to the southwest of XT2’s identified host, which also falls within the slit, and was extracted as a secondary target by Balestra et al. (2010). Given the proximity of the two objects, there is potential for contamination. The VLT-VIMOS spectra reported by Balestra et al. (2010) of the CANDELS #4210 and host of CDF-S XT2 are shown in Fig. B.2, as well as the most important emission lines used to measure their redshifts.14
HST-ACS/WFC3 and JWST-NIRCam photometric data of the FXT XT1.
To concretely confirm the contamination scenario, we examine this location with the deep MUSE dataset (Wisotzki PI) from Inami et al. (2017) and Herenz et al. (2017). We obtained the reduced (ESO MUSE pipeline v2.8.6) and calibrated MUSE data from the ESO archive15. Moreover, we use the Zurich Atmosphere Purge (ZAPv2.1; Soto et al. 2016) on the data cubes, which is a high precision subtraction tool to improve the already performed sky subtraction16. We improved the astrometry of the MUSE data cube by detecting sources in the collapsed white-light image and aligning them with matched objects in the CANDELS catalog (Guo et al. 2013). Using PyMUSE (Pessa et al. 2018), we then created a narrow-band image centered at λcen = 6478 ± 5Å to probe the rest-frame [OII] emission line at z = 0.738 − 0.740 (Figure B.1) and a white-light image (Figure B.1). CANDELS #4210 is robustly detected in both, while the host of XT2 is not visible in either. The absence of an emission line at the position of XT2’s host supports the contamination scenario. Finally, we extracted MUSE spectra at the positions of CANDELS #4210 and the host of CDF-S XT2 using the file viewer package QFitsView (Ott 2012) considering a circular aperture of 5 pixels, subtracting a background spectrum extracted in a region free of known sources in the JWST image. Figure B.2 depicts these spectra (shown in green), where the [OII] emission line λcen = 6478Å reported by Balestra et al. (2010) is not found, despite the MUSE data having sufficient sensitivity to detect it at moderate significance. Thus, we conclude that the reported redshift of z = 0.7382 is not supported, confirming the result obtained by the JWST spectra.
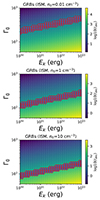 |
Fig. B.1. Parameter space exploration between the initial Lorentz factor, kinetic energy, and deceleration time (color coded) under the early afterglow scenario for three distinct uniform-density ISM regimes (from top to bottom: 10−2, 1 and 10 cm−3. As explained in §A, to explore this possibility, we assume a plausible range of parameters for GRBs using Eq. A.1. The red markers represent the condition tdec ≈ tX, peak = 110 ± 50 s. |
HST-ACS/WFC3, JWST-NIRCam and JWST-MIRI photometric data of the FXT XT2.
Parameters considered for fitting HST+JWST photometric data of CDF-S XT1 and XT2 host galaxies.
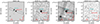 |
Fig. B.2. VIMOS slit-position and MUSE multiwavelength images of the field of CDF-S XT2. Left panel: JWST-F444W imaging superimposed with the VLT-VIMOS slits (black box) used by Balestra et al. (2010) for determining the redshift of XT2 and the nearby AGN CANDELS #4210. Left-center panel: MUSE collapsed imaging at [OII] emission line (i.e., λcen = 6478 Å, width 10 Å) of the field of XT2, where according to Balestra et al. (2010) the line [OII] of XT2’s is detected by VLT-VIMOS. The AGN CANDELS #4210 is clearly detected (consistent with a [OII] line at z = 0.7396). Right-center panel: MUSE white-light image showing the position of the XT2 host and AGN CANDELS #4210. The cyan and red dots depict the position of the XT2 host and AGN CANDELS #4210, respectively. Right panel: MUSE collapsed imaging at the Ly-α emission line (i.e., λcen = 1216 Å, width 10 Å) of the field of XT2 at redshift zspec = 3.4598. At these wavelengths, the XT2 host is not observed. The cyan and red dots depict the position of the XT2 host and AGN CANDELS #4210, respectively. |
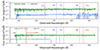 |
Fig. B.3. VLT/VIMOS (blue lines) and MUSE (green lines) spectra of the nearby AGN CANDELS #4210 (top panel) and the host of XT2 (bottom panel) obtained by Balestra et al. (2010). Moreover, both spectra show the most important emission lines (vertical dashed lines) used by Balestra et al. (2010) to determine the spectroscopic redshift of the AGN CANDELS #4210 (z = 0.7396; [OII], Hβ and [OIII]) and XT2’s host (z = 0.7382; [OII], and MgII). On the other hand, the MUSE spectrum of the nearby AGN CANDELS #4210 shows the [OII], Hβ and [OIII] emission lines, confirming the reported redshift of Balestra et al. (2010) (z = 0.7396). However, the subtracted spectrum at the position of the XT2 host does not display the [OII] and MgII lines reported by Balestra et al. (2010). Finally, the MUSE spectrum of the XT2 host does not show the expected Lymanα line at redshift zspec = 3.4598 (vertical red solid line). |
All Tables
X-ray properties taken from the literature of the two extragalactic FXTs considered in this work.
Comparison of host parameters obtained from the literature and by our SED fitting using the Bagpipes (Carnall et al. 2018) and Prospector (Leja et al. 2017) packages.
Parameters considered for fitting HST+JWST photometric data of CDF-S XT1 and XT2 host galaxies.
All Figures
|
Fig. 1. HST and JWST imaging of CDF-S XT1 at three different filters (one per panel) for illustration. The red circle depicts the 2σ X-ray position uncertainty of CDF-S XT1, while the cyan dot shows the position of the host according to JADES. Figure A.1 shows the complete version of this figure. |
| In the text | |
|
Fig. 2. HST and JWST imaging of CDF-S XT2 at three different filters (one per panel) for illustration. The red circle depicts the 2σ X-ray position uncertainty of CDF-S XT1, while the cyan dot shows the position of the host according to JADES. Figure A.2 shows the complete version of this figure. |
| In the text | |
|
Fig. 3. JWST spectrum of the host galaxy of CDF-S XT2 in the observed and rest frames. Dashed vertical lines depict the most important emission lines. According to the emission lines, this galaxy is consistent with a redshift of zspec = 3.4598. |
| In the text | |
|
Fig. 4. Best-fitting SED models from Bagpipes and Prospector for the hosts associated with CDF-S XT1 (left) and XT2 (right). The photometric data and their 1-σ uncertainties are marked by the blue markers, while the triangle depicts 3-σ upper limits. Moreover, the relative transmission functions of the different filters are in the bottom panels (colored curves). |
| In the text | |
|
Fig. 5. CDFs of the posterior distributions of CDF-S XT1 (top panels) and XT2 (bottom panels) for photometric redshift (just CDF-S XT1), log(M*/M⊙), log(SFR) in M⊙ yr−1, log(sSFR) in yr−1, and AV in mag. The different colors depict the posterior distribution from Prospector (red) or Bagpipes (blue), respectively, while the color regions depict the 68% confidence level. |
| In the text | |
|
Fig. 6. BXA fit of the phabs*zphabs*pow model to the Chandra X-ray data of CDF-S XT1 (left) and XT2 (right), where the darker (lighter) blue-filled bands enclose 68% (98%) of the posterior. The Galactic hydrogen column density and redshift are fixed parameters during the fitting process (see Table 3). |
| In the text | |
|
Fig. 7. 0.3−10 keV light curves of CDF-S XT1 and XT2 in luminosity units (marked in red). Also shown are the X-ray afterglow light curves of 64 LGRBs plus 32 SGRBs (Bernardini et al. 2012; Lü et al. 2015), as well as several individual transients are overplotted: the shock-breakout supernova XRF 080109-SN 2008D (cyan line, 27 Mpc), the X-ray flashes XRF 060218-SN 2006aj (blue line, 145 Mpc) and XRF 100316D-SN 2010bh (green line, 263 Mpc; Barniol Duran et al. 2015; Starling et al. 2011; Modjaz et al. 2009; Evans et al. 2007, 2009; Soderberg et al. 2008; Campana et al. 2006), and the relativistically beamed TDE Swift J1644+57 (black line, z = 0.3543; Bloom et al. 2011; Levan et al. 2011). The reference time for both FXTs is the arrival time of the first photon to the detector, while for GRBs, Swift J1644+57, and X-ray flashes their reference time are based on their initial gamma-ray detections. |
| In the text | |
|
Fig. 8. Left: R-band optical light curves of CDF-S XT1 (red) compared to long and short GRBs (Kann et al. 2006, 2010, 2011; Nicuesa Guelbenzu et al. 2012), the SBO SN 2008D (Soderberg et al. 2008), the low-luminosity events XRF 060218-SN 2006aj and XRF 100316D-SN 2010BH, the relativistic Ic-BL SN 2018gep (Ho et al. 2019), LFBOT AT2018cow (Xiang et al. 2021), and Type II-pec SN 1987A (50 kpc), SN 1999br (7.1 Mpc) and Type II-P SN 2005cs (8.6 Mpc). The HST F110W constraint at 111 days is displayed for the range mR − mF110W ≈ 0.4 − 1.0 mag typical of GRBs (Kann et al. 2006, 2010, 2011). Right: 9 GHz upper limit of CDF-S XT1 (red) compared to low-frequency (1−10 GHz) light curves of different classes of energetic explosions such as TDEs (Zauderer et al. 2011, 2013; Berger et al. 2012; Alexander et al. 2016; Eftekhari et al. 2018), SNe exploding in dense circumstellar medium (Soderberg et al. 2005; Salas et al. 2013) and normal SNe (Weiler et al. 1986), relativistic Ic-BL SNe (Kulkarni et al. 1998; Soderberg et al. 2010), LGRBs (GRB 030329A, GRB 111209A, and GRB 130427A; Berger et al. 2003; Hancock et al. 2012; Perley et al. 2014; van der Horst et al. 2014), and luminous fast blue optical objects (LFBOTs; Margutti et al. 2019; Coppejans et al. 2020; Ho et al. 2020a). |
| In the text | |
|
Fig. 9. Comparison of the host-galaxy properties of CDF-S XT1 and XT2 with the cumulative distributions of galaxy stellar mass (left panel) and star-formation rate (right panel) for LGRBs (Li et al. 2016; Blanchard et al. 2016), SGRBs (Fong et al. 2010, 2012, 2014; Margutti et al. 2012; Sakamoto et al. 2013; Berger et al. 2013; Fong et al. 2022; Nugent et al. 2022), FRBs (Heintz et al. 2020), CC-SNe and Ia-SNe (Tsvetkov & Bartunov 1993; Prieto et al. 2008; Galbany et al. 2014), low-luminosity LGRBs (GRB 980425, GRB 020903, GRB 030329, GRB 031203, GRB 050826, GRB 060218, GRB 100316D, GRB 111005A, and GRB 171205A; Christensen et al. 2008; Michałowski et al. 2014; Levesque 2014; Krühler et al. 2017; Wiersema et al. 2007; Izzo et al. 2017; Wang et al. 2018; MichałowskI et al. 2018; Arabsalmani et al. 2019), and SLSNe (Schulze et al. 2021). The dashed vertical lines depict the mean values of CDF-S XT1 (red vertical lines) and XT2 (blue vertical lines). |
| In the text | |
|
Fig. 10. JWST-NIRSpec 2D and 1D spectra per pixel of the host galaxy of CDF-S XT2. Top-left panel: Single-pixel row-extraction spectra through resolved spatial regions of the XT2 host galaxy. Bottom-left panel: 2D spectra in pixel units of the host galaxy of CDF-S XT2. Horizontal dashed lines depict the pixel positions of the single row-extraction spectra shown in the top-left panel. The 2D is compared to the right panel (North is up). Right panel: RGB (F090W, F200W, and F444W) image of the host of CDF-S XT2, identical in size to Fig. 2, indicating the NIRSpec slit position. The magenta rectangle denotes the region of dispersed spectra shown in the bottom-left panel, while the white rectangles are regions to assess the background and the red circle depicts 1-σ X-ray positional uncertainty of CDF-S XT2. |
| In the text | |
|
Fig. 11. JWST single-pixel spectral parameters obtained by our SED fitting using the Bagpipes package (Carnall et al. 2018, 2019) from pixel 13 to pixel 17 assuming the SED model from Table B.3. The figure depicts the star-formation rate (top panel), stellar mass (2nd panel, in units of 1010 M⊙), mass-weighted age (third panel), and dust attenuation (bottom panel) per pixel. The uncertainties were computed from the posterior distributions at a 99.9% confidence level. |
| In the text | |
|
Fig. 12. Estimated local density rate comparison between XT1- and XT2-like objects (derived in this work) and the merger rate of neutron star and BH systems ( |
| In the text | |
|
Fig. A.1. The complete version of Fig. 1. HST and JWST imaging of CDF-S XT1 at different filters (one per panel). The red circle depicts the 2σ X-ray position uncertainty of CDF-S XT1, while the cyan dot shows the position of the host according to JADES. |
| In the text | |
|
Fig. A.2. The complete version of Fig. 2. HST and JWST imaging of CDF-S XT2 at different filters (one per panel). The red circle depicts the 2σ X-ray position uncertainty of CDF-S XT2, while the cyan dot shows the position of the host according to JADES. |
| In the text | |
|
Fig. B.1. Parameter space exploration between the initial Lorentz factor, kinetic energy, and deceleration time (color coded) under the early afterglow scenario for three distinct uniform-density ISM regimes (from top to bottom: 10−2, 1 and 10 cm−3. As explained in §A, to explore this possibility, we assume a plausible range of parameters for GRBs using Eq. A.1. The red markers represent the condition tdec ≈ tX, peak = 110 ± 50 s. |
| In the text | |
|
Fig. B.2. VIMOS slit-position and MUSE multiwavelength images of the field of CDF-S XT2. Left panel: JWST-F444W imaging superimposed with the VLT-VIMOS slits (black box) used by Balestra et al. (2010) for determining the redshift of XT2 and the nearby AGN CANDELS #4210. Left-center panel: MUSE collapsed imaging at [OII] emission line (i.e., λcen = 6478 Å, width 10 Å) of the field of XT2, where according to Balestra et al. (2010) the line [OII] of XT2’s is detected by VLT-VIMOS. The AGN CANDELS #4210 is clearly detected (consistent with a [OII] line at z = 0.7396). Right-center panel: MUSE white-light image showing the position of the XT2 host and AGN CANDELS #4210. The cyan and red dots depict the position of the XT2 host and AGN CANDELS #4210, respectively. Right panel: MUSE collapsed imaging at the Ly-α emission line (i.e., λcen = 1216 Å, width 10 Å) of the field of XT2 at redshift zspec = 3.4598. At these wavelengths, the XT2 host is not observed. The cyan and red dots depict the position of the XT2 host and AGN CANDELS #4210, respectively. |
| In the text | |
|
Fig. B.3. VLT/VIMOS (blue lines) and MUSE (green lines) spectra of the nearby AGN CANDELS #4210 (top panel) and the host of XT2 (bottom panel) obtained by Balestra et al. (2010). Moreover, both spectra show the most important emission lines (vertical dashed lines) used by Balestra et al. (2010) to determine the spectroscopic redshift of the AGN CANDELS #4210 (z = 0.7396; [OII], Hβ and [OIII]) and XT2’s host (z = 0.7382; [OII], and MgII). On the other hand, the MUSE spectrum of the nearby AGN CANDELS #4210 shows the [OII], Hβ and [OIII] emission lines, confirming the reported redshift of Balestra et al. (2010) (z = 0.7396). However, the subtracted spectrum at the position of the XT2 host does not display the [OII] and MgII lines reported by Balestra et al. (2010). Finally, the MUSE spectrum of the XT2 host does not show the expected Lymanα line at redshift zspec = 3.4598 (vertical red solid line). |
| In the text | |
Current usage metrics show cumulative count of Article Views (full-text article views including HTML views, PDF and ePub downloads, according to the available data) and Abstracts Views on Vision4Press platform.
Data correspond to usage on the plateform after 2015. The current usage metrics is available 48-96 hours after online publication and is updated daily on week days.
Initial download of the metrics may take a while.