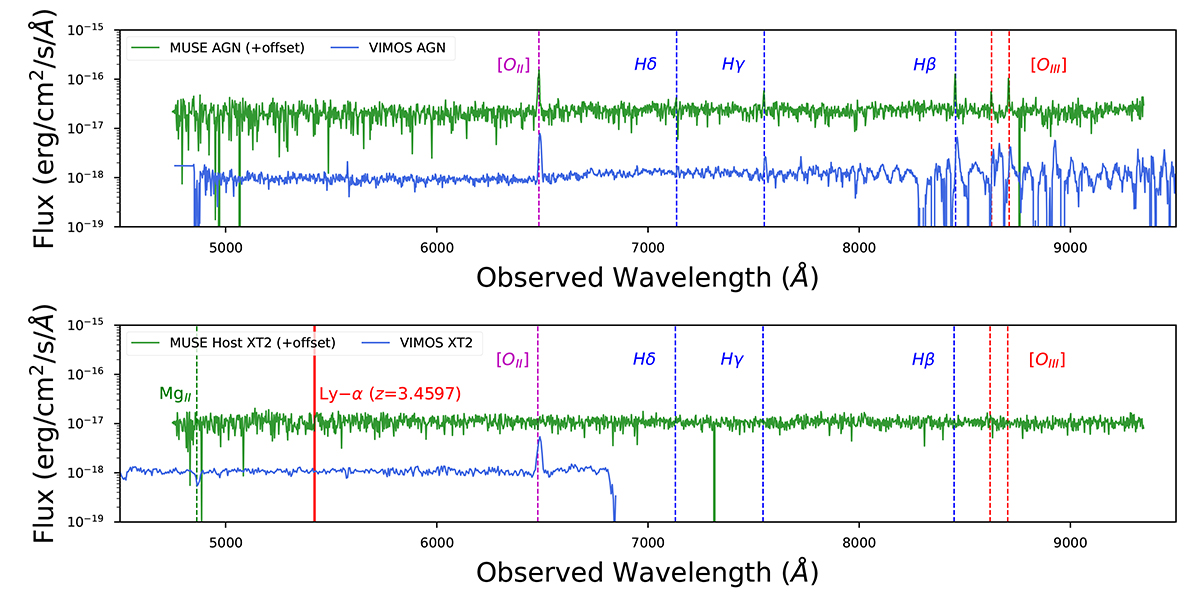
Fig. B.3.
Download original image
VLT/VIMOS (blue lines) and MUSE (green lines) spectra of the nearby AGN CANDELS #4210 (top panel) and the host of XT2 (bottom panel) obtained by Balestra et al. (2010). Moreover, both spectra show the most important emission lines (vertical dashed lines) used by Balestra et al. (2010) to determine the spectroscopic redshift of the AGN CANDELS #4210 (z = 0.7396; [OII], Hβ and [OIII]) and XT2’s host (z = 0.7382; [OII], and MgII). On the other hand, the MUSE spectrum of the nearby AGN CANDELS #4210 shows the [OII], Hβ and [OIII] emission lines, confirming the reported redshift of Balestra et al. (2010) (z = 0.7396). However, the subtracted spectrum at the position of the XT2 host does not display the [OII] and MgII lines reported by Balestra et al. (2010). Finally, the MUSE spectrum of the XT2 host does not show the expected Lymanα line at redshift zspec = 3.4598 (vertical red solid line).
Current usage metrics show cumulative count of Article Views (full-text article views including HTML views, PDF and ePub downloads, according to the available data) and Abstracts Views on Vision4Press platform.
Data correspond to usage on the plateform after 2015. The current usage metrics is available 48-96 hours after online publication and is updated daily on week days.
Initial download of the metrics may take a while.