Fig. B.2.
Download original image
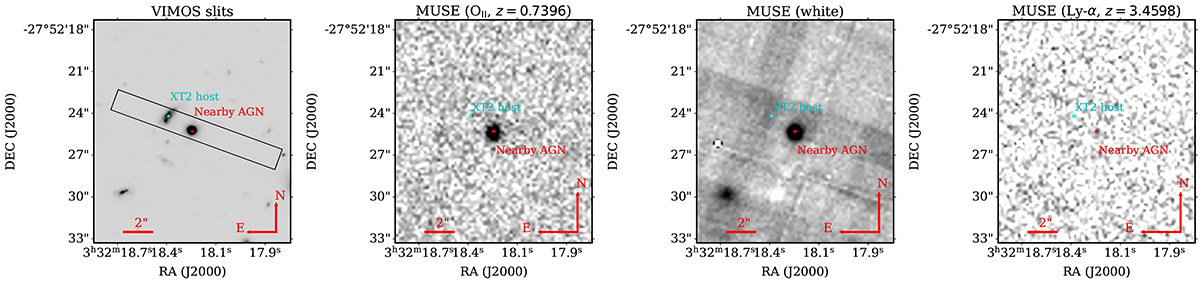
VIMOS slit-position and MUSE multiwavelength images of the field of CDF-S XT2. Left panel: JWST-F444W imaging superimposed with the VLT-VIMOS slits (black box) used by Balestra et al. (2010) for determining the redshift of XT2 and the nearby AGN CANDELS #4210. Left-center panel: MUSE collapsed imaging at [OII] emission line (i.e., λcen = 6478 Å, width 10 Å) of the field of XT2, where according to Balestra et al. (2010) the line [OII] of XT2’s is detected by VLT-VIMOS. The AGN CANDELS #4210 is clearly detected (consistent with a [OII] line at z = 0.7396). Right-center panel: MUSE white-light image showing the position of the XT2 host and AGN CANDELS #4210. The cyan and red dots depict the position of the XT2 host and AGN CANDELS #4210, respectively. Right panel: MUSE collapsed imaging at the Ly-α emission line (i.e., λcen = 1216 Å, width 10 Å) of the field of XT2 at redshift zspec = 3.4598. At these wavelengths, the XT2 host is not observed. The cyan and red dots depict the position of the XT2 host and AGN CANDELS #4210, respectively.
Current usage metrics show cumulative count of Article Views (full-text article views including HTML views, PDF and ePub downloads, according to the available data) and Abstracts Views on Vision4Press platform.
Data correspond to usage on the plateform after 2015. The current usage metrics is available 48-96 hours after online publication and is updated daily on week days.
Initial download of the metrics may take a while.