Open Access
Fig. 1.
Download original image
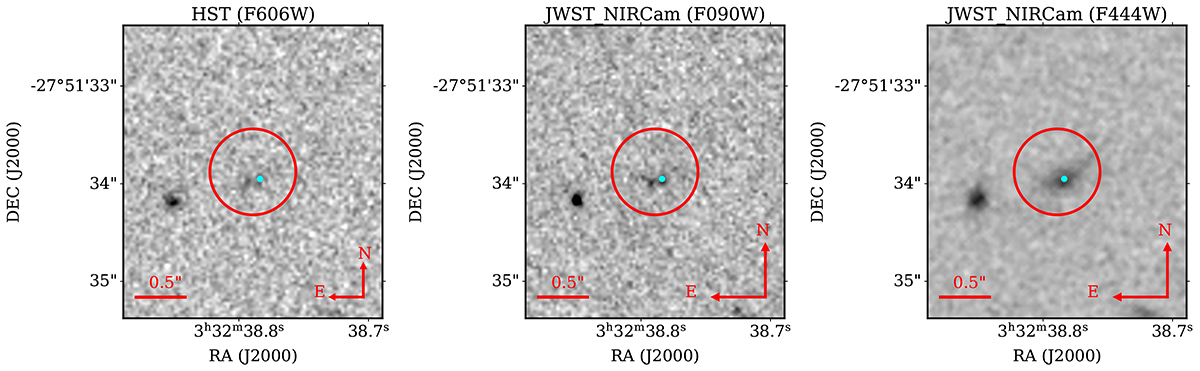
HST and JWST imaging of CDF-S XT1 at three different filters (one per panel) for illustration. The red circle depicts the 2σ X-ray position uncertainty of CDF-S XT1, while the cyan dot shows the position of the host according to JADES. Figure A.1 shows the complete version of this figure.
Current usage metrics show cumulative count of Article Views (full-text article views including HTML views, PDF and ePub downloads, according to the available data) and Abstracts Views on Vision4Press platform.
Data correspond to usage on the plateform after 2015. The current usage metrics is available 48-96 hours after online publication and is updated daily on week days.
Initial download of the metrics may take a while.