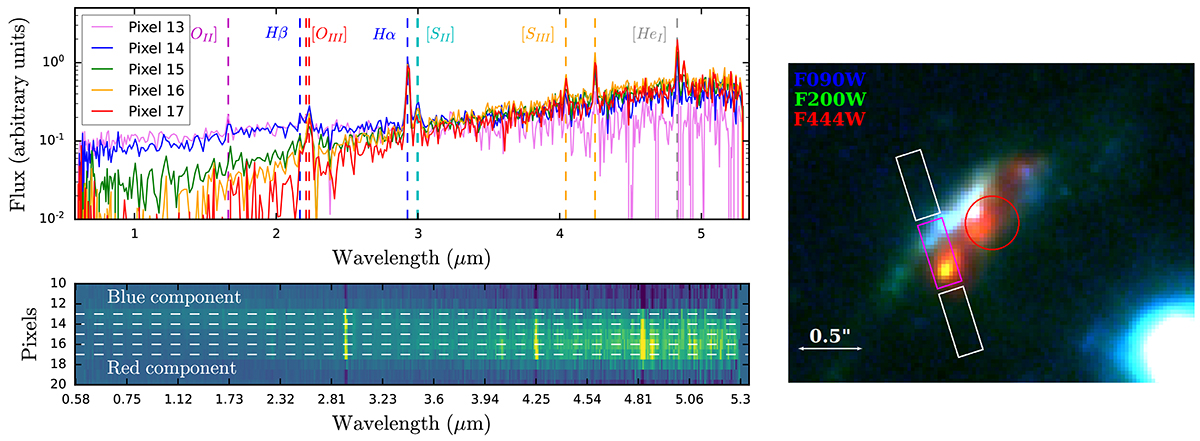
Fig. 10.
Download original image
JWST-NIRSpec 2D and 1D spectra per pixel of the host galaxy of CDF-S XT2. Top-left panel: Single-pixel row-extraction spectra through resolved spatial regions of the XT2 host galaxy. Bottom-left panel: 2D spectra in pixel units of the host galaxy of CDF-S XT2. Horizontal dashed lines depict the pixel positions of the single row-extraction spectra shown in the top-left panel. The 2D is compared to the right panel (North is up). Right panel: RGB (F090W, F200W, and F444W) image of the host of CDF-S XT2, identical in size to Fig. 2, indicating the NIRSpec slit position. The magenta rectangle denotes the region of dispersed spectra shown in the bottom-left panel, while the white rectangles are regions to assess the background and the red circle depicts 1-σ X-ray positional uncertainty of CDF-S XT2.
Current usage metrics show cumulative count of Article Views (full-text article views including HTML views, PDF and ePub downloads, according to the available data) and Abstracts Views on Vision4Press platform.
Data correspond to usage on the plateform after 2015. The current usage metrics is available 48-96 hours after online publication and is updated daily on week days.
Initial download of the metrics may take a while.