| Issue |
A&A
Volume 694, February 2025
|
|
|---|---|---|
| Article Number | A163 | |
| Number of page(s) | 13 | |
| Section | Galactic structure, stellar clusters and populations | |
| DOI | https://doi.org/10.1051/0004-6361/202452848 | |
| Published online | 11 February 2025 | |
Evolution of the disky second generation of stars in globular clusters on cosmological timescales
1
Nicolaus Copernicus Astronomical Centre Polish Academy of Sciences,
ul. Bartycka 18,
00-716
Warsaw,
Poland
2
Main Astronomical Observatory, National Academy of Sciences of Ukraine,
27 Akademika Zabolotnoho St,
03143
Kyiv,
Ukraine
3
Konkoly Observatory, Research Centre for Astronomy and Earth Sciences, HUN-REN CSFK, MTA Centre of Excellence,
Konkoly Thege Miklós út 15–17,
1121
Budapest,
Hungary
4
Fesenkov Astrophysical Institute,
Observatory 23,
050020
Almaty,
Kazakhstan
5
Rudolf Peierls Centre for Theoretical Physics,
Parks Road,
OX1 3PU,
Oxford,
UK
★ Corresponding author; This email address is being protected from spambots. You need JavaScript enabled to view it.
Received:
1
November
2024
Accepted:
2
January
2025
Abstract
Context. Many Milky Way globular clusters (GCs) host multiple stellar populations, challenging the traditional view that GCs are single-population systems. It has been suggested that second-generation stars could form in a disk from gas lost by first-generation stars or from external accreted gas. Understanding how these multiple stellar populations evolve under a time-varying Galactic tidal field is crucial for studying internal mixing, the rotational properties, and mass loss of GCs over cosmological timescales.
Aims. We investigated how the introduction of a second stellar generation affects mass loss’ internal mixing, and rotational properties of GCs in a time-varying Galactic tidal field and different orbital configurations.
Methods. We conducted direct N-body simulations of GCs on three types of orbits derived from the observed Milky Way GCs using state-of-the-art stellar evolution prescriptions. We evolved the clusters for 8 Gyr in the time-varying Galactic potential of the IllustrisTNG-100 cosmological simulation. After 2 Gyr, we introduced a second stellar generation, comprising 5% of the initial mass of the first generation, as a flattened disk of stars. For comparison, we ran control simulations using a static Galactic potential and isolated clusters.
Results. We present here the mass loss, structural evolution, and kinematic properties of GCs with two stellar generations, focusing on tidal mass’ half-mass radii, velocity distributions, and angular momentum. We also examine the transition of the second generation from a flattened disk to a spherical shape.
Conclusions. Our results show that the mass loss of GCs depends primarily on their orbital parameters, with tighter orbits leading to higher mass loss. The growth of the Galaxy led to tighter orbits’ implying that the GCs lost much less mass than if the Galaxy had always had its current mass. The initially flattened second-generation disk became nearly spherical within one relaxation time. However, whether its distinct rotational signature was retained depends on the orbit: for the long radial orbit, it vanished quickly; for the tube orbit' it lasted several billion years for the circular orbit' rotation persisted until the present day.
Key words: methods: numerical / Galaxy: center / Galaxy: general / globular clusters: general
© The Authors 2025
 Open Access article, published by EDP Sciences, under the terms of the Creative Commons Attribution License (https://creativecommons.org/licenses/by/4.0), which permits unrestricted use, distribution, and reproduction in any medium, provided the original work is properly cited.
This article is published in open access under the Subscribe to Open model. This email address is being protected from spambots. You need JavaScript enabled to view it. to support open access publication.
1 Introduction
According to the standard ΛCDM model, Milky Way (MW) globular clusters (GCs) were among the first bound stellar systems that formed in the early Universe; they have typical ages of about 10–12 Gyr (Weinberg 1993). Originally, globular clusters were described as spherical systems formed during a single star formation episode. However, over the last two decades, it has become clear that most globular clusters show evidence of multiple stellar populations (Bastian & Lardo 2018; Milone & Marino 2022, and references therein), and at least 20–30 of the globular clusters in the MW exhibit internal rotation (Bellazzini et al. 2012; Bianchini et al. 2013; Fabricius et al. 2014; Kacharov et al. 2014; Kimmig et al. 2015; Lardo et al. 2015; Boberg et al. 2017; Jeffreson et al. 2017; Ferraro et al. 2018; Kamann et al. 2018; Lanzoni et al. 2018; Bianchini et al. 2018; Sollima et al. 2019; Cordoni et al. 2020; Vasiliev & Baumgardt 2021; Petralia et al. 2024). Modelling the evolution of multiple stellar populations over cosmic time is crucial for understanding globular cluster formation, and for the observed anomalous element distributions and internal anisotropic structures (e.g. Hénault-Brunet et al. 2015; Cordero et al. 2017; Cordoni et al. 2020; Scalco et al. 2023; Martens et al. 2023; Libralato et al. 2023; McKenzie & Bekki 2021; Livernois et al. 2021; Tiongco et al. 2021; Mastrobuono-Battisti & Perets 2021; Szigeti et al. 2021; Vesperini et al. 2021; Lacchin et al. 2022; Cordoni et al. 2023).
The origin of the observed multiple population is not clear (see e.g. Renzini et al. 2015; Bastian & Lardo 2018; Gratton et al. 2019). Second-generation (ɡ2) stars could have formed from gas lost from earlier first-generation (ɡ1) stars and/or from external accreted gas. It is generally accepted that (ɡ2) stars form from gas that collapsed into a cooling flow, possibly forming a disk (D’Ercole et al. 2008; Calura et al. 2019; McKenzie & Bekki 2021; Lacchin et al. 2022). In particular, Bekki (2010) demonstrated that ɡ2 stars, formed from asymptotic giant branch (AGB) ejecta of ɡ1 stars, could develop significant rotation with a rotation rate depending on the initial kinematics of the ɡ1 stars. More recently, Lacchin et al. (2022) found that under specific conditions, such as low external gas density, ɡ2 stars can form a rapidly rotating disk-like structure, often with higher rotational speeds than the ɡ1 stars. Additionally, McKenzie & Bekki (2021) highlighted the role of pristine gas accretion from the host galaxy in enhancing the rotational characteristics of ɡ2 stars. The present-day rotation is likely a remnant of a higher degree of earlier rotation (Mapelli 2017; Bianchini et al. 2018; Kamann et al. 2018; Sollima et al. 2019; Tiongco et al. 2021; Livernois et al. 2021).
Stronger evidence for star formation in disks comes from nuclear star clusters (NSCs), where young stellar generations can be observed today (Levin & Beloborodov 2003; Paumard et al. 2006; Neumayer et al. 2020). In NSCs stars may form due to fragmentation of a gaseous accretion disk (Levin & Beloborodov 2003; Levin 2007), the collapse of a giant molecular cloud (Bonnell & Rice 2008; Generozov et al. 2022), or through the capture of stars by the gaseous accretion disk (Panamarev et al. 2018).
Simulations have shown that the initial differences between different subpopulations decrease over time in GCs due to spatial and kinematic mixing on the two-body relaxation timescale (Mastrobuono-Battisti & Perets 2013; Vesperini et al. 2013; Hénault-Brunet et al. 2015; Mastrobuono-Battisti & Perets 2016; Meiron & Kocsis 2018; Tiongco et al. 2019; Vesperini et al. 2021). Additionally, mixing may occur more rapidly in angular momentum space due to vector resonant relaxation (Rauch & Tremaine 1996; Kocsis & Tremaine 2015; Meiron & Kocsis 2019), leading to anisotropic mass segregation, where more massive objects produce a larger anisotropy (Szölgyén et al. 2019; Tiongco et al. 2019, 2021; Livernois et al. 2021, 2022; Wang & Kocsis 2023). Similarly, numerical studies of such stellar disks in galactic nuclei indicate that mixing in angular momentum space occurs on vector resonant relaxation timescales, which are of the order of 10 Myr for the Milky Way NSC (Kocsis & Tremaine 2015; Panamarev & Kocsis 2022). However, full mixing occurs on two-body relaxation timescales, which are much longer (see e.g. Meiron & Kocsis 2018; Panamarev et al. 2019). As a result, due to the conservation of angular momentum, a fully relaxed system will exhibit net rotation.
To study the dynamical evolution of multiple stellar populations in different environments, such as globular clusters, it is essential to perform realistic N-body simulations that incorporate stellar evolution and the effects of a realistic galactic potential. As previously mentioned, globular clusters have been extensively studied over their relaxation timescales. Some of the most realistic simulations, which include both single and binary stellar evolution, are the DRAGON simulations (Wang et al. 2016). These simulations were recently enhanced to incorporate up-to-date stellar evolution prescriptions (Arca Sedda et al. 2024a, 2023, 2024b). However, these models assumed an initially spherically symmetric and isotropic distribution of stars, considered only a single generation of stars, and modelled the clusters on circular orbits within a static galactic potential.
The main idea for this work was to carry out direct N -body simulations of globular clusters with two stellar components within a time-varying Galactic tidal field, exploring different orbital configurations. We began with an initially spherically symmetric and isotropic stellar distribution and then introduced a second, initially geometrically flattened stellar generation. Using state-of-the-art stellar evolution prescriptions, we studied the internal mixing of these systems and assessed the impact of the external potential.
The paper is organised as follows. In Sect. 2, we describe the initial conditions and data for the first and second stellar generations. We also present the description of the integration procedure in external Galactic potentials. In Sect. 3, we present the dynamical evolution of the mass loss for single and multiple generation systems. In Sect. 4, we focus on the second generation, mainly in a context of shape and angular momentum evolution of the generations. In Sect. 5, we summarise our results and outcomes.
Parameters of the external potentials at redshift zero.
2 Initial conditions and models
This work builds on our previous studies, where we analysed the orbits of 159 Galactic GCs using Gaia Data Release 3, integrated them backward in time to reconstruct their orbital evolution on cosmological timescales (Ishchenko et al. 2023a, hereafter Paper I), examined the interaction rates of the GCs with the Galactic centre (Ishchenko et al. 2023b, hereafter Paper II), and investigated their mass loss due to the tidal field in the central region of the Galaxy (Ishchenko et al. 2024, hereafter Paper III). For this study, we selected three different orbits from those obtained in Paper I and initialised a GC on each orbit in time-variable external potential at a lookback time of 8 Gyr. After 2 Gyr of evolution (i.e. at T = −6 Gyr) we introduced a disk of stars representing the second stellar generation. We then evolved the system to the present day. For comparison, we ran the same simulations of the same GCs within a static external potential, and one control simulation of an isolated cluster. In the following, we describe the details of this procedure.
2.1 Galactic potentials and integration procedure
To add more realistic dynamical orbital evolution into our simulations, we extended the standard N-body code (described below) to incorporate time-dependent external potentials derived from the IllustrisTNG-100 (TNG) cosmological simulation database (Nelson et al. 2018, 2019b,a). From this database we selected a time-variable potential TNG denoted as 411321, which closely matches that of the MW at redshift z = 0 in terms of halo and disk masses, and in terms of their characteristic scales. The sampling and fitting procedures for this potential, as well as other MW-like potentials, are discussed in detail in Paper I and Mardini et al. (2020). The key parameters for this potential are summarised in Table 1. The code routines for sampling and fitting the selected potentials are also publicly available on GitHub1.
In addition to the time-variable potential, we performed comparative simulations using a static potential, known as FIX. This potential has constant parameters throughout the simulation and using the three-component (bulge-disk-halo) axisymmetric Plummer-Kuzmin model (Miyamoto & Nagai 1975). The parameters for both the static potential FIX and the TNG are provided in Table 1.
For the dynamical evolution of GCs, we used the high-order parallel dynamical N-body code φ–GPU2. This code is based on the fourth-order Hermite integration scheme with hierarchical individual block time steps (Berczik et al. 2011, 2013). The current version of the code also incorporates the recently updated stellar evolution models (Banerjee et al. 2020). The most important updates were made in stellar evolution: metallicity dependent stellar winds; metallicity dependent core-collapse supernovae, new fallback prescription, and their remnant masses; electron-capture supernovae accretion, induced collapse, and merger-induced collapse; remnant masses and natal kicks; black hole (BH) natal spins. For more details on the current stellar evolution library, we refer to Kamlah et al. (2022a,b).
We applied a Plummer softening parameter for inner spatial resolution to є = 0.01 pc. Additionally, we ignored the effects of dynamical friction, which, as shown by Just et al. (2011), significantly affects only clusters very close to the Galactic centre3.
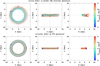 |
Fig. 1 Circular orbit in 411321 TNG (top row) and FIX external potentials (bottom row). Time is colour-coded (see colour bar at right). The red dots represent the GC’s position at up to 8 Gyr in lookback time; the blue dots are the current position. |
2.2 First stellar generation
As a basis for our current study, we used the set of reconstructed orbits for real MW GCs obtained in Paper I. In that study we integrated orbits with up to 10 Gyr lookback time for the 159 GCs with initial positions, proper motions, radial velocities, and geocentric distances from Baumgardt & Vasiliev (2021), which is based on the Gaia DR3 catalogue. Visualisations for all the simulated GCs can also be found online4.
For the multi-generation GC models, we examined the evolution of GCs on three types of orbit families in the host galaxy: a circular (CR) orbit, a tube (TB) orbit, and a long radial (LR) orbit. As prototypes for these types of MW GC orbits we selected three particular clusters: NGC6838, NGC6401, and NGC1904 on CR, TB, and LR orbits, respectively. In Paper I the clusters were integrated in the TNG potential; however, for this work we also carried out the orbital integration in FIX static potential for these GCs. Finally, we had two numerical models for each of these three clusters in both potentials. As an illustration, Fig. 1 shows the orbital visualisation for circular orbit in TNG and FIX potentials over the span of 8 Gyr up to the present time. Orbital visualisations for tube and long radial orbits in both potentials can be found in Figs. A.1 and A.2.
To carry out the simulations, we assumed the following initial conditions. The first-generation stars in each cluster are initially in a state of dynamical equilibrium with individual positions and velocity vectors that were obtained from the backward orbital integration at T = −8 Gyr (see Table 2).
For the first stellar generation, we adopted the initial mass for the total mass M = 1.5×10⁵ M⊙ and the Kroupa initial mass function (IMF) (Kroupa 2001) in the range 0.08–100 M⊙. The total number of particles was N = 261 384. We used the distribution function of the most concentrated King model (King 1966) with the dimensionless central potential W0 = 9.0. The initial half-mass radius rhm was assumed to be 2 pc. Because we used a possible lower limit for our GCs initial masses, we compensated for this by using a quite small initial half-mass radius for the GC first generation. With our current parameters the model GC has an average mass density of ~19k M⊙/pc3. This density is compatible with our earlier GC numerical simulations in Paper III, see Table 2. We also use the classical solar value for the initial stellar metallicity: Z = Z⊙ = 0.02 (Grevesse & Sauval 1998). These conditions are the same for all our GC models (see Table 2). The first stellar generation is labelled ɡ1.
Figure 2 presents the density distribution at −6.0 Gyr for the GC on a tube orbit in the TNG (upper panels) and FIX potentials (lower panels). The four left panels show densities in the galacto- centric coordinate system, while the four middle panels show the density distribution in the central core of the cluster (5 × 5 pc). The cyan and brown dots indicate black holes and neutron stars, respectively. Finally, the four right panels show the second stellar generation (described in Sect. 2.3). The density distributions for the other orbits can be found in Figs. B.1 and B.2.
By the time we inserted the second-generation stars, after 2 Gyr of evolution, the first-generation stars had already experienced significant mass loss (see Table 3). As we see from the table, the TB and LR models in FIX potential lose almost ~80–70% of their initial mass. In the case of the TNG the TB model loses ~50% (see black vertical line in Fig. 5). This is evident for the TB and LR orbits, where the clusters undergo close approaches to the Galactic centre, leading to enhanced tidal stripping. The mass loss is more prominent in the FIX potential.
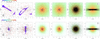 |
Fig. 2 GC density distribution at −6.0 Gyr for the tube orbit at the moment when the second-generation stars (ɡ2) are added to the GC. The two left panels show the GC in global galactocentric coordinates. The cyan and brown dots show BHs and NSs in the GC. The two middle panels show the density of the central GC core (5 × 5 pc). The two right panels show the initial spatial distributions of the ɡ2 stars in the GC (black dots) that form a disk. The upper and lower panels show the density distribution inside the GC in the 411321 and the FIX potentials, respectively. |
Initial kinematical and physical characteristics of GCs at T = −8 Gyr.
Physical parameters of the GCs after 2 Gyr of evolution.
2.3 Second stellar generation
After 2 Gyr of dynamical evolution of the cluster we added to the system the ɡ2 stellar subsystem. For each simulation we added the same mass of the ɡ2 population, namely 8000 M⊙ with the same Kroupa IMF as the first generation ɡ2. To the ɡ1 stars we added 13 940 ɡ2 stars, which corresponds to 5% of the initial mass of the ɡ1. The main assumption in our models is that the g2 stars form from the AGB ejecta of ɡ1 stars; this imposes an upper limit on the initial mass of g2 stars relative to the initial mass of g1 stars. For an IMF of the stellar system given by dN = ξ(m) dm, assuming that g2 stars form from AGB stars with initial masses between m1 and m2, the mass fraction of AGB stars relative to the total stellar mass is
 (1)
(1)
where mlow and mhigh are the overall lower and upper mass limits of the IMF. Following the arguments of Bekki (2010), who proposed that ɡ2 stars form from AGB stars with initial masses between 5 and 8 M⊙, the mass fraction of AGB stars relative to the total stellar mass is approximately 0.06 for the Kroupa IMF ξ(m) = ξ0m−α with the power-law index α = 1.3 for 0.08 < m < 0.5 M⊙ and α = 2.3 for m > 0.5 M⊙ (with the mass limits between 0.08 M⊙ and 100 M⊙). Considering that 83–86% of the mass of these AGB stars can be ejected (Gnedin et al. 2002), and assuming that all of this material converts into ɡ2 stars, we estimated that approximately 5% of the total mass of the ɡ1 stars may end up in ɡ2 stars. We allowed the ɡ1 stars to relax dynamically before introducing the ɡ2 stars, resulting in mass fractions of ɡ2 stars ranging between 8% and 32% at the time of their addition.
In our set-up the main difference between ɡ1 and ɡ2 stars is the disk-like distribution of the ɡ2 stars. There are no solid constraints on the initial thickness of the possible ɡ2 stars in globular clusters. However, during star formation in disks, which is observed in galactic nuclei (e.g. in the central half-parsec of the MW), the so-called clockwise stellar disk, appears to have the orbital angular momentum vectors distributed in the range of 10–15 degrees (von Fellenberg et al. 2022; Jia et al. 2023). In our case, the disk distribution was generated using the rejection method from the initial spherical Plummer particle distribution, selecting stars that have positive angular momentum with a polar angle of less than ten degrees from the Z-axis,
 (2)
(2)
where the angular momentum is calculated with respect to the centre of mass of the cluster.
The original Plummer model was generated with an initial half-mass radius rhm of 2 pc. These ɡ2 stars were initialised at the centre of the evolved ɡ1 stellar system. As the ɡ1 stars experience stellar evolution and dynamical (Galactic tidal) mass loss over the first 2 Gyr, the insertion of 8000 M⊙ of ɡ2 stars results in different mass fractions of ɡ2 relative to ɡ1, depending on the orbit and potential. In Table 4 we present the mass and number ratios of ɡ1 and ɡ2 stars at the moment when the ɡ2 stars are inserted, highlighting how the additional ɡ2 mass contributes different percentages relative to the current stellar mass of the g1 population for each orbit and potential.
In Fig. 3, we show the initial positions of ɡ2 stars. The 3D mass density values within the star cluster (in M⊙/pc3) are colour-coded within the central 5×5 pc region (see colour scale). The two right panels in Fig. 2 show the initial positions for the ɡ2 stars in the central 5 pc × 5 pc of the GCs on TB orbits. Similarly, Figs. B.1 and B.2. in Appendix B show the initial positions for the GCs on CR and LR orbits, respectively.
Initial mass ratio of the ɡ2 to the ɡ1 current mass.
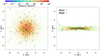 |
Fig. 3 Initial density distribution for second-generation stars (colour- coded dots). The dark green and magenta dots show the positions of the NS and BH progenitors, respectively. |
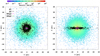 |
Fig. 4 GC density distribution at −6.0 Gyr lookback time for the ISO model. The dark green and magenta dots show the BHs and NSs, respectively. The black dots represent the initial positions of the second- generation stars ɡ2. |
2.4 Isolated system
For comparison, we also simulated the star clusters in complete isolation (i.e. no external galactic potential). These models are labelled ISO. For this set of runs we used exactly the same initial particle distributions as described in the previous sections. To illustrate the ɡ1 and ɡ2 star distributions, Fig. 4 shows the central ɡ1 density distributions and the black dots show the ɡ2 initial positions within the GC.
The initial half-mass relaxation time for this system on which the orbital energies mix for different stars is (Binney & Tremaine 2008, Eq. (7.106))
 (3)
(3)
where σ is the one-dimensional velocity dispersion, ρ is the stellar density, 〈m〉 ≈ 0.574 M⊙ is the average mass, and ln Λ ≈ 11.0 is the Coulomb logarithm; the final equality (Meiron & Kocsis 2019) has α = 7.32 ± 0.15, P(r) is the period, and N(r) is the enclosed number of stars for which P = 0.37 Myr at the half-mass radius. The vector resonant relaxation (VRR) timescale on which the orbital inclinations mix is
 (4)
(4)
where βν = 1.33 ± 0.50 (Meiron & Kocsis 2019). The VRR timescale is prolonged for a rotating cluster (Kocsis & Tremaine 2011).
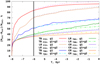 |
Fig. 5 Evolution of the mass loss in different GCs. The solid lines represent single generations ɡ1; the dotted and dot-dashed lines are for multiple generations ɡ1+ɡ2. The black vertical line indicates the time when the second generation of stars ɡ2 is added into the GCs. |
3 General dynamical evolution of the combined systems
3.1 Mass loss
Our numerical simulations follow the stellar mass loss of the GCs due to stellar evolution and to tidal stripping by the external potential. First, we compare the mass loss of GCs with one and two stellar generations in Fig. 5. We compare the mass loss for simple models, ɡ1-only (solid lines), and for two stellar population models, ɡ1+ɡ2 (dashed lines). The figure shows that in the first ~10 Myr the single-generation GCs (i.e. only ɡ1 stars) lost roughly ~25% of their initial masses.
We now examine the influence of the external potential on the clusters’ mass loss with one and two stellar generation models. In the time evolving TNG potential, the GCs on TB and LR orbits lose ~40–60% of their initial masses by today. In the opposite case with the static FIX potential, the GC mass loss is significantly greater (i.e. ~60–95%). GC models in the FIX external potential typically lose two times more mass compared to the corresponding GC model in the time-variable TNG external potential. Figure 5 shows that adding a second stellar generation ɡ2 into the cluster leads to somewhat different mass loss behaviours. The GCs dissolve faster for the FIX potential for LR and TB orbits. In the time evolving TNG potentials the models show a slower cluster dissolution rate.
We now discuss in detail the dynamical evolution of the single generation ɡ1 and mixed generation ɡ1+ɡ2 clusters. Figure 6 presents the evolution of the GC’s global physical parameters, including the tidal mass (Mtid) and half-mass radii (rhm). We obtained the cluster tidal mass based on the iterative procedure, described in detail in King (1962), Just et al. (2009), and Ernst et al. (2011). As a result, we simultaneously obtain the cluster tidal mass (Mtid), which is currently bound to the cluster, and the corresponding cluster tidal or Jacobi radius (rJ). After identifying the cluster members based on the simple distance criteria r < rJ, we derived the half-mass radius of the system. We repeated this procedure for each simulation snapshot.
Generally, we find that clusters on TB and LR orbits show significantly fluctuating, non-monotonic behaviour for the tidal mass and half-mass radii during their whole orbital evolution, both for the ɡ1 and for the ɡ1+ɡ2 stellar populations. These short time variations have quite a significant range (up to ~20– 30%) for the TNG external potential. This kind of behaviour is much less prominent, nearly non-existent for the FIX potential. In the case of TB orbits, this behaviour can be explained by the much more compact extent of the orbit in the FIX potential (see Fig. A.1). The orbits are initially much wider in the TNG potential in order to yield the same final orbit observed today since the halo and galaxy masses were initially much smaller in the TNG case. In the case of the LR orbit the differences in the orbital shape is much less prominent (see Fig. A.2).
In addition, Table 3 shows that the GCs in the FIX potential lose more stellar mass than their counterparts in the TNG potential. The GC on tube orbit in the FIX potential is almost completely destroyed, the GC on circular orbit is more resilient. This effect can be easily explained by the strong influence of the mass in the FIX bulge potential. At the same time, models with circular orbits, which have almost no interaction with the bulge during their evolution, show higher survival rates. For the clusters on CR orbits we see a smooth evolution for both the TNG and FIX potentials for both the g1 and the g1+g2 populations, as expected since in this case the potential does not fluctuate rapidly along the GC orbit.
For all models the addition of the second-generation stars naturally increases the tidal mass of the cluster and decreases rhm. The second process occurs because the added second generation is initially more compact compared to the distribution of the first generation at that time. As a result, the mixed stellar system g1+g2 has a smaller rhm compared to the g1-only stellar system.
Figure 7 presents the 3D velocity distribution of the GC stars for the ɡ1-only and the ɡ1+ɡ2 models at T = -5 Gyr. In the case of the TB and LR models in the FIX potential, we clearly see small values (TB ~3 km s−1 and LR 6 km s−1) compared with same model in TNG potential (TB ~13 km s−1 and LR 15 km s−1 ). This velocity behaviour is due to the fact that the clusters in the FIX potential have lost between 70–90% of their initial mass after 3 Gyr of their evolution (see Fig. 5).
The two left panels in Fig. 8 show the evolution of the mean tangential (i.e. rotational) velocities for the ɡ1+ɡ2 and ɡ2 stellar populations. The solid green and red lines show the models in the TNG and FIX potentials, respectively, and the blue curves show the isolated case: ISO. The two right panels show the evolution of the tangential velocity dispersion. Generally, we conclude that irrespective of the orbit type and external potential, the mean tangential (i.e. rotational) velocity is always negligible when averaging over both ɡ1+ɡ2 stars, given that the ɡ1 stars are initially isotropic and dominate the statistics. The mean initial tangential velocity of the ɡ2 stars decreases and becomes negligible by ~2 Gyr for almost all potentials and orbit families. The exception is the LR case where the tangential velocity decreases more slowly for the TNG potential than for the FIX potential.
The evolution of the tangential velocity dispersion (Fig. 8, right panels) shows significantly less dynamical evolution compared to the tangential velocity itself. The tangential velocity dispersion changes significantly only for the TB orbit in the FIX external potential, due to the significant ɡ1obal mass loss in the system (see Fig. 5).
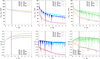 |
Fig. 6 Evolution of the GC physical parameters as a function of time: tidal mass (upper panels), and half-mass radii (bottom panels). The left, middle, and right columns show GCs on circular, tube, and radial orbits, respectively. The black vertical line gives the time when the ɡ2 generation is added to the GCs. |
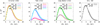 |
Fig. 7 3D velocity distributions of the particles in the GCs for ɡ1 and ɡ1+ɡ2 simulations at T = −5 Gyr (i.e. after approximately one two-body relation time) after inserting the ɡ2 component. The distributions are similar in all cases as the ɡ2 component represents a small fraction of the stars. |
4 Internal kinematics of the second stellar generation
In this section, we explore the internal kinematics of the ɡ2 stars in globular clusters, focusing on how this population evolves under the combined effects of internal dynamics driven by the ɡ1 stars and the external gravitational potential. A key question we aim to address is whether distinct kinematic features can be identified for the ɡ2 population, in order to shed light on its formation and origin. By analysing the structural evolution and angular momentum of this initially disk-like population, we also examine how it interacts and mixes with the ɡ1 stars over time.
4.1 Structure and shape
We recall that the ɡ2 stars are initialized as a flattened axisymmetric disk. To study the evolution of the shape of the disk, we fit an ellipsoid with axes a, b, and c using the matrix of moment of inertia (e.g. Regály et al. 2023). For this analysis, we selected the stars that are inside the tidal radius of the cluster. Figure 9 shows the time evolution of the axial ratios b/a (left panel) and c/a (right panel). The system approximately maintains its axial symmetry as b/a is close to unity or to c/a. However, the initially disky structure evolves towards a spherical shape as b/a and c/a approach unity. This evolution is relatively rapid: the disk thickens rapidly during the first ≈300 Myr, which is just one-third of the two-body relaxation time, while it is 3× the vector resonant relaxation time (Eqs. (3)–(4)), as is evident in the right panel of the figure. This behaviour is similar for all orbits and in both external potentials, which indicates that this process is mainly driven by the internal orbit-averaged dynamics of resonant relaxation rather than by close two-body encounters or by external forces (see Sect. 2.4). We refer to Appendix B for a visualization of the internal morphology of the GCs (the two right panels of Figs. B.9, B.10, B.11, B.12, B.13, and B.14).
4.2 The evolution of angular momentum
While the second stellar generation tends to acquire a spherical shape in less than 500 Myr or one-half the relaxation time in physical space, here we show that it may preserve its rotational signature in angular momentum space for much longer, in some cases until present.
Figure 10 illustrates the evolution of the respective specific angular momenta of the two stellar populations l = |Σi Li| / Σi mi as a function of time for the stars that are bound to the cluster. The three curves show the result for the ɡ1 and the ɡ2 components in the two-component model and that for the ɡ1-only simulation. The different panels show the different external potentials (FIX, TNG, ISO) and the different orbits (CR, TB LR), as labelled. The specific angular momentum of the ɡ2 component is by construction initially clearly larger than for the ɡ1 component for the circular orbits and for the isolated models. In these cases, the difference decreases due to two-body relaxation, but it remains very significant for 6 Gyr until present. However, for the TB and LR orbits, the external potential imparts large variations to the specific angular momentum for the ɡ1 component and lg1 ≪ lg2 no longer holds after a few billion years for the two TB orbits and immediately for the LR orbits. We conclude that clusters on periapsis orbits smaller than 5 kpc may lose their rotational signatures for the ɡ2 component, while those that are farther in the halo and/or on circular orbits may preserve memory of their initial rotation much beyond the half-mass two-body relaxation time, potentially until the present.
Another interesting question is how much the direction of angular momentum may change due to the external potential. Figures 11 and 12 illustrate the evolution of the Z-component of the total angular momentum for the combined stellar populations ɡ1+ɡ2 (Fig. 11) and for the ɡ2 component (Fig. 12) in the fixed and in the time-varying external potentials for the stars within the tidal radius. The upper part of the panels of the figures show the evolution of the Lz component in physical units, while the bottom part of the panels display the Lz/Ltot ratio. From left to right, the panels depict the results for circular, tube, long radial orbits, and the isolated case. The ɡ1+ɡ2 curves show that the angular momentum direction varies greatly over time, not only for the TB and LR orbits, but also for the circular orbits in the TNG external potential; the direction is roughly conserved only for the circular case in the fixed potential and for the isolated cluster. The evolution for the ɡ2 case (Fig. 12) is similarly variable to the ɡ1+ɡ2 case, with the exception that the direction of the angular momentum changes much less, not only for the ISO and CR cases, but also for the TB orbit for the ɡ2 component.
The total angular momentum is greatly affected by the change in the cluster mass (Fig. 5). Due to the faster mass loss in a fixed potential, the total angular momentum loss of the whole system occurs faster in a fixed potential than in the TNG potential (except for the circular orbit), as discussed in Sect. 3.1. The dynamics of angular momentum loss also varies with the GC orbit type, as already expected from the differences in the mass-loss rate (Fig. 5).
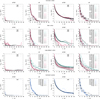 |
Fig. 8 Evolution of the mean tangential velocity (left two panels) and the tangential velocity dispersions (right two panels) for g1+ɡ2 stars and for the ɡ2 separately for the different external potentials and lookback times. The different rows of panels show different orbit families, as labelled. The solid green, red, and blue curves show models in time-variable TNG potential, the FIX potential, and the ISO isolated case, respectively. The different curves show different moments of time for each potential, as labelled. |
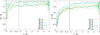 |
Fig. 9 Ratio of the moment of inertia matrix principal axes b/a and c/a for the second generation of stars ɡ2. The vertical line at −5.1Gyr shows the two-body relaxation time (900 Myr). A rapid change is visible much earlier on: a few times the 100 Myr VRR timescale (Eq. (4)). The solid lines represent TNG, the dashed lines are the FIX potentials, and the dot-dashed lines are the isolated cases. |
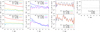 |
Fig. 10 Specific angular momentum of the ɡ1 and ɡ2 populations as a function of time in simulations with both subpopulations and the ɡ1+ɡ2 models. The different panels show different external potentials and different orbit types (Cols. 1–3: CR, TB, LR orbits; top row: TNG potential, bottom row: FIX potential; Col. 4: isolated cluster). The specific angular momentum for the ɡ2 component is calculated by dividing the total angular momentum magnitude of the ɡ2 stars with the respective instantaneous total mass of ɡ2 stars within the tidal radius at the same moment of time, and similarly for the ɡ1 stars. |
4.3 Relevance to the observed clusters
In the previous subsection, we show that the orbital type of GCs may determine whether the ɡ2 stars retain their rotational imprint. Although we have shown the analysis of only three orbits, the prediction is that if the ɡ2 stars initially formed with higher angular momentum than the ɡ1 stars, then the rotational imprint will be retained for the clusters on circular orbits or with large pericentre distances, even if the fraction of ɡ2 stars relative to ɡ1 is initially small. We now examine the data on multiple population clusters and their orbital parameters from the literature.
One of the most recent studies on kinematics of multiple stellar populations in GCs (Dalessandro et al. 2024) presents evidence that their sample ɡ2 stars generally rotate faster than the ɡ1 stars. Figure 13 shows the difference in the net rotation for the ɡ2 stars with respect to ɡ1 as a function of average peri-centre distance. The quantities ωɡ1 and ωɡ2 show the amount of rotation in the corresponding population (see Eqs. (10) and (2) in Dalessandro et al. 2024 for the definition of ω). The average pericentre and apocentre distances, from which we computed the average eccentricity, are from Baumgardt & Vasiliev (2021). We ignored the error bars in both datasets. The figure illustrates that clusters with larger galactocentric pericentre distances and lower eccentricities tend to show higher rotation in ɡ2 stars, consistent with our results5.
On the other hand, Leitinger et al. (2025) analysed a larger sample of GCs and reported no significant evidence of higher rotation in ɡ2 stars in general. The only exception in their sample is NGC 104 (47 Tuc), which is also present in the sample of Dalessandro et al. (2024), where higher rotation in ɡ2 stars was also observed. Interestingly, this cluster has a low eccentricity and a pericentre distance of more than 5 kpc.
Another prediction, independent of the second stellar generation, is that the external potential can spin up initially isotropic clusters for GCs on long radial orbits with high eccentricities and with small pericentre distances. Figure 14 shows the rotational velocities of clusters as a function of pericentre distance for a sample from Sollima et al. (2019) where the authors measured rotation and assigned probabilities of rotation. Although the figure does not show a strong trend, it suggests that clusters identified as rotating tend to exhibit higher rotational velocities at smaller pericentre distances. It is important to note that our prediction is valid only for initially isotropic clusters. Thus, clusters with high rotation but large pericentre distances may retain their intrinsic rotation rather than acquire it from the influence of the external potential.
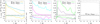 |
Fig. 11 Evolution of the angular momentum Z component for the combined stellar populations ɡ1+ɡ2 . Upper panels: evolution of Lz component in physical units; bottom panels: Lz/Ltot ratio. From left to right: circular, tube, and long radial orbits, and the isolated case. |
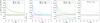 |
Fig. 12 Evolution of the angular momentum Z component for the second stellar population ɡ2. Upper panels: evolution of Lz component in physical units; bottom panels: Lz/Ltot ratio. From left to right: circular, tube, and long radial orbits, and the isolated case. |
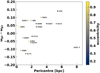 |
Fig. 13 Difference in rotation of ɡ2 stars relative to ɡ1 as a function of average pericentre distance over the past 500 Myr for a sample of clusters with multiple populations. The colour-coding shows the average eccentricities over the past 500 Myr. Positive values indicate that ɡ2 stars rotate faster than ɡ1 stars. The observational data on rotation are from Dalessandro et al. (2024), with orbital parameters from Baumgardt & Vasiliev (2021). The corresponding cluster names from the NGC catalogue are shown next to the data points. |
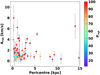 |
Fig. 14 Rotational velocity as a function of average pericentre distance over the past 500 Myr for a sample with measured rotational velocities. The colour-coding shows the probability that the cluster is rotating. Rotational magnitudes (with their error bars) and probabilities are from Sollima et al. (2019), with orbital parameters from Baumgardt & Vasiliev (2021). |
5 Conclusions and discussion
We performed a set of direct N-body simulations of globular clusters with two stellar generations. We put these clusters on three types of orbits within the Galaxy (TB, LR, and CR), which represent the reconstructed orbits of MW globular clusters. We evolved these clusters backward in time to a lookback time of 8 Gyr in the time-varying potential of the TNG simulation for a Milky Way-like galaxy. We then evolved the systems forward in time with stellar evolution, and introduced a disk of stars representing the second stellar generation after evolving the clusters for 2 Gyr.
To understand the role of a time-varying Galactic potential, we compared these simulations with control runs that featured a static potential and also compared the results with the isolated cluster evolution. This allowed us to investigate the combined effects of internal evolution and external tidal forces on the structure and dynamics of the combined two stellar generations.
We found that generally the tidal stripping mass loss of the clusters, depends primarily on the orbit type; in particular, GCs on tube and radial orbits lead to higher mass loss in both static and time-variable potentials. For the static potential, due to the higher mass of the Galaxy at early times, we observe a significantly higher mass loss of the GCs independently of the presence or absence of the second stellar generation. This dependence is most prominent for the tube and radial orbits. This effect also exists for circular GC orbits, but is less significant.
The addition of the second generation to the star cluster (at least in the present form, i.e. ~10% of the current system mass at 2 Gyr; see Table 4) does not change significantly the mass loss behaviour of the system (see Fig. 5). The star clusters’ main dynamical parameters, such as its tidal mass and half-mass radius, also behave similarly with and without this second generation (see Fig. 6). The second-generation stars supply the system with an additional number of high-mass remnants (BH and NS), which are concentrated in the central region a few parsecs in size of the star cluster (see the figures in Appendix B.
The initially disk-like second stellar population tends to become spherical rapidly, well within the two-body relaxation timescale in all of our models (Fig. 9), which is expected from vector resonant relaxation (Meiron & Kocsis 2019). The principal axes of the clusters’ geometry in physical space show that the clusters become almost spherical within ~500 Myr (i.e. 5x the VRR timescale and one-half the two-body relaxation timescale). We note that since the VRR timescales with star counts as N1/2 while the two-body timescales with N, the mixing time will always be much less than the Hubble time, even for the largest GCs well beyond those simulated in this work which may not yet be relaxed in terms of their energy distribution. In Eq. (3) we showed that vector resonant relaxation is a factor of 10 shorter for our system and a factor of 35 shorter for 106 M⊙ clusters compared to two-body relaxation. Thus, in terms of the clusters’ principal axes in physical space, complete mixing is expected to be a very robust prediction. However, the simulations show that the total specific angular momentum preserves the rotational imprint of the second-generation component for several billion years (Fig. 10). The rotational imprints for the second component cannot be distinguished from those of the first component for the long radial orbits with small periapsis distances because in this case the first component is spun up by the external potential. Thus, the external potential imparts a significant spin to the cluster in cases where the periapsis distance is only a few kiloparsecs, and the magnitude of the spin is expected to decrease with periapsis distance. At large distances the cluster’s specific angular momentum carries memory of the initial conditions.
Our results align with observations showing that clusters on circular or high-pericentre orbits tend to retain the rotational imprint of the second stellar generation (ɡ2), as seen in studies (e.g. Dalessandro et al. 2024), where ɡ2 stars are found to rotate faster than ɡ1 stars in such clusters. In contrast, Leitinger et al. (2025) report no consistent trend of higher rotation in ɡ2 stars across a broader sample with exceptions in specific cases, for example NGC 104. For overall cluster rotation, our simulations predict that GCs on eccentric or low-pericentre orbits may acquire angular momentum from the Galactic potential. Starting from an initially isotropic distribution with nearly zero angular momentum, clusters on these orbits develop a net spin due to tidal effects. Observations by Sollima et al. (2019) support this, showing a tendency for clusters with smaller pericentre distances to exhibit higher rotational velocities, although this trend lacks statistical significance. To make more robust predictions about the acquisition of angular momentum from the external potential, further simulations with a larger sample of clusters on a range of orbits are needed, along with more detailed observational data to confirm potential correlations between rotation and orbital parameters in multiple population clusters.
The rotational imprints of ɡ2 stars may be even more prominent in some Milky Way GCs than in our simulations. The initial mass fraction of ɡ2 stars in our models was set conservatively to ~5% of the original initial mass of ɡ1 stars, a reasonable assumption given their formation from AGB ejecta (D’Ercole et al. 2008). However, present-day clusters show higher fractions of second-generation stars (Milone & Marino 2022), probably due to the preferential loss of ɡ1 stars through tidal stripping. Furthermore, in our simulations, the ɡ2 stars were set to be distributed initially on the same spatial scale as the ɡ1 stars, which is consistent with some observed clusters, such as NGC 6362 (Dalessandro et al. 2014). However, many studies suggest that the ɡ2 stars are more centrally concentrated (Lardo et al. 2011; Bastian & Lardo 2018).
On the other hand, we introduced the first-generation stellar population at a lookback time of 8 Gyr to avoid uncertainties in the external potential at early times, but the globular cluster formation may have peaked much earlier at −12 Gyr (e.g. El-Badry et al. 2019). Furthermore, we introduced the second stellar generation at 2 Gyr after the first generation to allow the ɡ1 stars to relax. However, observations suggest that second-generation stars may have formed much earlier, likely within 100 Myr of the first generation (Marino et al. 2012). An earlier formation and a smaller age gap could allow more mixing to take place between the stellar populations during their evolution to the present.
Taking these considerations into account would improve the physical realism of our models. Additionally, more models are needed to describe clusters of different masses, concentrations, and radial locations within the Galaxy. Even more importantly, models may also be improved by incorporating the formation and evolution of hard binaries, possibly using regularised codes such as NBODY6++GPU (Wang et al. 2015) or PETAR (Wang et al. 2020). Given that we have demonstrated in this work that the time-varying potential plays an important role in the mass-loss evolution of star clusters, it may also be important to incorporate more realistic time-varying potentials from higher-resolution cosmological simulations such as TNG-50 (Nelson et al. 2019b) as these data become publicly available. Future models with these improvements will more accurately describe the dynamics of multiple stellar populations in GCs, thereby enhancing our understanding of their formation history and dynamical evolution.
Data availability
The Appendix B is available on Zenodo: https://zenodo.org/records/14601796
Acknowledgements
The work of TP and MI was funded by the Science Committee of the Ministry of Education and Science of the Republic of Kazakhstan (Grant No. AP22787256). PB and MI thank the support from the special program of the Polish Academy of Sciences and the U.S. National Academy of Sciences under the Long-term program to support Ukrainian research teams grant No. PAN.BFB.S.BWZ.329.022.2023. PB acknowledges the support by the National Science Foundation of China under grant NSFC No. 12473017. This work was supported by the UK Science and Technology Facilities Council Grant Number ST/W000903/1 (to B.K.).
Appendix A Visualisation of the GCs’ orbits
We present orbital evolution for the GCs with tube and long radial orbits in #411321 TNG external and FIX potentials. The orbital evolution is presented in three planes, (X − Y, X − Z, and R − Z, where R is the planar galactocentric radius). The total time of integration is a 8 Gyr lookback time and is shown by the coloured line.
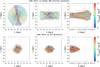 |
Fig. A.1 Simulated GC orbit for the GC on a tube orbit (NGC 6401) in the 411321 TNG and FIX potentials. |
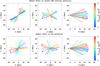 |
Fig. A.2 Simulated GC orbit for the GC on long radial (LR) orbit (NGC 1904) in the 411321 TNG and FIX potentials. |
References
- Arca Sedda, M., Kamlah, A. W. H., Spurzem, R., et al. 2023, MNRAS, 526, 429 [NASA ADS] [CrossRef] [Google Scholar]
- Arca Sedda, M., Kamlah, A. W. H., Spurzem, R., et al. 2024a, MNRAS, 528, 5119 [NASA ADS] [CrossRef] [Google Scholar]
- Arca Sedda, M., Kamlah, A. W. H., Spurzem, R., et al. 2024b, MNRAS, 528, 5140 [CrossRef] [Google Scholar]
- Banerjee, S., Belczynski, K., Fryer, C. L., et al. 2020, A&A, 639, A41 [NASA ADS] [CrossRef] [EDP Sciences] [Google Scholar]
- Bastian, N., & Lardo, C. 2018, ARA&A, 56, 83 [Google Scholar]
- Baumgardt, H., & Vasiliev, E. 2021, MNRAS, 505, 5957 [NASA ADS] [CrossRef] [Google Scholar]
- Bekki, K. 2010, ApJ, 724, L99 [CrossRef] [Google Scholar]
- Bellazzini, M., Bragaglia, A., Carretta, E., et al. 2012, A&A, 538, A18 [NASA ADS] [CrossRef] [EDP Sciences] [Google Scholar]
- Berczik, P., Nitadori, K., Zhong, S., et al. 2011, in International Conference on High Performance Computing, HPC-UA 2011, 8 [Google Scholar]
- Berczik, P., Spurzem, R., & Wang, L. 2013, in Third International Conference on High Performance Computing, HPC-UA 2013, 52 [Google Scholar]
- Bianchini, P., Varri, A. L., Bertin, G., & Zocchi, A. 2013, ApJ, 772, 67 [NASA ADS] [CrossRef] [Google Scholar]
- Bianchini, P., van der Marel, R. P., del Pino, A., et al. 2018, MNRAS, 481, 2125 [Google Scholar]
- Binney, J., & Tremaine, S. 2008, Galactic Dynamics, 2nd edn. (Princeton University Press) [Google Scholar]
- Boberg, O. M., Vesperini, E., Friel, E. D., Tiongco, M. A., & Varri, A. L. 2017, ApJ, 841, 114 [NASA ADS] [CrossRef] [Google Scholar]
- Bonnell, I. A., & Rice, W. K. M. 2008, Science, 321, 1060 [NASA ADS] [CrossRef] [Google Scholar]
- Calura, F., D’Ercole, A., Vesperini, E., Vanzella, E., & Sollima, A. 2019, MNRAS, 489, 3269 [Google Scholar]
- Cordero, M. J., Hénault-Brunet, V., Pilachowski, C. A., et al. 2017, MNRAS, 465, 3515 [NASA ADS] [CrossRef] [Google Scholar]
- Cordoni, G., Milone, A. P., Mastrobuono-Battisti, A., et al. 2020, ApJ, 889, 18 [Google Scholar]
- Cordoni, G., Marino, A. F., Milone, A. P., et al. 2023, A&A, 678, A155 [NASA ADS] [CrossRef] [EDP Sciences] [Google Scholar]
- Dalessandro, E., Massari, D., Bellazzini, M., et al. 2014, ApJ, 791, L4 [NASA ADS] [CrossRef] [Google Scholar]
- Dalessandro, E., Cadelano, M., Della Croce, A., et al. 2024, A&A, 691, A94 [NASA ADS] [CrossRef] [EDP Sciences] [Google Scholar]
- D’Ercole, A., Vesperini, E., D’Antona, F., McMillan, S. L. W., & Recchi, S. 2008, MNRAS, 391, 825 [CrossRef] [Google Scholar]
- El-Badry, K., Quataert, E., Weisz, D. R., Choksi, N., & Boylan-Kolchin, M. 2019, MNRAS, 482, 4528 [Google Scholar]
- Ernst, A., Just, A., Berczik, P., & Olczak, C. 2011, A&A, 536, A64 [NASA ADS] [CrossRef] [EDP Sciences] [Google Scholar]
- Fabricius, M. H., Noyola, E., Rukdee, S., et al. 2014, ApJ, 787, L26 [NASA ADS] [CrossRef] [Google Scholar]
- Ferraro, F. R., Mucciarelli, A., Lanzoni, B., et al. 2018, ApJ, 860, 50 [NASA ADS] [CrossRef] [Google Scholar]
- Generozov, A., Nayakshin, S., & Madigan, A. M. 2022, MNRAS, 512, 4100 [NASA ADS] [CrossRef] [Google Scholar]
- Gnedin, O. Y., Zhao, H., Pringle, J. E., et al. 2002, ApJ, 568, L23 [Google Scholar]
- Gratton, R., Bragaglia, A., Carretta, E., et al. 2019, A&A Rev., 27, 8 [NASA ADS] [CrossRef] [Google Scholar]
- Grevesse, N., & Sauval, A. J. 1998, Space Sci. Rev., 85, 161 [Google Scholar]
- Hénault-Brunet, V., Gieles, M., Agertz, O., & Read, J. I. 2015, MNRAS, 450, 1164 [CrossRef] [Google Scholar]
- Ishchenko, M., Sobolenko, M., Berczik, P., et al. 2023a, A&A, 673, A152 [NASA ADS] [CrossRef] [EDP Sciences] [Google Scholar]
- Ishchenko, M., Sobolenko, M., Kuvatova, D., Panamarev, T., & Berczik, P. 2023b, A&A, 674, A70 [NASA ADS] [CrossRef] [EDP Sciences] [Google Scholar]
- Ishchenko, M., Berczik, P., Panamarev, T., et al. 2024, A&A, 689, A178 [NASA ADS] [CrossRef] [EDP Sciences] [Google Scholar]
- Jeffreson, S. M. R., Sanders, J. L., Evans, N. W., et al. 2017, MNRAS, 469, 4740 [NASA ADS] [CrossRef] [Google Scholar]
- Jia, S., Xu, N., Lu, J. R., et al. 2023, ApJ, 949, 18 [NASA ADS] [CrossRef] [Google Scholar]
- Just, A., Berczik, P., Petrov, M. I., & Ernst, A. 2009, MNRAS, 392, 969 [Google Scholar]
- Just, A., Khan, F. M., Berczik, P., Ernst, A., & Spurzem, R. 2011, MNRAS, 411, 653 [Google Scholar]
- Kacharov, N., Bianchini, P., Koch, A., et al. 2014, A&A, 567, A69 [NASA ADS] [CrossRef] [EDP Sciences] [Google Scholar]
- Kamann, S., Husser, T.-O., Dreizler, S., et al. 2018, MNRAS, 473, 5591 [NASA ADS] [CrossRef] [Google Scholar]
- Kamlah, A. W. H., Leveque, A., Spurzem, R., et al. 2022a, MNRAS, 511, 4060 [NASA ADS] [CrossRef] [Google Scholar]
- Kamlah, A. W. H., Spurzem, R., Berczik, P., et al. 2022b, MNRAS, 516, 3266 [CrossRef] [Google Scholar]
- Kimmig, B., Seth, A., Ivans, I. I., et al. 2015, AJ, 149, 53 [NASA ADS] [CrossRef] [Google Scholar]
- King, I. 1962, AJ, 67, 471 [Google Scholar]
- King, I. R. 1966, AJ, 71, 64 [Google Scholar]
- Kocsis, B., & Tremaine, S. 2011, MNRAS, 412, 187 [NASA ADS] [CrossRef] [Google Scholar]
- Kocsis, B., & Tremaine, S. 2015, MNRAS, 448, 3265 [NASA ADS] [CrossRef] [Google Scholar]
- Kroupa, P. 2001, MNRAS, 322, 231 [NASA ADS] [CrossRef] [Google Scholar]
- Lacchin, E., Calura, F., Vesperini, E., & Mastrobuono-Battisti, A. 2022, MNRAS, 517, 1171 [NASA ADS] [CrossRef] [Google Scholar]
- Lanzoni, B., Ferraro, F. R., Mucciarelli, A., et al. 2018, ApJ, 861, 16 [NASA ADS] [CrossRef] [Google Scholar]
- Lardo, C., Bellazzini, M., Pancino, E., et al. 2011, A&A, 525, A114 [NASA ADS] [CrossRef] [EDP Sciences] [Google Scholar]
- Lardo, C., Pancino, E., Bellazzini, M., et al. 2015, A&A, 573, A115 [NASA ADS] [CrossRef] [EDP Sciences] [Google Scholar]
- Leitinger, E. I., Baumgardt, H., Cabrera-Ziri, I., et al. 2025, A&A, 694, A184 [Google Scholar]
- Levin, Y. 2007, MNRAS, 374, 515 [Google Scholar]
- Levin, Y., & Beloborodov, A. M. 2003, ApJ, 590, L33 [NASA ADS] [CrossRef] [Google Scholar]
- Libralato, M., Vesperini, E., Bellini, A., et al. 2023, ApJ, 944, 58 [CrossRef] [Google Scholar]
- Livernois, A., Vesperini, E., Tiongco, M., Varri, A. L., & Dalessandro, E. 2021, MNRAS, 506, 5781 [NASA ADS] [CrossRef] [Google Scholar]
- Livernois, A. R., Vesperini, E., Varri, A. L., Hong, J., & Tiongco, M. 2022, MNRAS, 512, 2584 [NASA ADS] [CrossRef] [Google Scholar]
- Mapelli, M. 2017, MNRAS, 467, 3255 [NASA ADS] [CrossRef] [Google Scholar]
- Mardini, M. K., Placco, V. M., Meiron, Y., et al. 2020, ApJ, 903, 88 [NASA ADS] [CrossRef] [Google Scholar]
- Marino, A. F., Milone, A. P., Piotto, G., et al. 2012, ApJ, 746, 14 [CrossRef] [Google Scholar]
- Martens, S., Kamann, S., Dreizler, S., et al. 2023, A&A, 671, A106 [NASA ADS] [CrossRef] [EDP Sciences] [Google Scholar]
- Mastrobuono-Battisti, A., & Perets, H. B. 2013, ApJ, 779, 85 [NASA ADS] [CrossRef] [Google Scholar]
- Mastrobuono-Battisti, A., & Perets, H. B. 2016, ApJ, 823, 61 [Google Scholar]
- Mastrobuono-Battisti, A., & Perets, H. B. 2021, MNRAS, 505, 2548 [NASA ADS] [CrossRef] [Google Scholar]
- McKenzie, M., & Bekki, K. 2021, MNRAS, 507, 834 [NASA ADS] [CrossRef] [Google Scholar]
- Meiron, Y., & Kocsis, B. 2018, ApJ, 855, 87 [Google Scholar]
- Meiron, Y., & Kocsis, B. 2019, ApJ, 878, 138 [NASA ADS] [CrossRef] [Google Scholar]
- Milone, A. P., & Marino, A. F. 2022, Universe, 8, 359 [NASA ADS] [CrossRef] [Google Scholar]
- Miyamoto, M., & Nagai, R. 1975, PASJ, 27, 533 [NASA ADS] [Google Scholar]
- Nelson, D., Pillepich, A., Springel, V., et al. 2018, MNRAS, 475, 624 [Google Scholar]
- Nelson, D., Pillepich, A., Springel, V., et al. 2019a, MNRAS, 490, 3234 [Google Scholar]
- Nelson, D., Springel, V., Pillepich, A., et al. 2019b, Computat. Astrophys. Cosmol., 6, 2 [NASA ADS] [CrossRef] [Google Scholar]
- Neumayer, N., Seth, A., & Böker, T. 2020, A&A Rev., 28, 4 [NASA ADS] [CrossRef] [Google Scholar]
- Panamarev, T., & Kocsis, B. 2022, MNRAS, 517, 6205 [CrossRef] [Google Scholar]
- Panamarev, T., Shukirgaliyev, B., Meiron, Y., et al. 2018, MNRAS, 476, 4224 [NASA ADS] [CrossRef] [Google Scholar]
- Panamarev, T., Just, A., Spurzem, R., et al. 2019, MNRAS, 484, 3279 [NASA ADS] [CrossRef] [Google Scholar]
- Paumard, T., Genzel, R., Martins, F., et al. 2006, ApJ, 643, 1011 [NASA ADS] [CrossRef] [Google Scholar]
- Petralia, I., Minniti, D., Fernández-Trincado, J. G., Lane, R. R., & Schiavon, R. P. 2024, A&A, 688, A92 [NASA ADS] [CrossRef] [EDP Sciences] [Google Scholar]
- Rauch, K. P., & Tremaine, S. 1996, New A, 1, 149 [NASA ADS] [CrossRef] [Google Scholar]
- Regály, Z., Fröhlich, V., & Berczik, P. 2023, A&A, 677, L6 [NASA ADS] [CrossRef] [EDP Sciences] [Google Scholar]
- Renzini, A., D’Antona, F., Cassisi, S., et al. 2015, MNRAS, 454, 4197 [Google Scholar]
- Scalco, M., Livernois, A., Vesperini, E., et al. 2023, MNRAS, 522, L61 [NASA ADS] [CrossRef] [Google Scholar]
- Sollima, A., Baumgardt, H., & Hilker, M. 2019, MNRAS, 485, 1460 [Google Scholar]
- Szigeti, L., Mészáros, S., Szabó, G. M., et al. 2021, MNRAS, 504, 1144 [NASA ADS] [CrossRef] [Google Scholar]
- Szölgyén, Á., Meiron, Y., & Kocsis, B. 2019, ApJ, 887, 123 [CrossRef] [Google Scholar]
- Tiongco, M. A., Vesperini, E., & Varri, A. L. 2019, MNRAS, 487, 5535 [NASA ADS] [CrossRef] [Google Scholar]
- Tiongco, M., Collier, A., & Varri, A. L. 2021, MNRAS, 506, 4488 [NASA ADS] [CrossRef] [Google Scholar]
- Vasiliev, E., & Baumgardt, H. 2021, MNRAS, 505, 5978 [NASA ADS] [CrossRef] [Google Scholar]
- Vesperini, E., McMillan, S. L. W., D’Antona, F., & D’Ercole, A. 2013, MNRAS, 429, 1913 [Google Scholar]
- Vesperini, E., Hong, J., Giersz, M., & Hypki, A. 2021, MNRAS, 502, 4290 [NASA ADS] [CrossRef] [Google Scholar]
- von Fellenberg, S. D., Gillessen, S., Stadler, J., et al. 2022, ApJ, 932, L6 [NASA ADS] [CrossRef] [Google Scholar]
- Wang, H., & Kocsis, B. 2023, Phys. Rev. D, 108, 103004 [CrossRef] [Google Scholar]
- Wang, L., Spurzem, R., Aarseth, S., et al. 2015, MNRAS, 450, 4070 [NASA ADS] [CrossRef] [Google Scholar]
- Wang, L., Spurzem, R., Aarseth, S., et al. 2016, MNRAS, 458, 1450 [Google Scholar]
- Wang, L., Iwasawa, M., Nitadori, K., & Makino, J. 2020, MNRAS, 497, 536 [NASA ADS] [CrossRef] [Google Scholar]
- Weinberg, S. 1993, The First Three Minutes: A Modern View of the Origin of the Universe (New York, USA: Basic Books) [Google Scholar]
The ORIENT: https://github.com/Mohammad-Mardini/The-ORIENT
N-body code φ-GPU: https://github.com/berczik/phi-GPU-mole
The possible influence of dynamical friction on clusters with close approaches to the Galactic centre is analysed in Sect. 4 of Paper III.
Visualisation for the 159 GCs orbits: https://sites.google.com/view/mw-type-sub-halos-from-illustr/GC-TNG?authuser=0
One notable outlier is NGC 3201 which is beyond 8 kpc.
All Tables
All Figures
|
Fig. 1 Circular orbit in 411321 TNG (top row) and FIX external potentials (bottom row). Time is colour-coded (see colour bar at right). The red dots represent the GC’s position at up to 8 Gyr in lookback time; the blue dots are the current position. |
| In the text | |
|
Fig. 2 GC density distribution at −6.0 Gyr for the tube orbit at the moment when the second-generation stars (ɡ2) are added to the GC. The two left panels show the GC in global galactocentric coordinates. The cyan and brown dots show BHs and NSs in the GC. The two middle panels show the density of the central GC core (5 × 5 pc). The two right panels show the initial spatial distributions of the ɡ2 stars in the GC (black dots) that form a disk. The upper and lower panels show the density distribution inside the GC in the 411321 and the FIX potentials, respectively. |
| In the text | |
|
Fig. 3 Initial density distribution for second-generation stars (colour- coded dots). The dark green and magenta dots show the positions of the NS and BH progenitors, respectively. |
| In the text | |
|
Fig. 4 GC density distribution at −6.0 Gyr lookback time for the ISO model. The dark green and magenta dots show the BHs and NSs, respectively. The black dots represent the initial positions of the second- generation stars ɡ2. |
| In the text | |
|
Fig. 5 Evolution of the mass loss in different GCs. The solid lines represent single generations ɡ1; the dotted and dot-dashed lines are for multiple generations ɡ1+ɡ2. The black vertical line indicates the time when the second generation of stars ɡ2 is added into the GCs. |
| In the text | |
|
Fig. 6 Evolution of the GC physical parameters as a function of time: tidal mass (upper panels), and half-mass radii (bottom panels). The left, middle, and right columns show GCs on circular, tube, and radial orbits, respectively. The black vertical line gives the time when the ɡ2 generation is added to the GCs. |
| In the text | |
|
Fig. 7 3D velocity distributions of the particles in the GCs for ɡ1 and ɡ1+ɡ2 simulations at T = −5 Gyr (i.e. after approximately one two-body relation time) after inserting the ɡ2 component. The distributions are similar in all cases as the ɡ2 component represents a small fraction of the stars. |
| In the text | |
|
Fig. 8 Evolution of the mean tangential velocity (left two panels) and the tangential velocity dispersions (right two panels) for g1+ɡ2 stars and for the ɡ2 separately for the different external potentials and lookback times. The different rows of panels show different orbit families, as labelled. The solid green, red, and blue curves show models in time-variable TNG potential, the FIX potential, and the ISO isolated case, respectively. The different curves show different moments of time for each potential, as labelled. |
| In the text | |
|
Fig. 9 Ratio of the moment of inertia matrix principal axes b/a and c/a for the second generation of stars ɡ2. The vertical line at −5.1Gyr shows the two-body relaxation time (900 Myr). A rapid change is visible much earlier on: a few times the 100 Myr VRR timescale (Eq. (4)). The solid lines represent TNG, the dashed lines are the FIX potentials, and the dot-dashed lines are the isolated cases. |
| In the text | |
|
Fig. 10 Specific angular momentum of the ɡ1 and ɡ2 populations as a function of time in simulations with both subpopulations and the ɡ1+ɡ2 models. The different panels show different external potentials and different orbit types (Cols. 1–3: CR, TB, LR orbits; top row: TNG potential, bottom row: FIX potential; Col. 4: isolated cluster). The specific angular momentum for the ɡ2 component is calculated by dividing the total angular momentum magnitude of the ɡ2 stars with the respective instantaneous total mass of ɡ2 stars within the tidal radius at the same moment of time, and similarly for the ɡ1 stars. |
| In the text | |
|
Fig. 11 Evolution of the angular momentum Z component for the combined stellar populations ɡ1+ɡ2 . Upper panels: evolution of Lz component in physical units; bottom panels: Lz/Ltot ratio. From left to right: circular, tube, and long radial orbits, and the isolated case. |
| In the text | |
|
Fig. 12 Evolution of the angular momentum Z component for the second stellar population ɡ2. Upper panels: evolution of Lz component in physical units; bottom panels: Lz/Ltot ratio. From left to right: circular, tube, and long radial orbits, and the isolated case. |
| In the text | |
|
Fig. 13 Difference in rotation of ɡ2 stars relative to ɡ1 as a function of average pericentre distance over the past 500 Myr for a sample of clusters with multiple populations. The colour-coding shows the average eccentricities over the past 500 Myr. Positive values indicate that ɡ2 stars rotate faster than ɡ1 stars. The observational data on rotation are from Dalessandro et al. (2024), with orbital parameters from Baumgardt & Vasiliev (2021). The corresponding cluster names from the NGC catalogue are shown next to the data points. |
| In the text | |
|
Fig. 14 Rotational velocity as a function of average pericentre distance over the past 500 Myr for a sample with measured rotational velocities. The colour-coding shows the probability that the cluster is rotating. Rotational magnitudes (with their error bars) and probabilities are from Sollima et al. (2019), with orbital parameters from Baumgardt & Vasiliev (2021). |
| In the text | |
|
Fig. A.1 Simulated GC orbit for the GC on a tube orbit (NGC 6401) in the 411321 TNG and FIX potentials. |
| In the text | |
|
Fig. A.2 Simulated GC orbit for the GC on long radial (LR) orbit (NGC 1904) in the 411321 TNG and FIX potentials. |
| In the text | |
Current usage metrics show cumulative count of Article Views (full-text article views including HTML views, PDF and ePub downloads, according to the available data) and Abstracts Views on Vision4Press platform.
Data correspond to usage on the plateform after 2015. The current usage metrics is available 48-96 hours after online publication and is updated daily on week days.
Initial download of the metrics may take a while.